1. Introduction
Earthquakes and other natural events can cause the sudden collapse of a structure but, in most cases, a structure is subject to a continuous deterioration of the exposed surfaces due to natural ageing of the materials, the erosion caused by wind and rain, and pollutants, as well as the effects of the thermal cycles. All these phenomena cause a decrease in the material strength and so of its structural capacity [
1]. As a result, the life of any structure cannot be infinite and a suitable maintenance is necessary, which should be based on a suitable structural health monitoring and/or periodical tests. Among the actions that affect the historical constructions, a particular role is played by traffic-induced vibrations [
2]. These usually accelerate the deterioration processes and increase the static and seismic vulnerability of historic structures. It is worth reminding that, from a structural point of view, the analysis of ancient constructions is quite hard. They are usually characterized by a complex geometry and are composed by elements with uncertain connections to each other and materials with strongly nonlinear behavior. Therefore, the mathematical modelling of historic structures, which is needed to analyze the expected behavior under static and dynamic loadings and define a retrofit intervention, is characterized by large uncertainties [
3,
4,
5]. The experimental dynamic analysis can be very helpful to understand the characterization of such complex structures [
6,
7].
A comprehensive review of the state-of-the-art on the experimental analysis of monumental structures is reported in [
8]. Masonry tower structures and columns are certainly the most interesting and mostly studied types of structures. In [
9], the seismic performance of historical masonry towers in Northern Italy has been evaluated, including cases characterized by high slenderness and/or inclination. In [
10], a large amount of data available inn literature was analyzed in order to identify the influence of the different geometrical and mechanical parameters on the dynamic behavior of slender masonry towers. Among the previous studies, it is worth reminding the following case studies:
The behavior of the Flaminio Obelisk in Rome was analyzed under ambient, traffic-induced, and forced vibrations, in conjunction with sonic tests on degraded blocks of the obelisk, in the framework of a restoration project [
11];
The medieval Bell Tower of S. Giorgio Church in Trignano, Italy, seriously damaged by the 1996 Reggio Emilia Earthquake (Ml = 4.8), was monitored for about two months by means of an accelerometeric network, before the restoration with shape memory alloy devices [
12];
The Marcus Aurelius’ and Trajan’s Columns, the so-called Coclid Columns, were instrumented and analyzed more times, recording ambient vibrations during different times of the day [
13,
14] (data were analyzed in time and frequency domains, evaluating the maximum effects in the structures and extracting their dynamic properties);
The leaning Minaret in Jam, Afghanistan, located in a narrow valley, at the confluence of the Hari Rud river with the Jam Rud river, object of a detailed stability analysis [
15];
The Stilite Tower at Umm Ar-Rasas, Jordan, where the soil and the structural material were analyzed by means of in situ experimental tests [
16,
17].
In the last two cases, the towers are only merely the most visible elements of the archaeological sites, which include also other historic elements.
Focusing the attention on archaeological sites, these are often characterized by the presence of ancient structures which become ruins because of past catastrophic events and abandoned to the effects of nature [
18]. In most cases, they have been rediscovered in recent decades or centuries, have become tourist sites visited by thousands or even millions of people every year, and have been used for social events. For all these reasons, the conservation of archaeological sites must be guaranteed together with an appropriate degree of safety. They can represent also an important source for the economy. Among the relevant archeological sites object of previous experimental studies are:
The Colosseum in Rome (the remaining portion of the tallest wall which was analyzed in detail by means of ambient and traffic-induced vibrations [
19,
20]);
The Roman Arena in Verona, Italy (where a SHM system was installed with the purpose of evaluating its structural response to static, dynamic (e.g., shows, concerts), and seismic loads [
21]);
Villa dei Misteri (one of the most famous domus in the ancient city of Pompeii, which was the object of a detailed study by means of a multidisciplinary approach, whose main scope was the evaluation of the health status of the protecting roofs [
22]);
The Temple of Winged Lions located inside the Petra Archaeological Park, Jordan (where a multidisciplinary study was conducted to support the Jordan authorities in developing a long-term management and conservation strategy for the site [
23]).
In this paper, the Circus Maximus in Rome, which is one of the world largest archaeological sites, is studied as part of preservation effort. Every day, it is subject to the presence of tourists as well as ambient and traffic-induced vibrations and sometimes to social events, such concerts and sport celebrations. On 7 September 2019, the Circus hosted the concert of Thegiornalisti band at the north-west side of the archaeological area. About 40,000 peoples attended the event. The vibrations of the archaeological ruins and the Torre della Moletta, which are at the south-east side of the Circus, were recorded before, during, and after the concert and analyzed both in time and frequency domains. The results pointed out relevant differences in terms of amplitudes and preferred vibration directions but also in terms of frequency content during the concert with respect to the other intervals. These vibrations could be very dangerous for some particularly vulnerable portions, such as remains of the vaults.
Experimental observations were also made on the ground through single-station noise measurements (conducted before, during, and after the event) to infer the fundamental frequency at the site via the horizontal–vertical spectral ratio (HVSR) technique [
24]. The noise recordings were coupled by an active seismic surface waves test for the estimation of the shear waves (Vs) profile. A significant inversion of the Vs was detected near surface, but the seismic bed-rock is expected at depths of some hundred meters.
2. The Circus Maximus Area
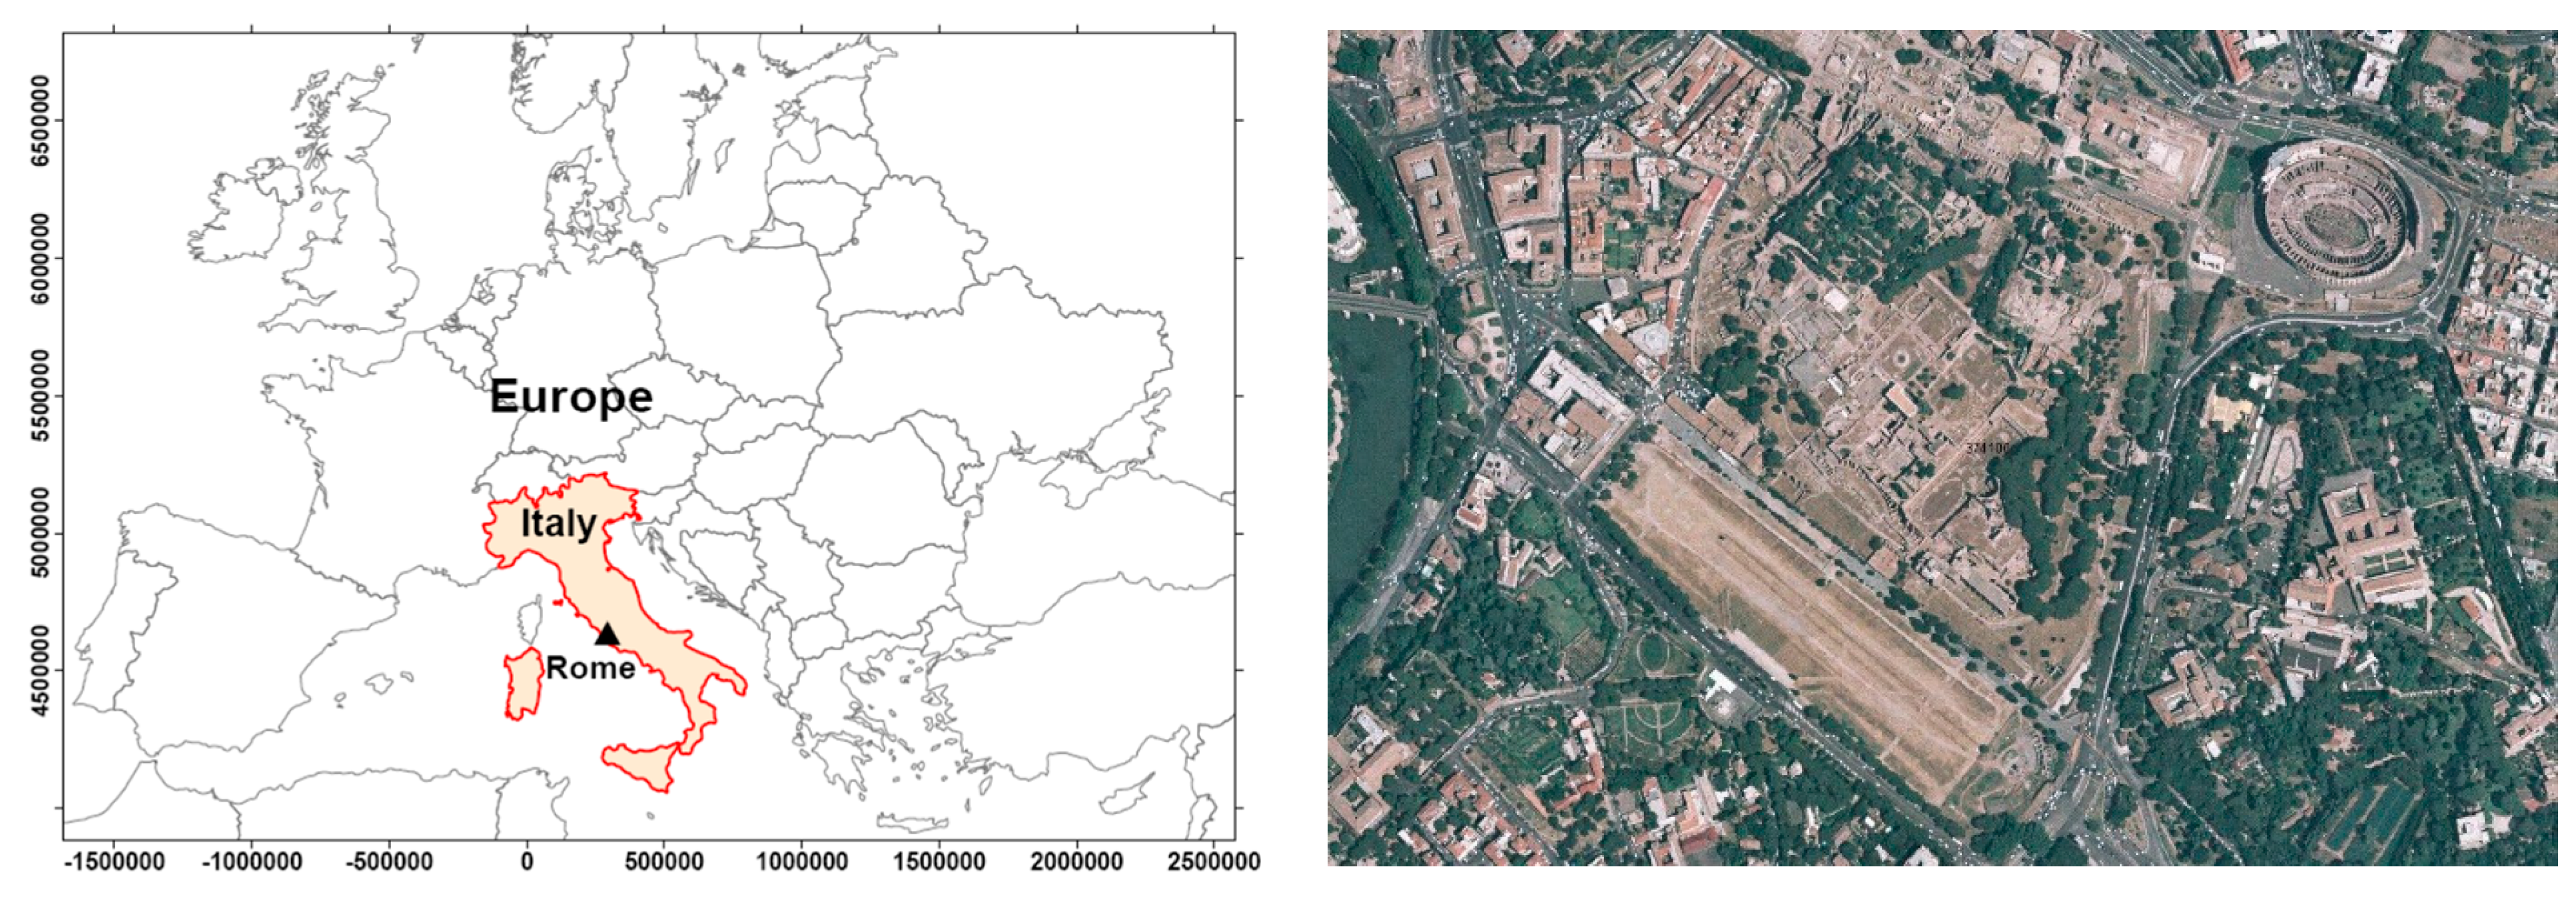
The Circus Maximus, which separates the Aventine and Palatine hills in Rome, is an ancient Roman chariot-racing stadium and mass entertainment venue (
Figure 1 and
Figure 2) [
25,
26]. It was the first and largest stadium for the famous “ludi romani”, the public games connected to Roman religious’ festivals. According to Titus Livius, the first Etruscan king of Rome, Lucius Tarquinius Priscus built and raised the wooden perimeter seating at the Circus for the equites and patricians (the highest echelons) of Rome, in the first half of the sixth century BC. Then, the last of the seven kings of Rome, Tarquinius Superbus, added the seating for citizen commoners, called plebeians.
The construction of the first stable plants dates back to 329 BC, but the first masonry structures, especially related to the equipment for the races, were probably built in the second century BC. Julius Caesar built the first masonry seats and gave the building its definitive shape, starting from 46 BC. After a fire, the Circus was restored by Augustus, who added an Egyptian obelisk extracted at the time of Ramses II and brought from Egypt in 10 BC. In 357, a second obelisk was brought to Rome by emperor Constantius II and erected on the thorn of the Circus. As is already well known, the first obelisk was moved by Pope Sixtus V to Piazza del Popolo in XVI century [
9], and the second one is now located behind the basilica of San Giovanni in Laterano [
27].
Other restorations were completed under the emperors Tiberius and Nero. An arch was erected by Tito in 81 AD in the center of the short curvilinear side and a monumental passage was integrated into the structures of the circus.
Most of the remains preserved date back to Domitian that begun a reconstruction after a fire, which was completed by Trajan in 103 AD. Other restorations were performed under Antonino Pio, Caracalla, and Costantino I. The circus remained in efficiency until the last competitions organized by Totila, Ostrogoth’s king, in 549. After the 6th century, the Circus fell into disuse and decay, and was quarried for building materials. The lower levels, ever prone to flooding, were gradually buried under waterlogged alluvial soil and accumulated debris, so that the original track is now buried 6 m beneath the present surface.
In the second millennium, the area underwent several vicissitudes. Finally, in the mid-19th century, workings at the circus site uncovered the lower parts of a seating tier and outer “portico”. Since then, a series of excavations exposed further sections of the seating, curved turn, and central barrier, but further exploration was limited by the scale, depth, and waterlogging of the site.
The Circus site is now a large park area. It is often used for concerts:
2 July 2005—the Rome concert of Live 8 was held there;
14 July 2007—the English band Genesis performed a concert before an estimated audience of 500,000 people;
22 June 2014—the Rolling Stones played in front of 71,527 people.
The Circus has also hosted sport celebrations following:
In May 2019, a new virtual and augmented reality experience, the Circo Maximo Experience, opened on the site, taking visitors on a journey through the site and its history.
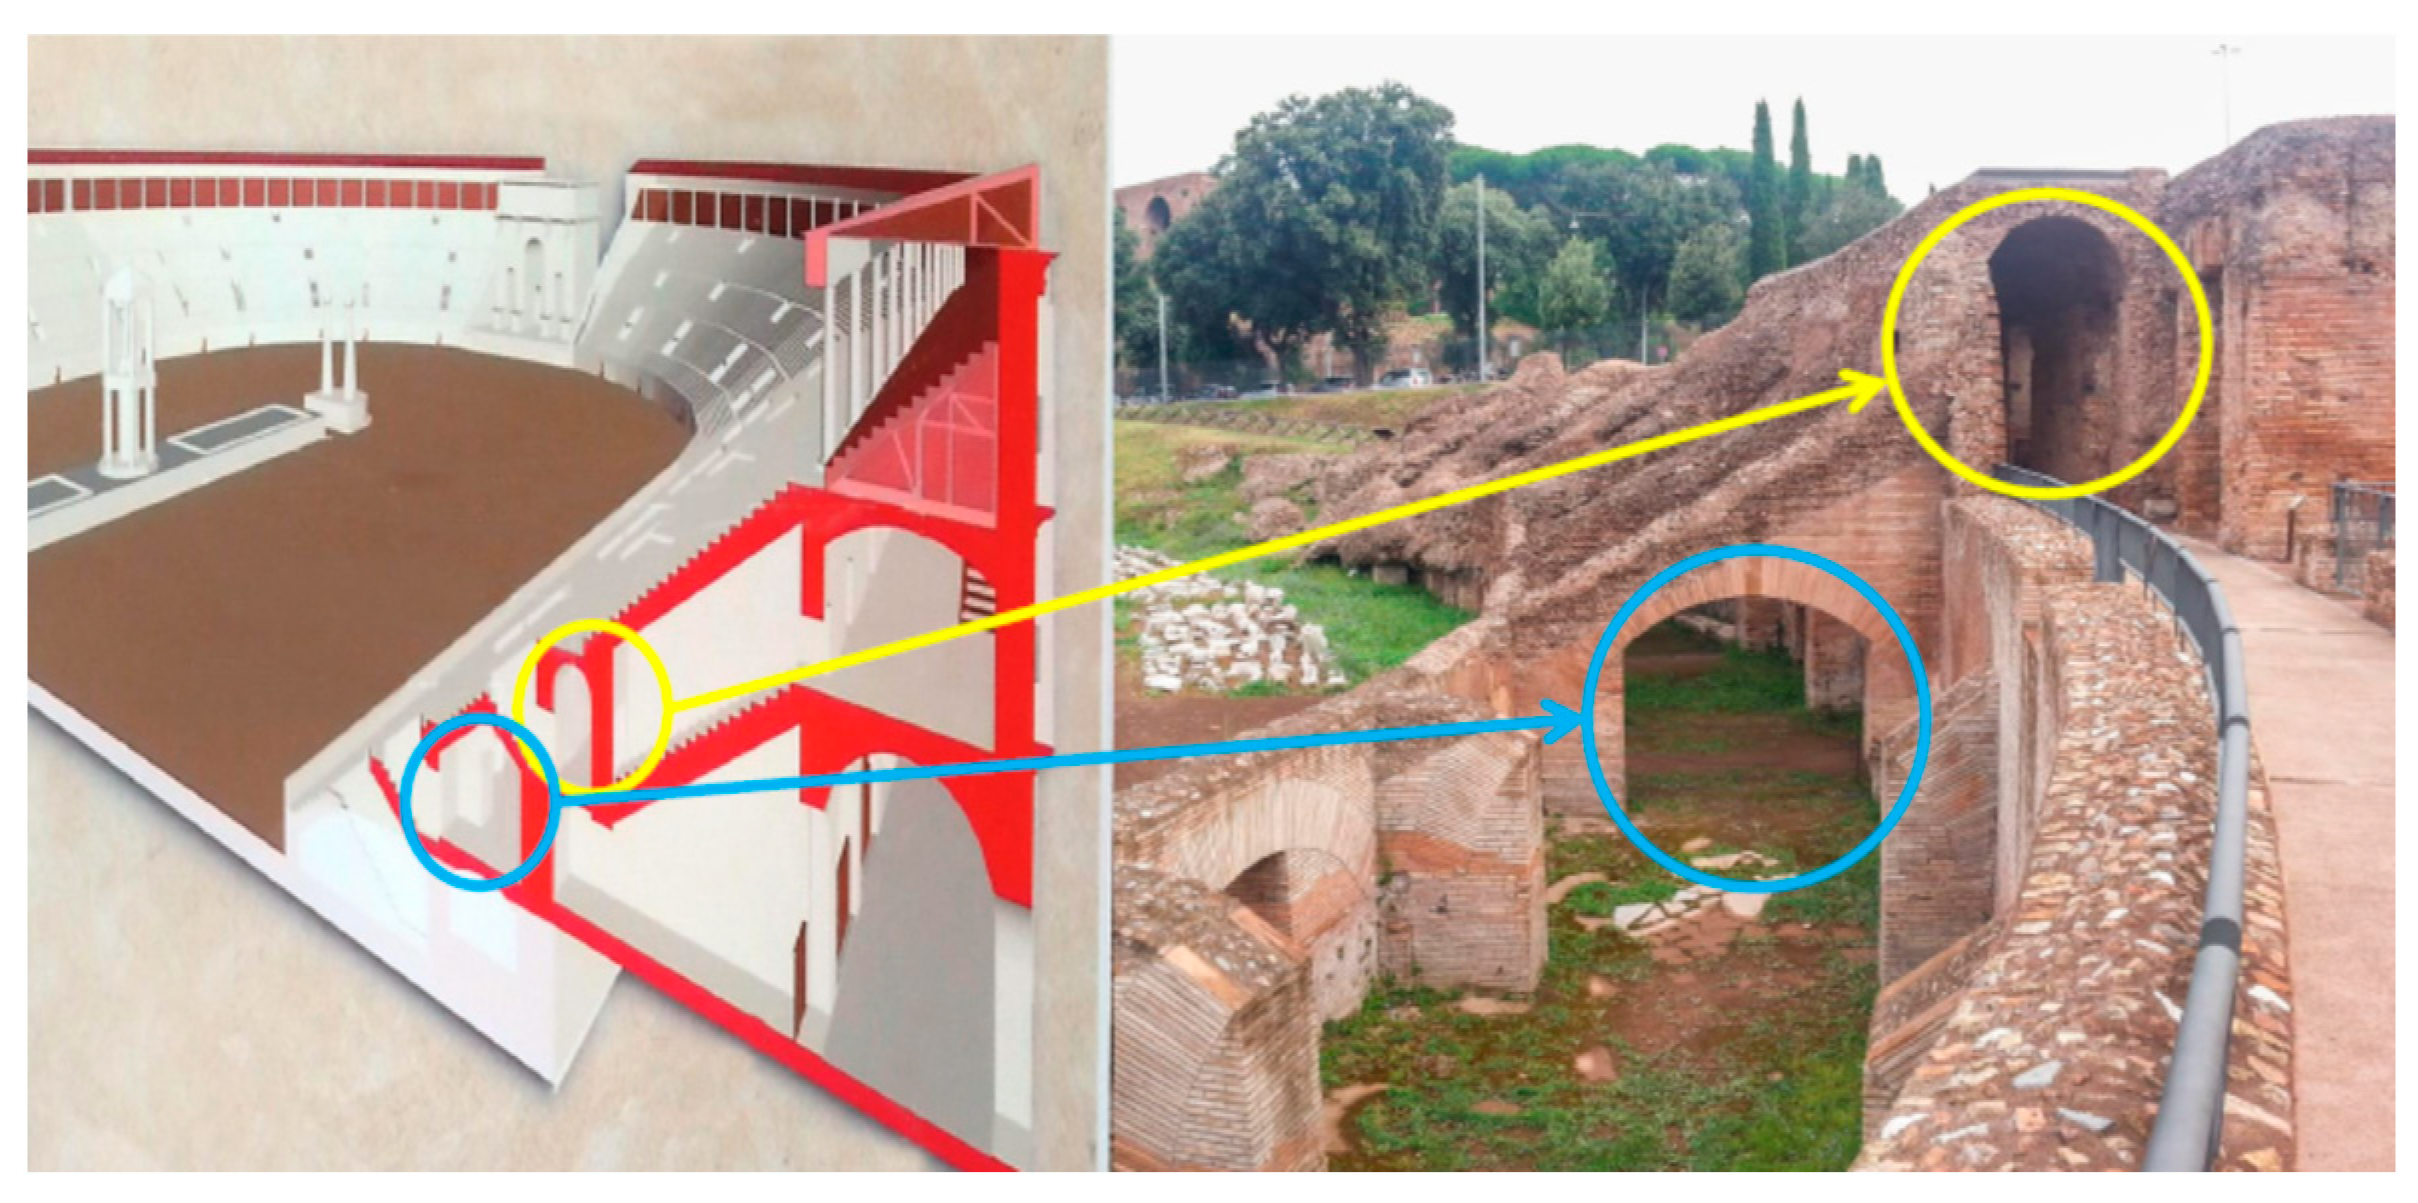
The Circus had a length of 621 m, a width of 118 m, and could accommodate about 150,000 spectators. The external facade had three orders, but only the lower one, i.e., the double height, was arched (
Figure 3). The “cavea” rested on masonry structures, which housed the passages and stairs to reach the different sectors of the seats, internal service areas, and shops open to the outside.
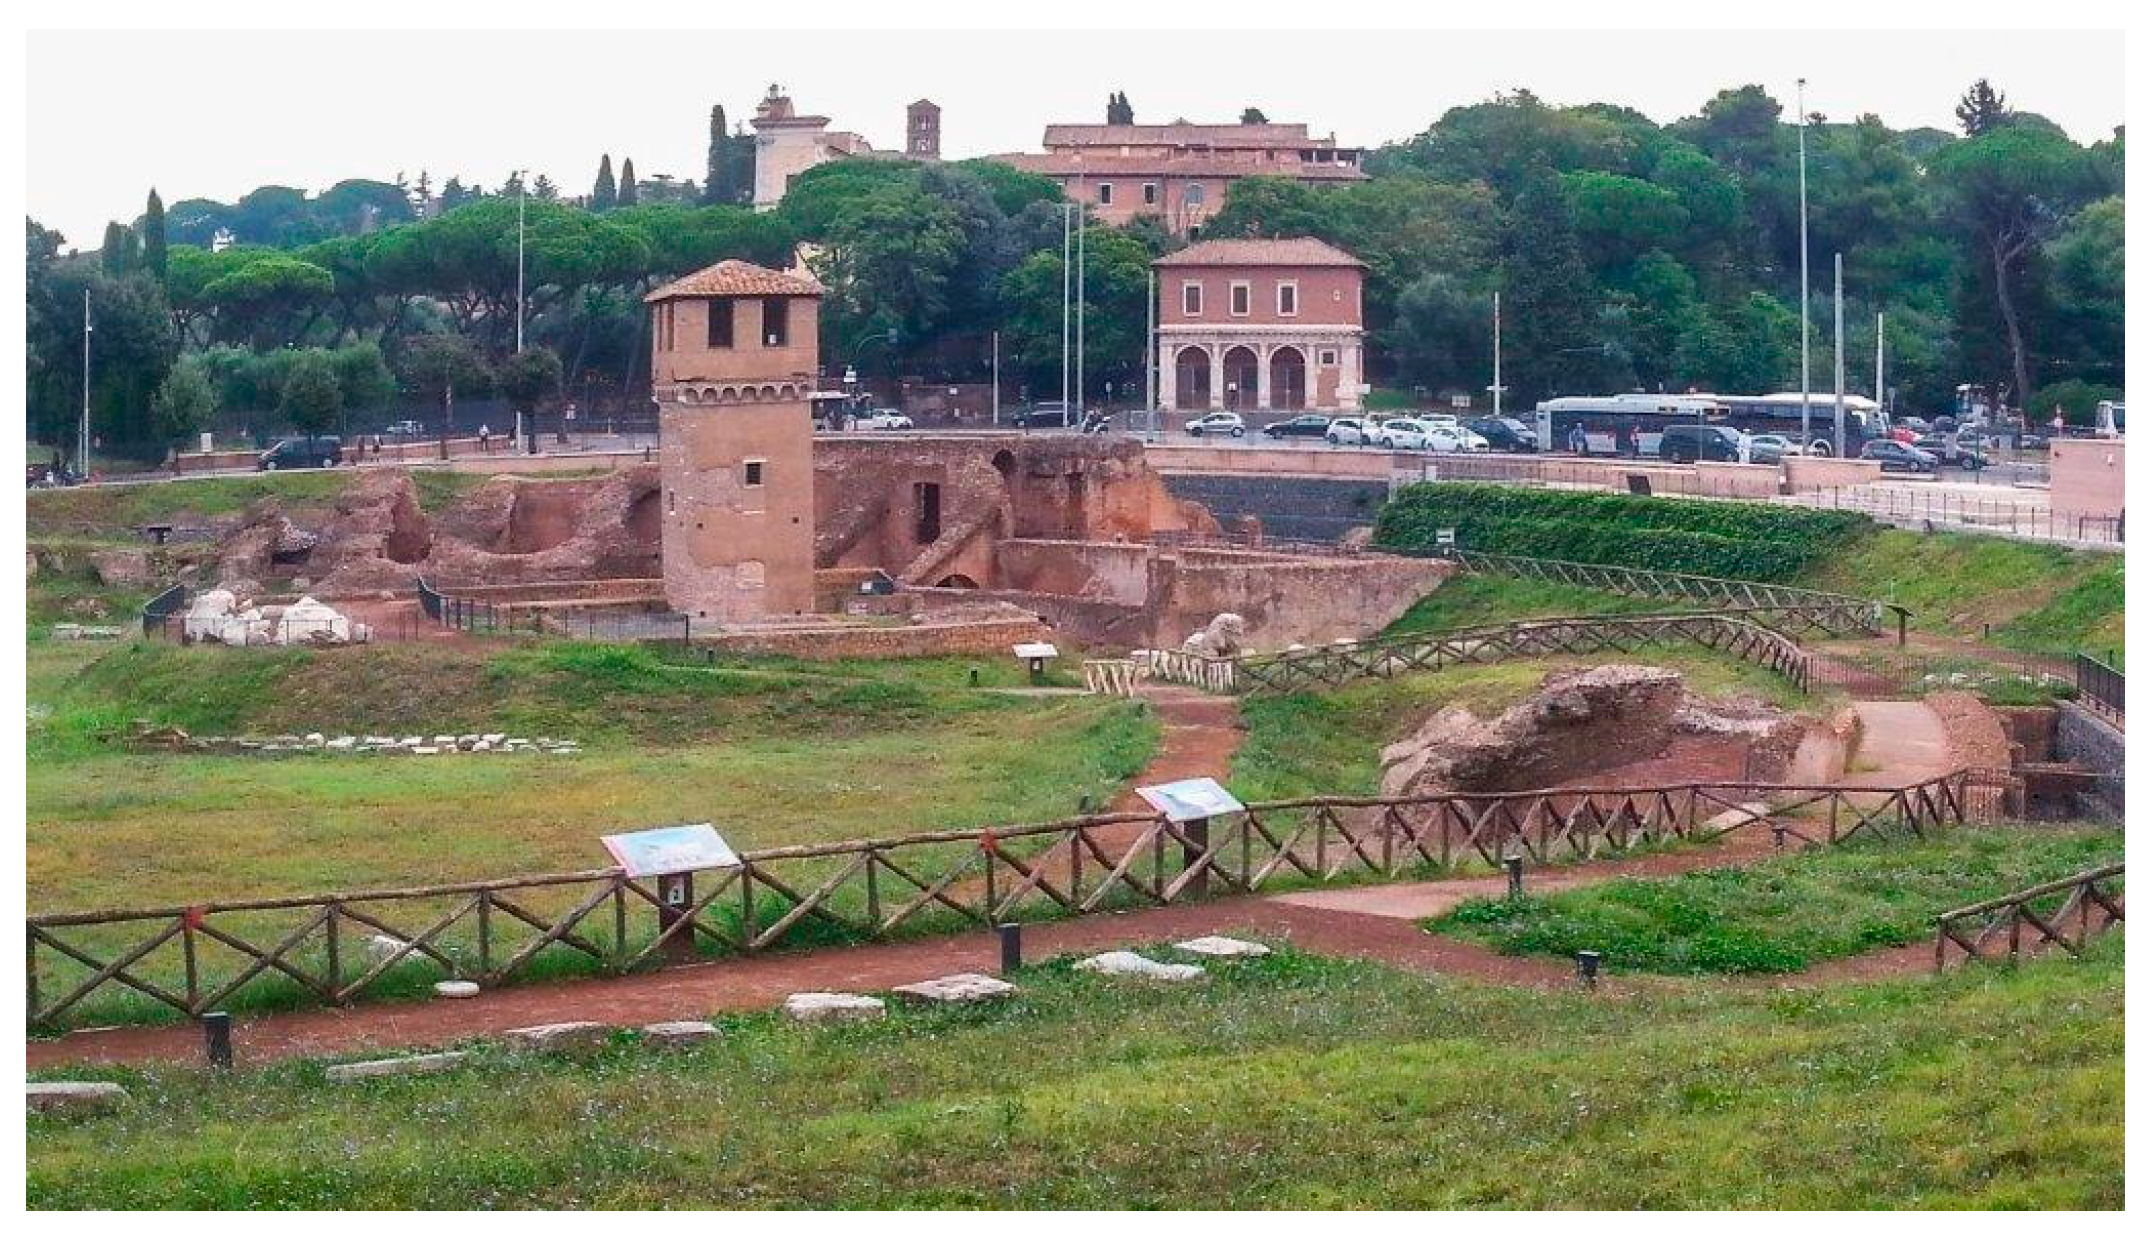
On the south-east side of the Circus, there is the medieval “Torre della Moletta”, which is the only structure built by the Frangipane family that survived. In fact, they built a large number of humble and dilapidated dwellings, which were demolished between 1932 and 1935. Francis of Assisi is said to have stayed in the tower in 1223, as guest of the widow of Graziano Frangipane. The tower is square and is slightly wider at the top end. Blind arches are beneath the broad part, while battlements are at the top.
3. Experimental Analysis
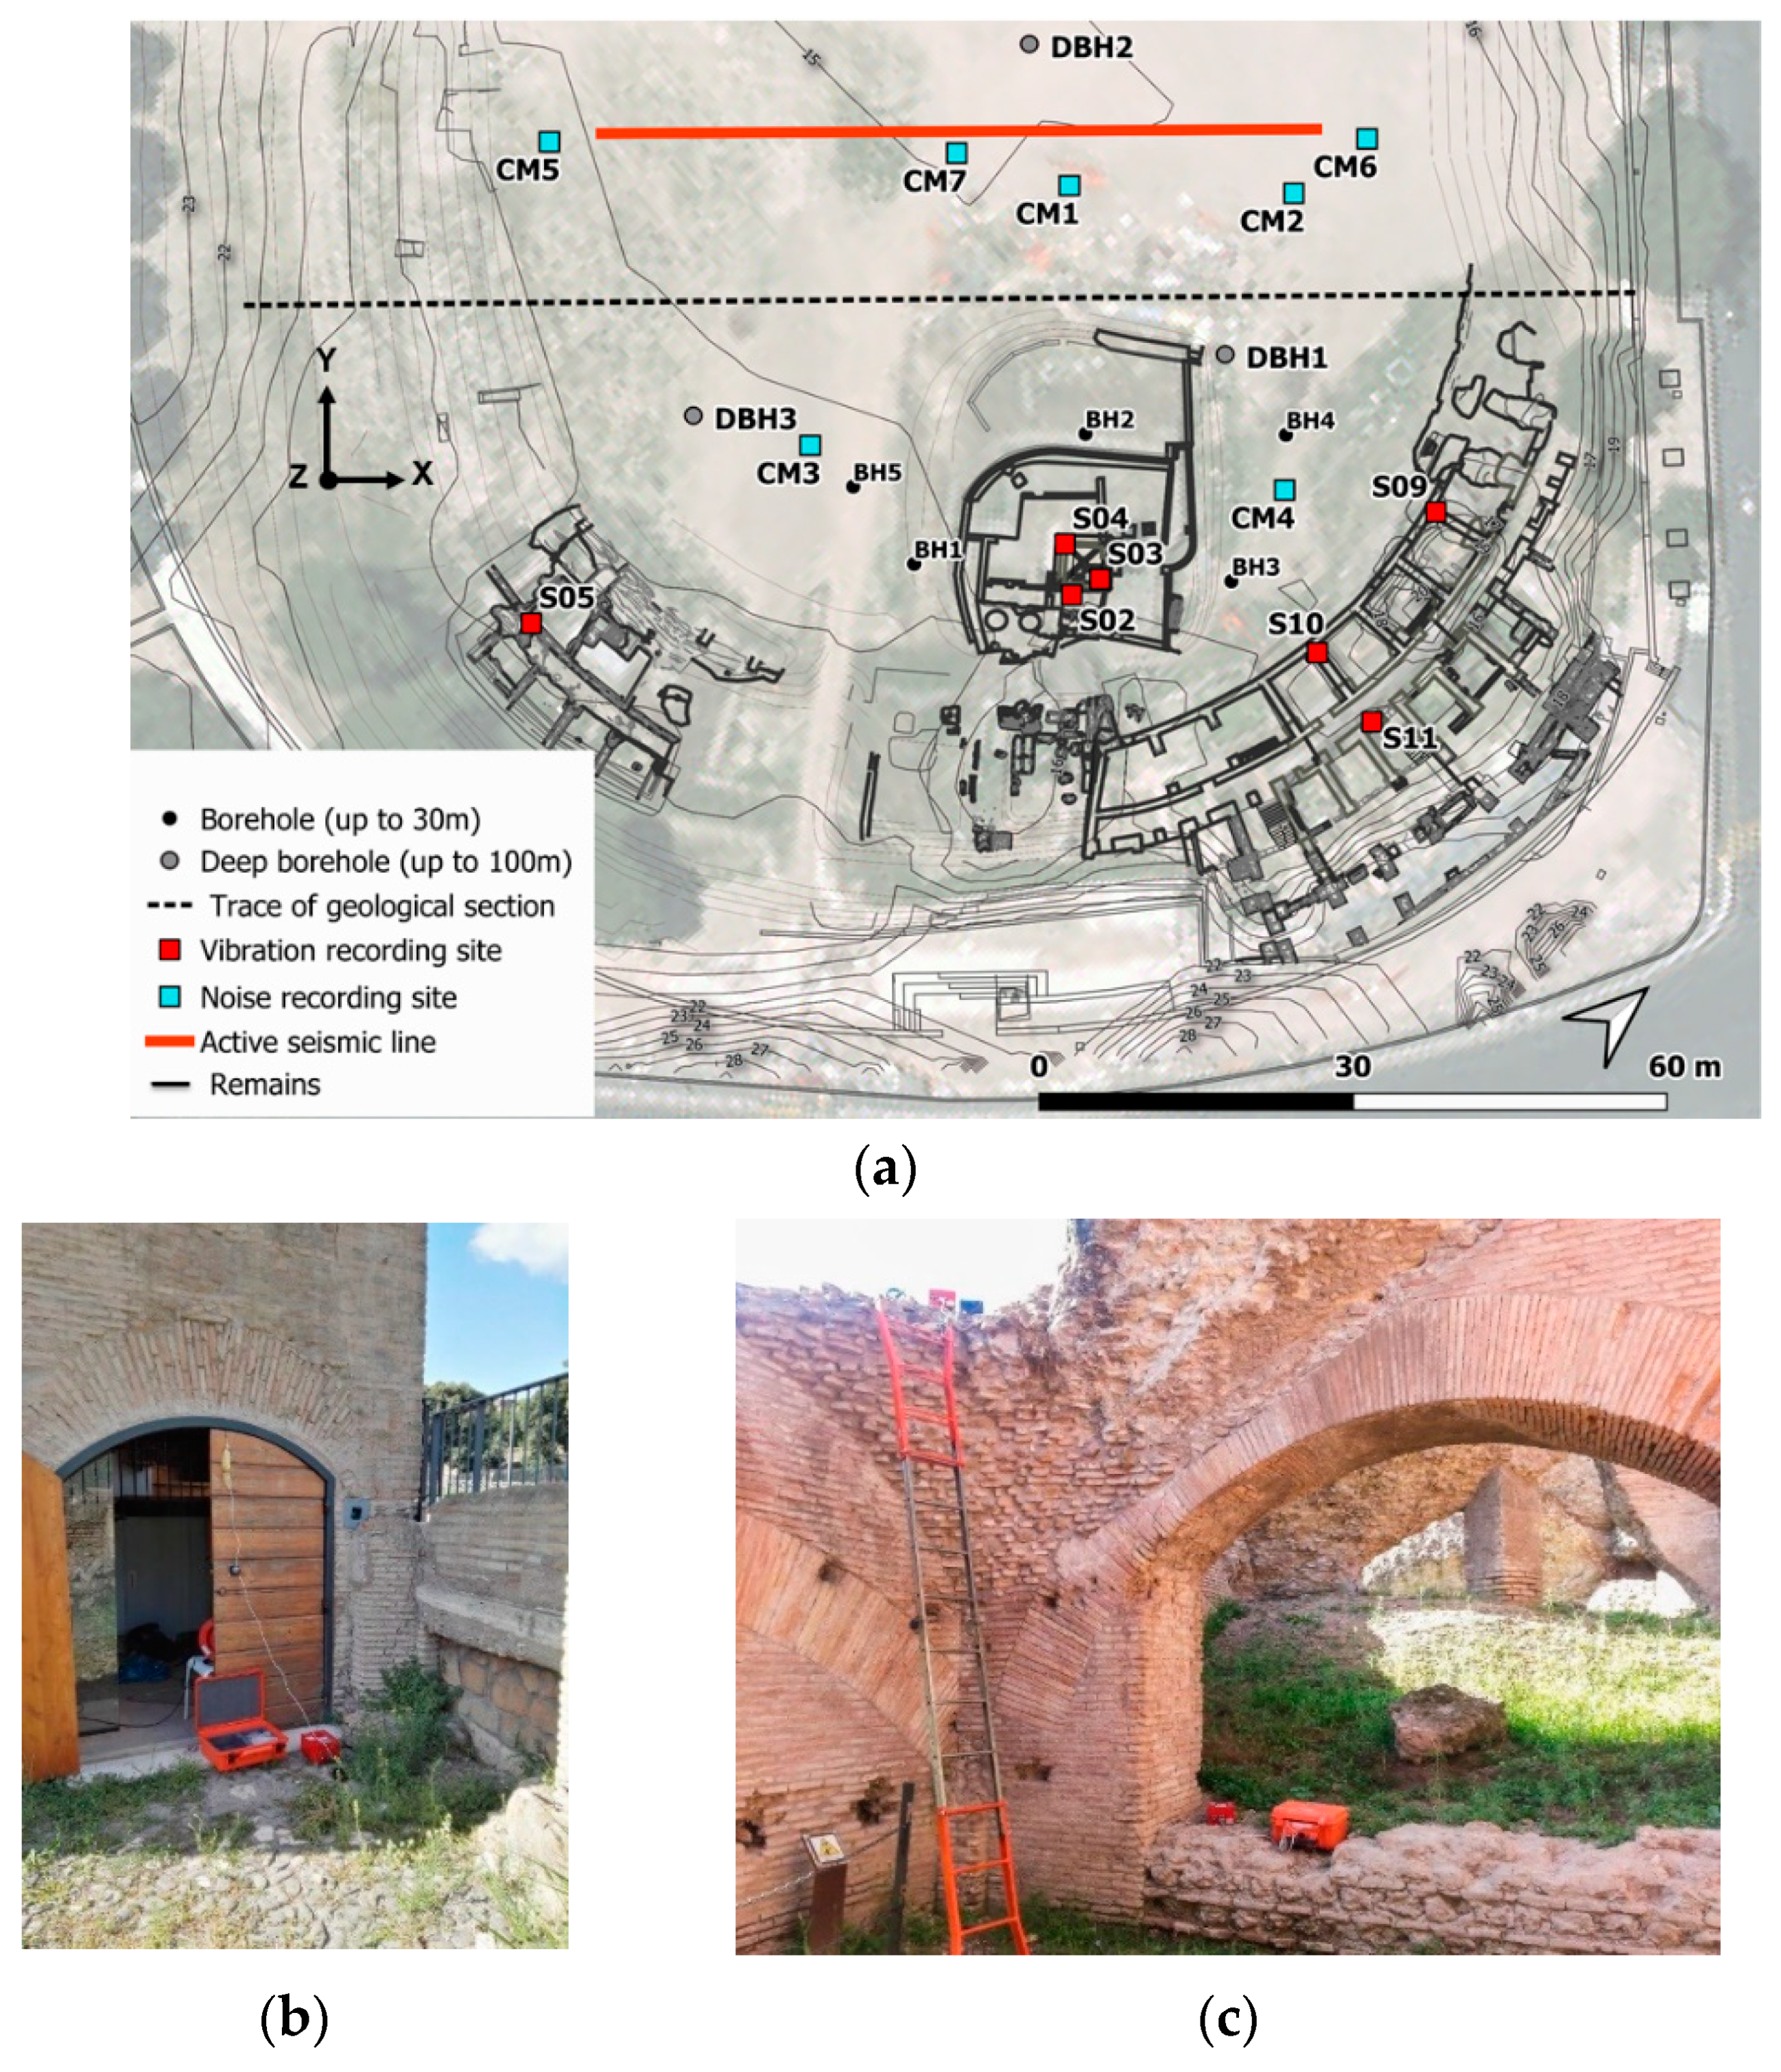
Eleven three-axial seismometers SARA SL06 were used. They were deployed as follows (
Figure 4):
One SL06 at the west side of the area (S05);
Three SL06 at the east side of the area (S09, S10, and S11);
Three SL06 on the Torre della Moletta (one on the ground very close to the entrance (S02), the other two at two opposite corners at the top floor (S03 and S04)).
Figure 4.
(a) Sensor deployment, (b) Sensors S02 and (c) S10 (top left) and S11 (bottom).
Figure 4.
(a) Sensor deployment, (b) Sensors S02 and (c) S10 (top left) and S11 (bottom).
For each location, the y direction was parallel to the major axis of the Circus, the x direction was orthogonal to it, and the z direction was the vertical one.
Furthermore, three other SL06 (S01, S07, and S08) were deployed in two different alignments on the ground, far from the previous structures.
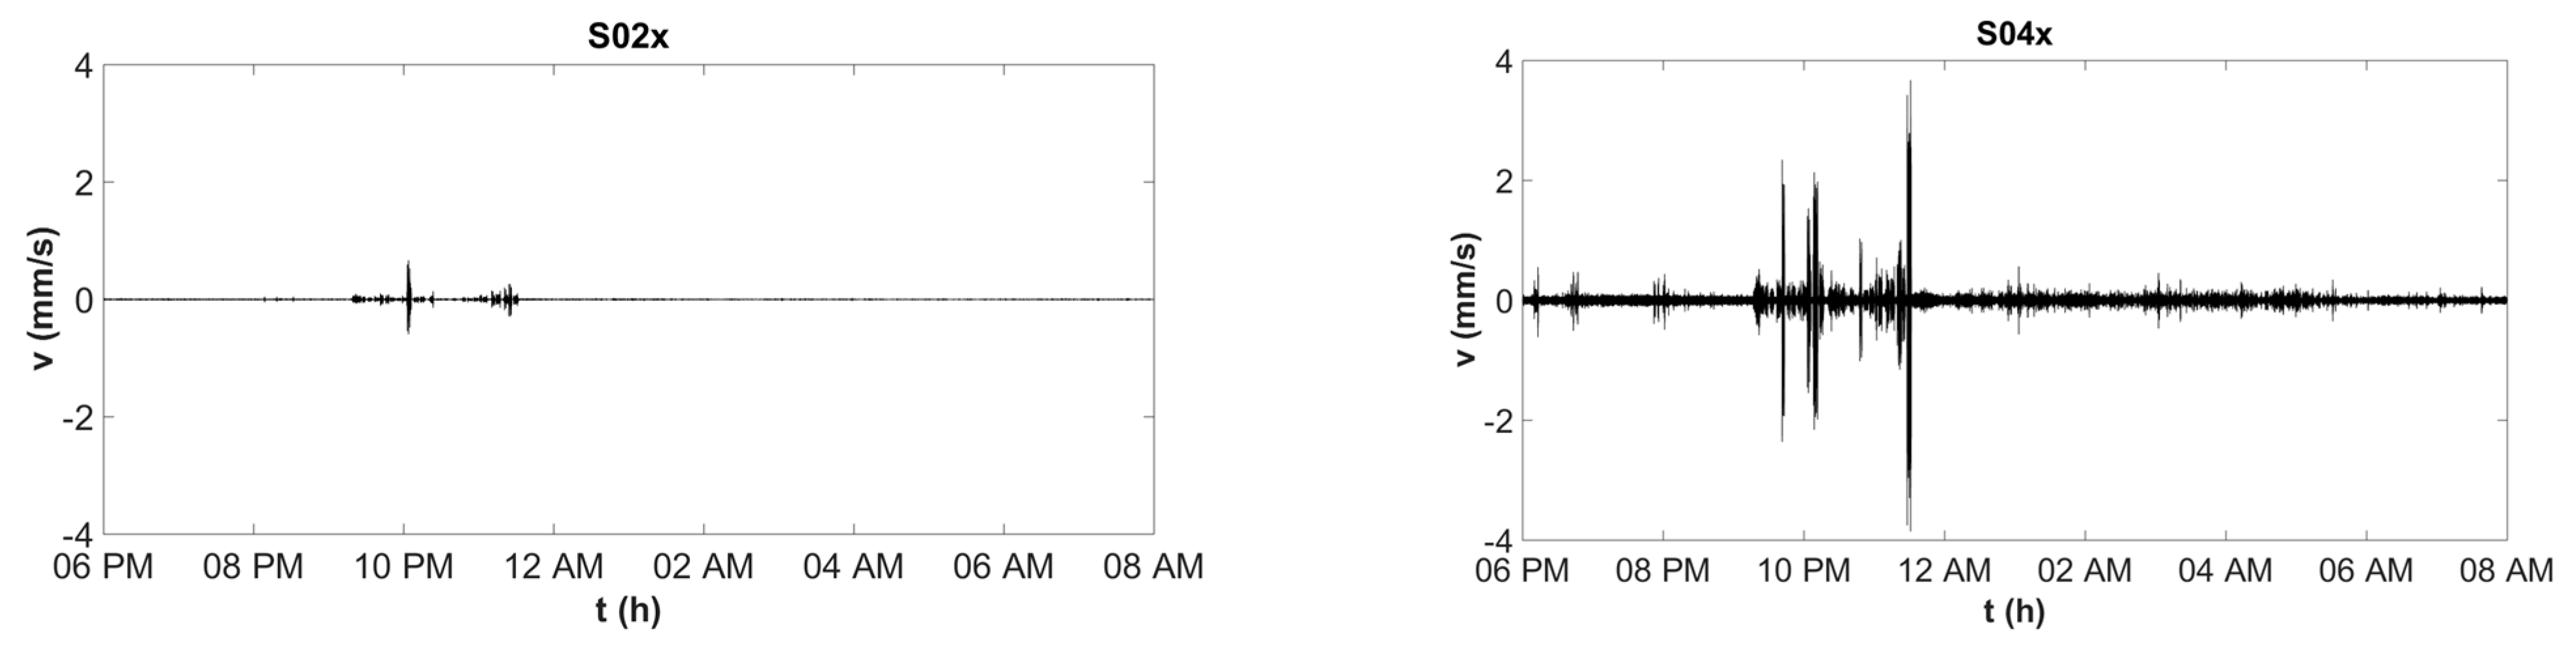
Measurements were taken between 6 PM of 7 September and 8 AM of 8 September 2019. In
Figure 5, two significant time histories of the entire registration are plotted, where the time interval in which the vibrations due to the concert are apparent (between 9 PM and midnight, approximately). These were analyzed in detail for all the sensors.
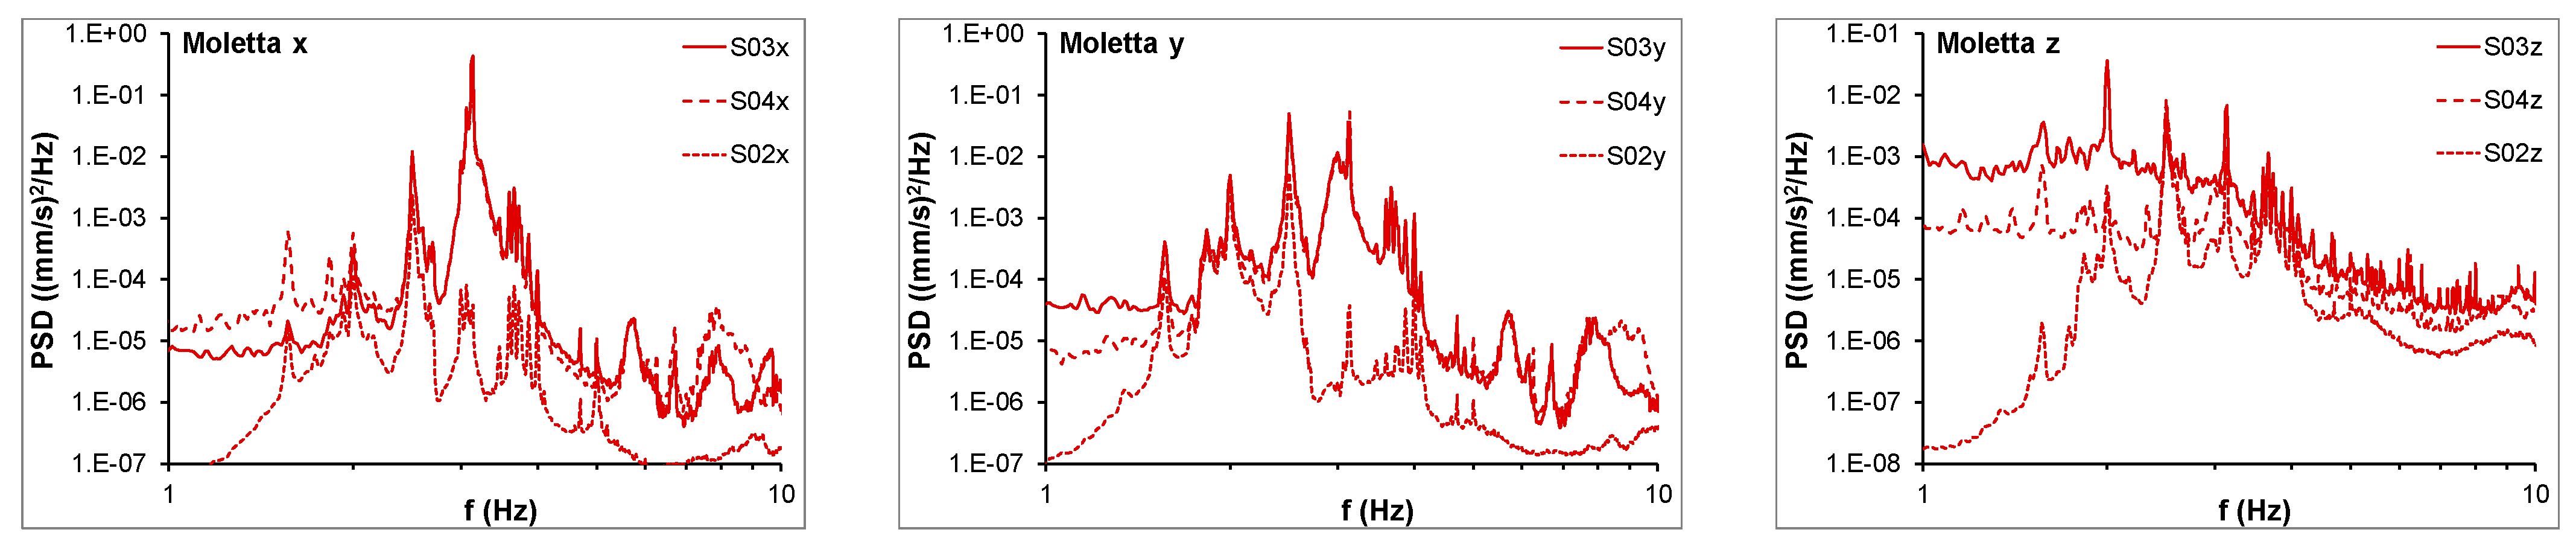
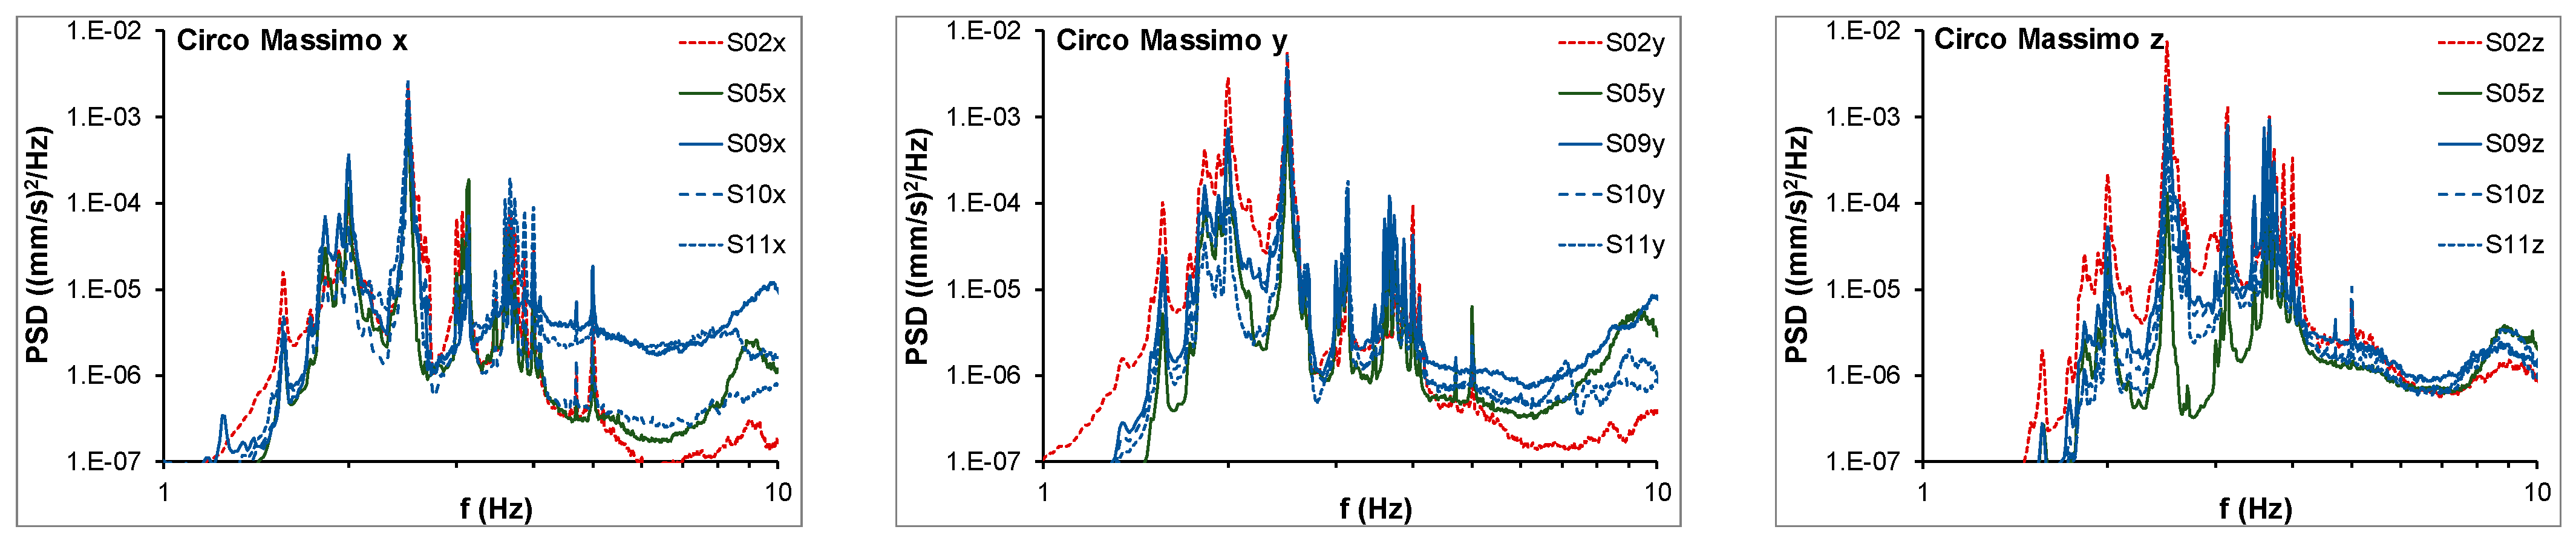
Figure 6 and
Figure 7 show the power spectral density (PSD) graphs of all the recordings for the entire time length for the three directions obtained on the Torre della Moletta and on the soil, respectively. Several peaks can be observed between 2 and 4 Hz. These peaks are apparent, especially in the recordings of the Torre della Moletta. The often good correlation between the measurements at the various locations is related to the presence of buried structures.
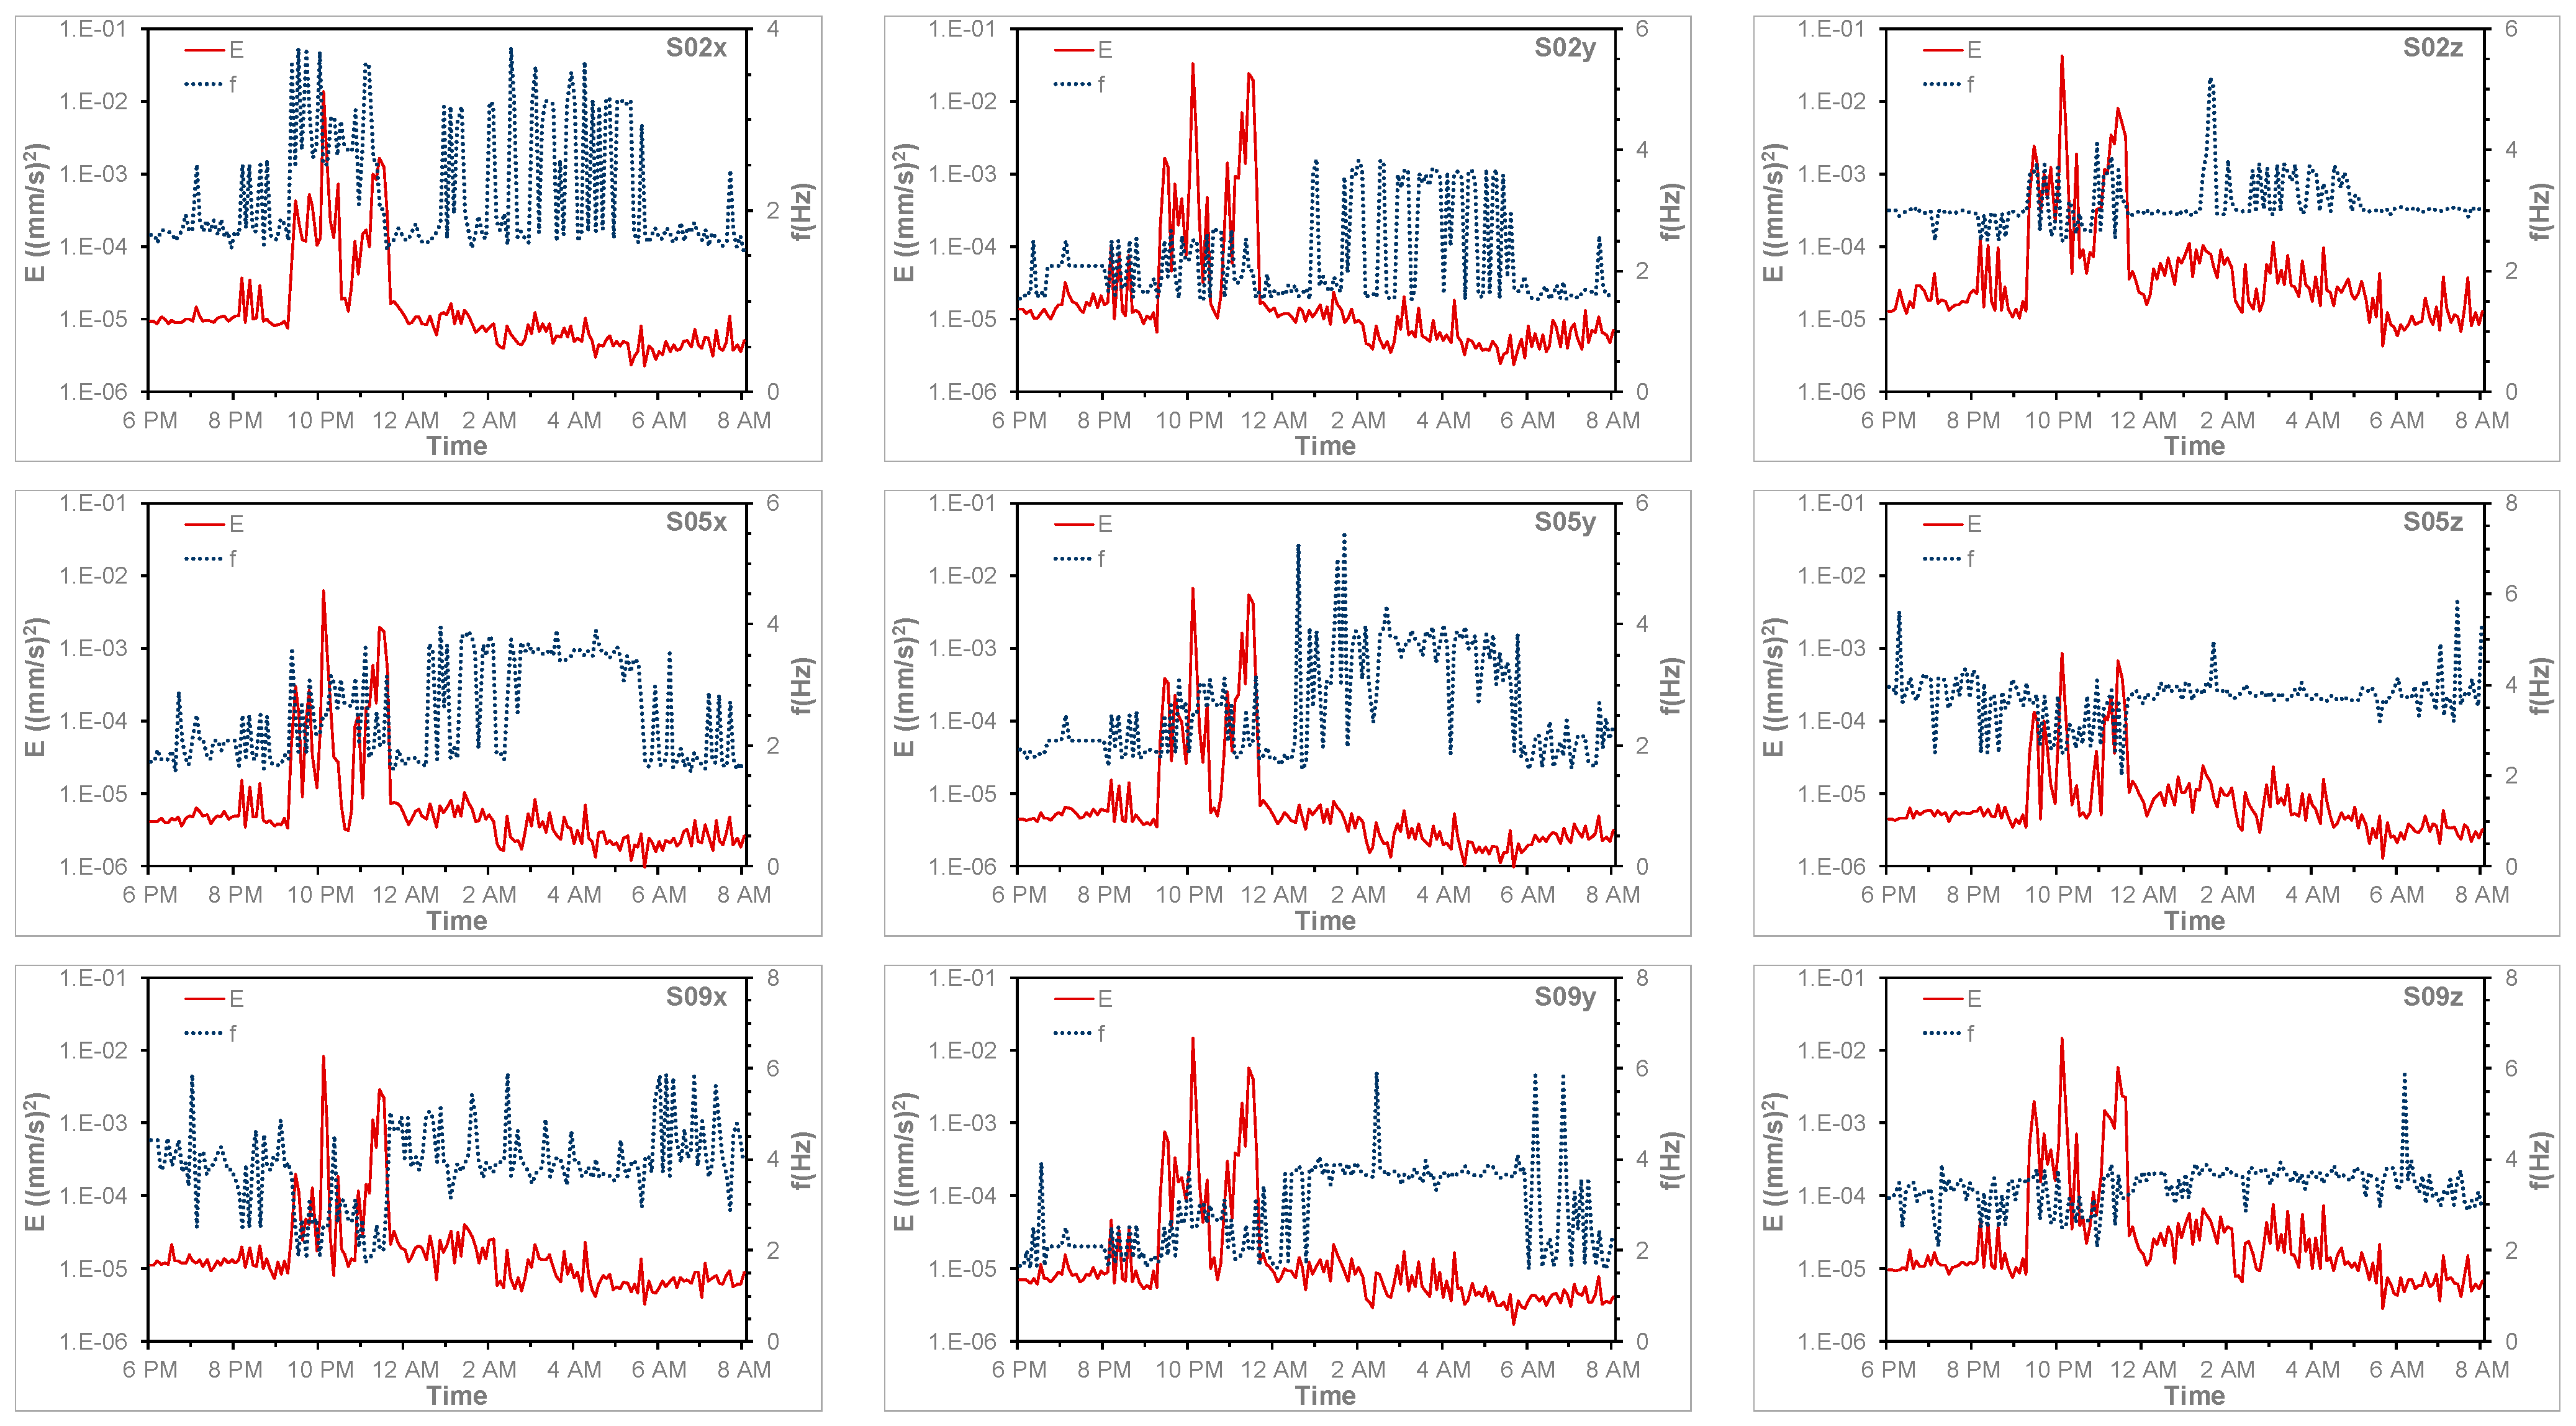
In
Figure 8, the energy and the first resonance frequency at S02, S05, and S09 are plotted. Energy was estimated for each consecutive 5-min time interval as the area below the PSD for that interval; the dominant frequency for each interval was then estimated as the frequency of the peak PSD. The variation of both of them was significant during the recordings. The influence of the concert can be seen.
For the purpose of this paper, the entire recordings were divided into three time intervals:
A time interval with the presence of traffic-induced vibrations (T), which occurred in the evening before the concert, from 6 to 9 PM;
A time interval from 9 PM to midnight, approximately, which includes the entire concert (C);
A time interval from midnight to 8 AM, with the presence of low ambient noise only (N), which occurred after the concert.
In the following, the results of the frequency and time domain analyses are reported for the recording obtained on the Torre della Moletta and on the archaeological ruins. Then, the recordings on the soil are analyzed.
4. Frequency Domain Analysis
4.1. The Torre della Moletta
In
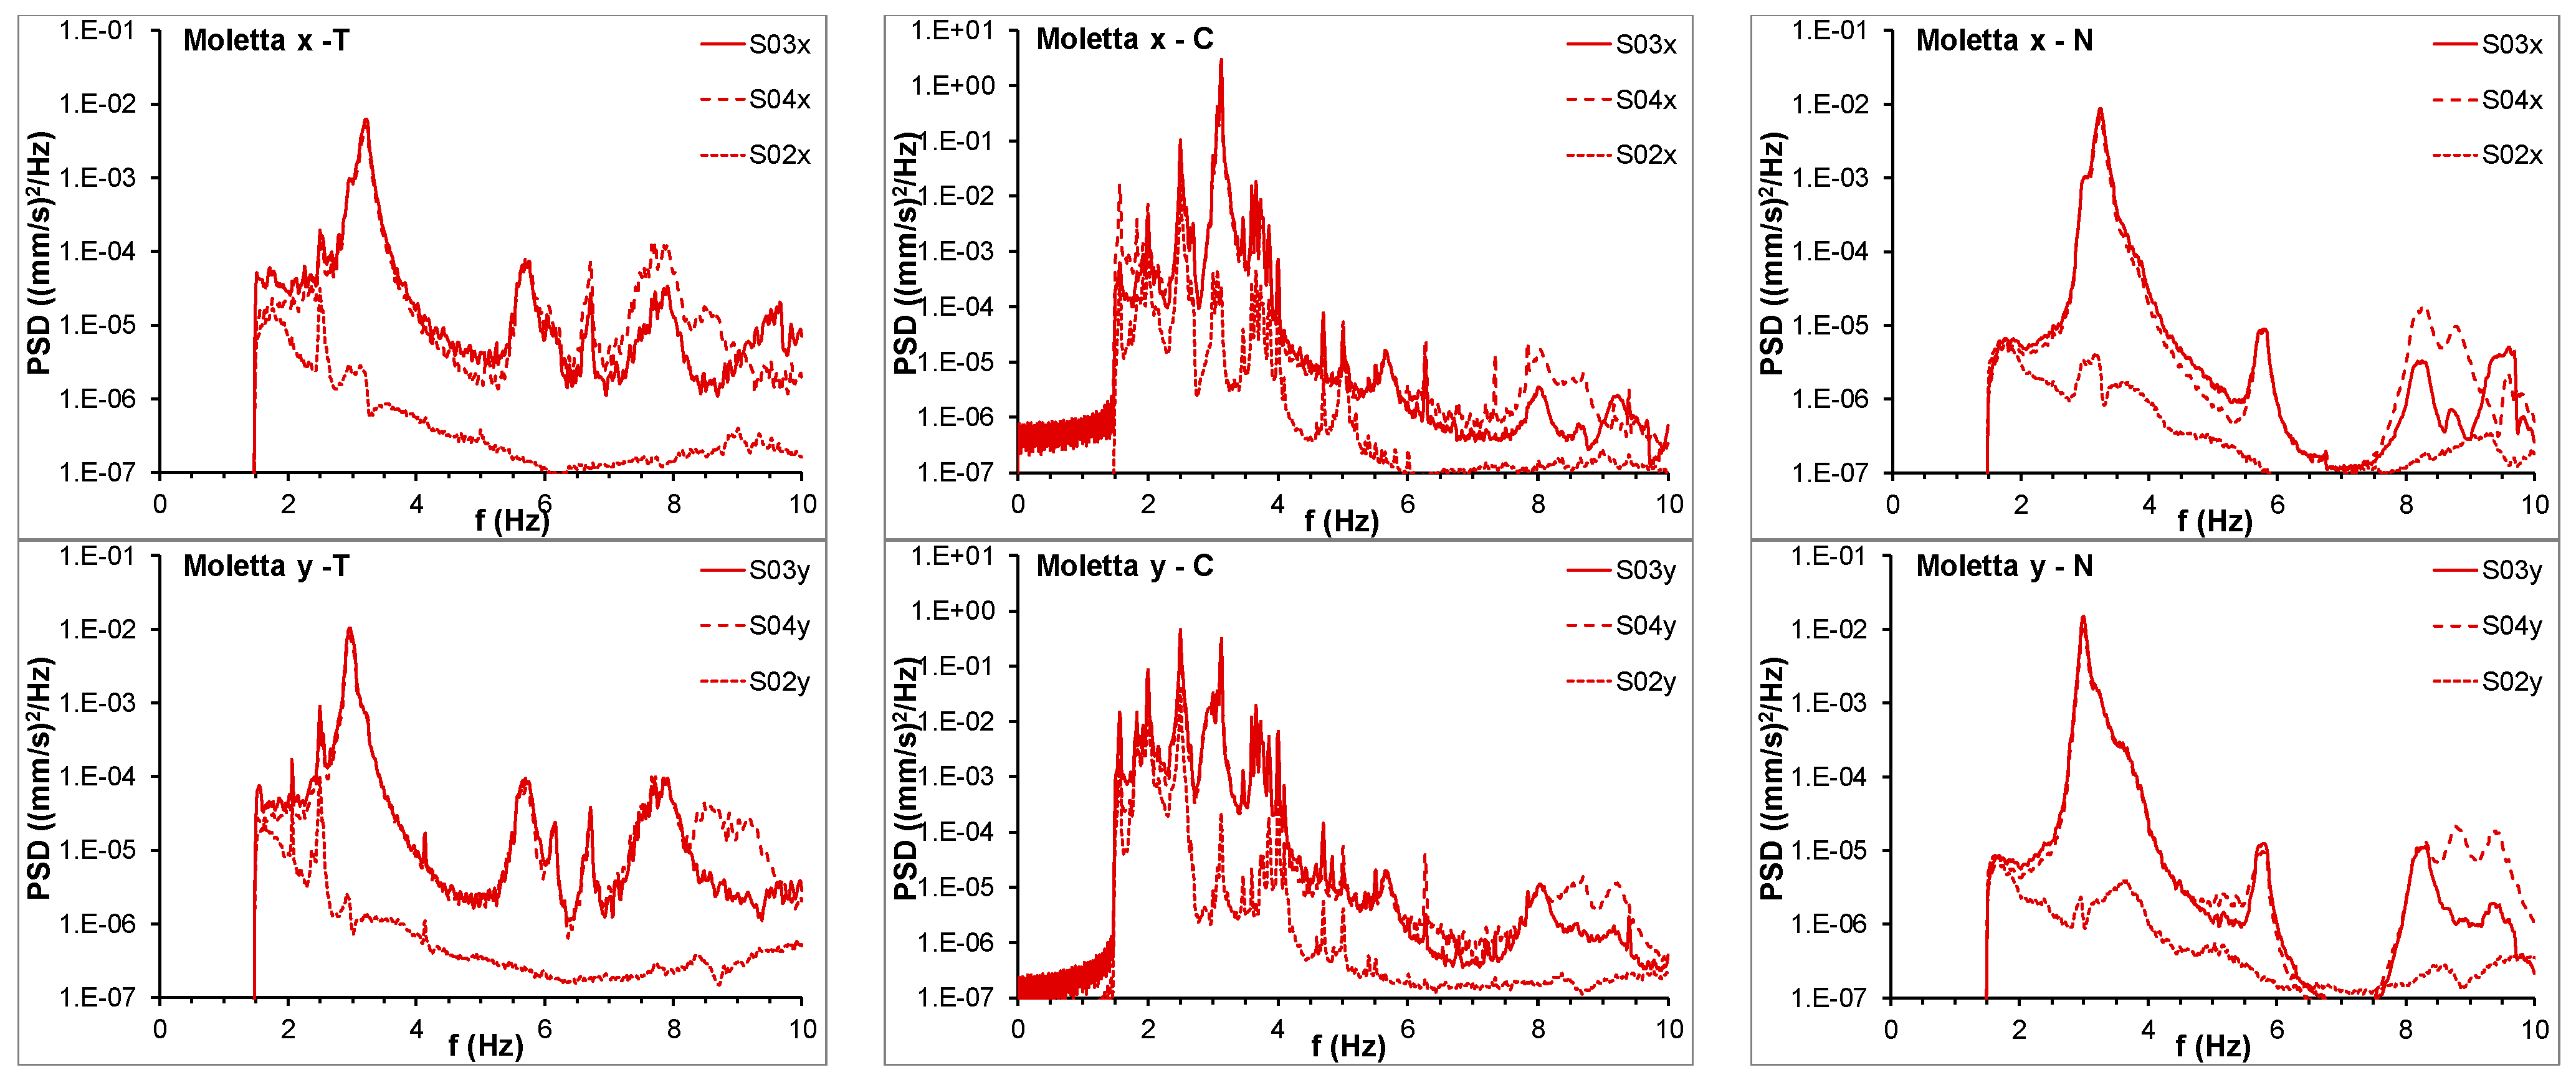
Figure 9, the PSDs in the three directions at S02, S03, and S04 are plotted for the three time intervals T, C, and N, separately. In the presence of ambient noise only (N), two resonance frequencies at 3.0 and 3.25 Hz are apparent in the y and the x direction, respectively. Another peak is observed at about 5.8 Hz in both directions. The same resonance frequencies, with higher amplitudes, are the most evident before the concert (T), when the other main peaks can also be seen, at higher frequencies. During the concert (C), several resonance frequencies between 1.5 and 4.0 Hz are apparent. The amplitudes in interval C are much higher than in the other intervals.
In
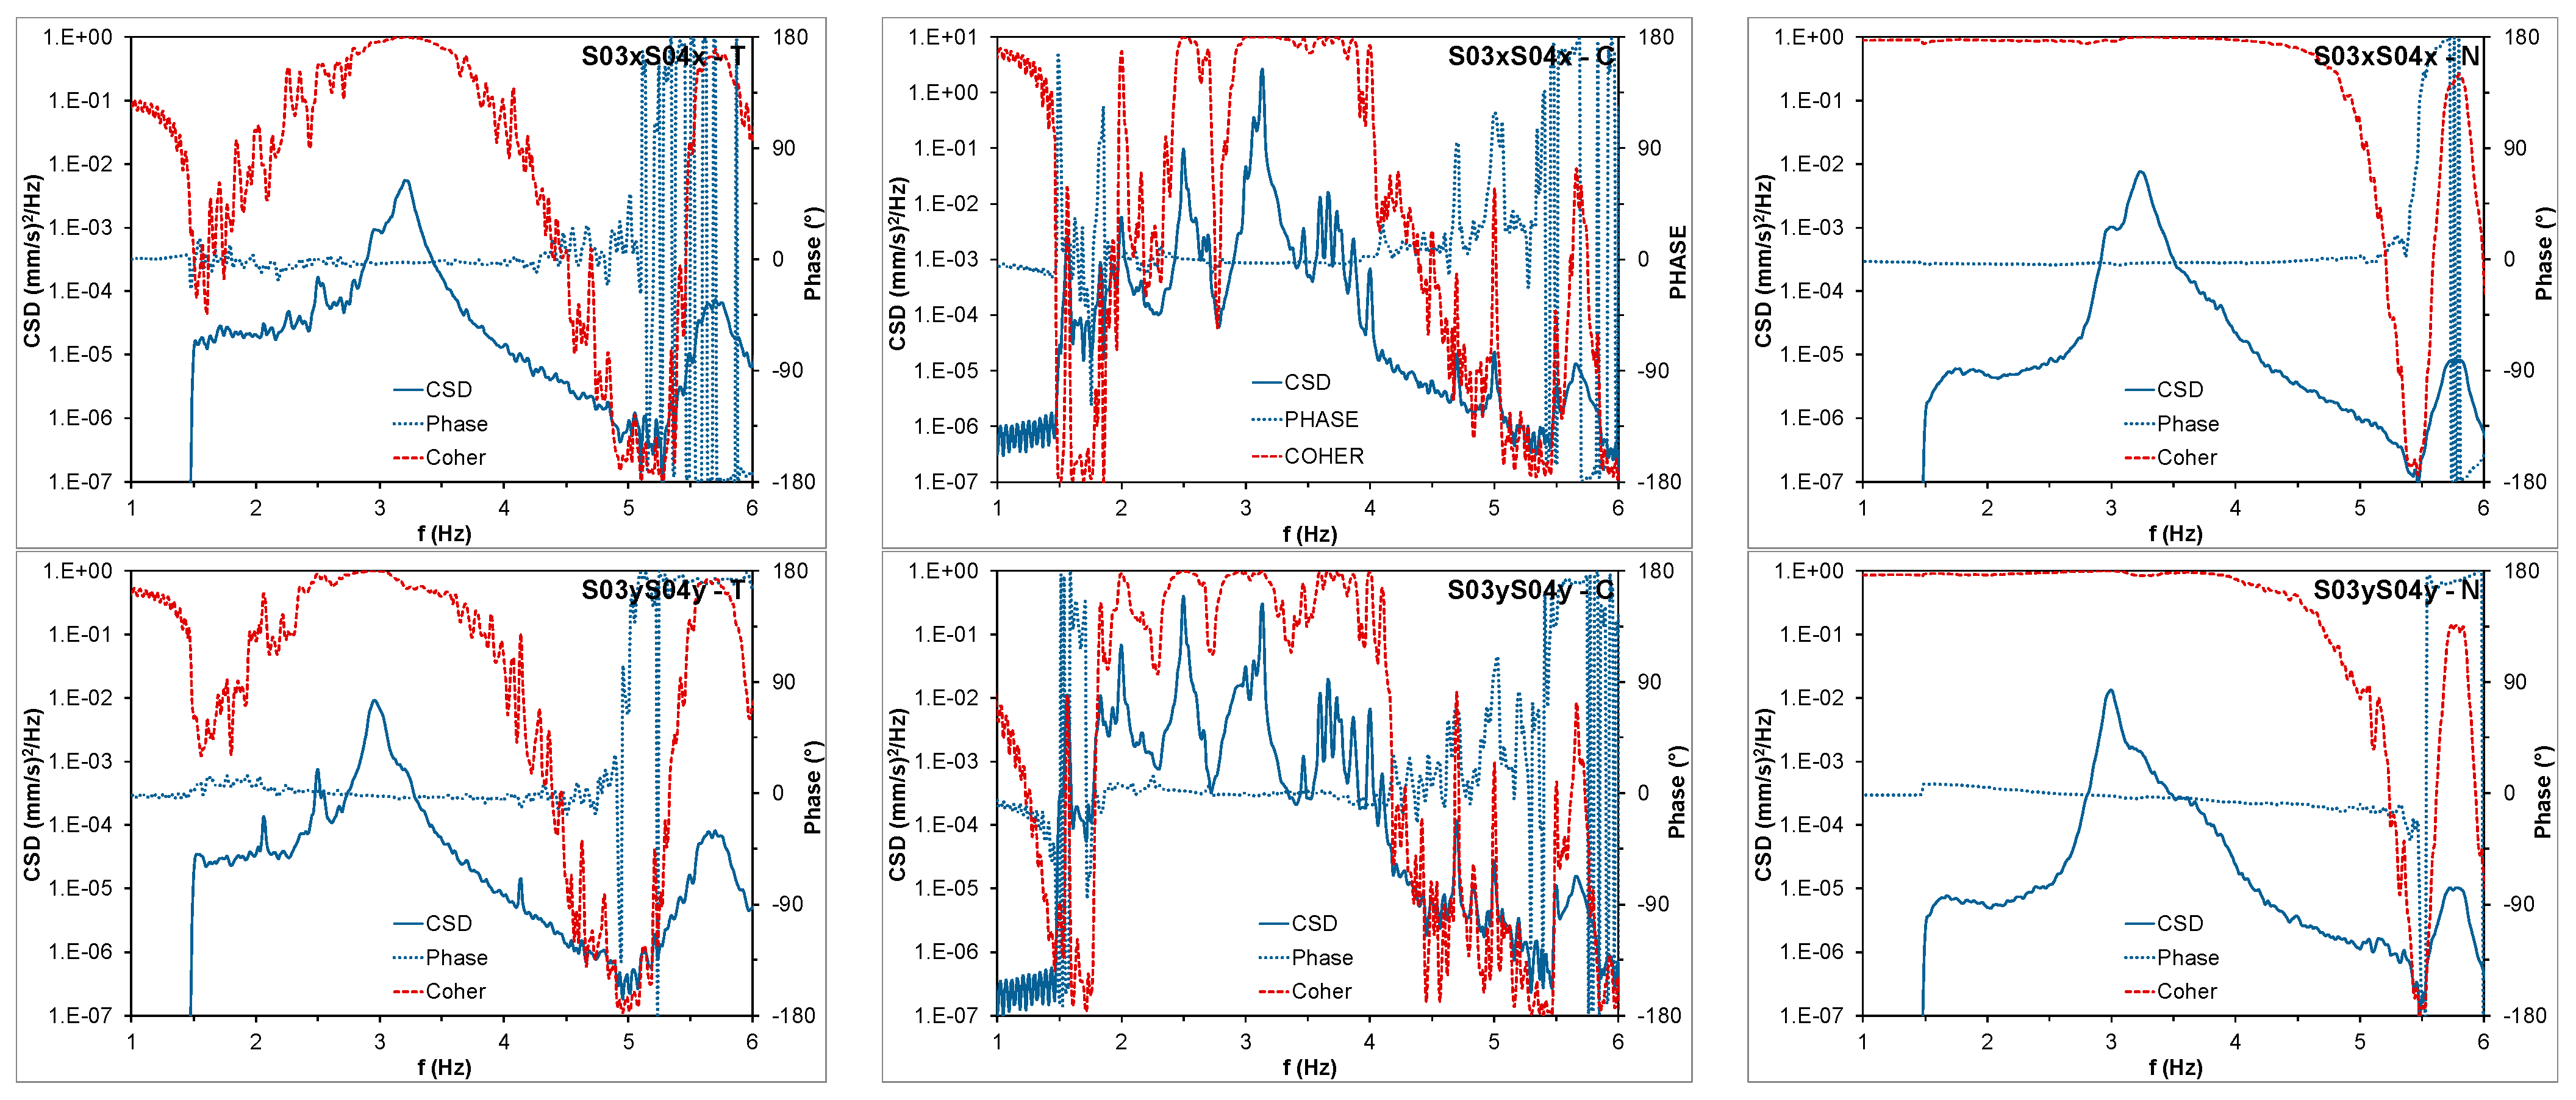
Figure 10, the cross spectral density (CSD) graphs of the parallel velocity components at S02 and S04 and at S03 and S04 are separately plotted for the three intervals (T, C, and N). The already-mentioned resonance frequencies are also pointed out. S03 and S04 are in phase at 3.0 and 3.25 Hz, while they are out of phase at 5.8 Hz. Therefore, the first two frequencies are associated with the first modal shape of the tower along the y and x direction, respectively, the third one to the second modal shapes, which have very similar frequencies.
It is important to clarify that the vibration effects on the tower are related to the presence and behavior of people, and not to the sound, which involves frequencies out of the range of interest of the structures.
4.2. The Circus
In
Figure 11, the PSDs in the three directions at S02, S05, S09, S10, and S11 are plotted for the three time intervals, using the same windowing rules and filtering the signals between 1.5 and 10 Hz.
After the concert, in the presence of ambient noise only (N), amplifications are present between 1.5 and 4.0 Hz in all the three directions. Before the concert (T), the same resonance frequencies are apparent with higher amplifications, especially at 2.5 Hz. During the concert (C), several resonance frequencies between 1.5 and 5.0 Hz are apparent. The amplitudes in interval C are much higher than in the other intervals.
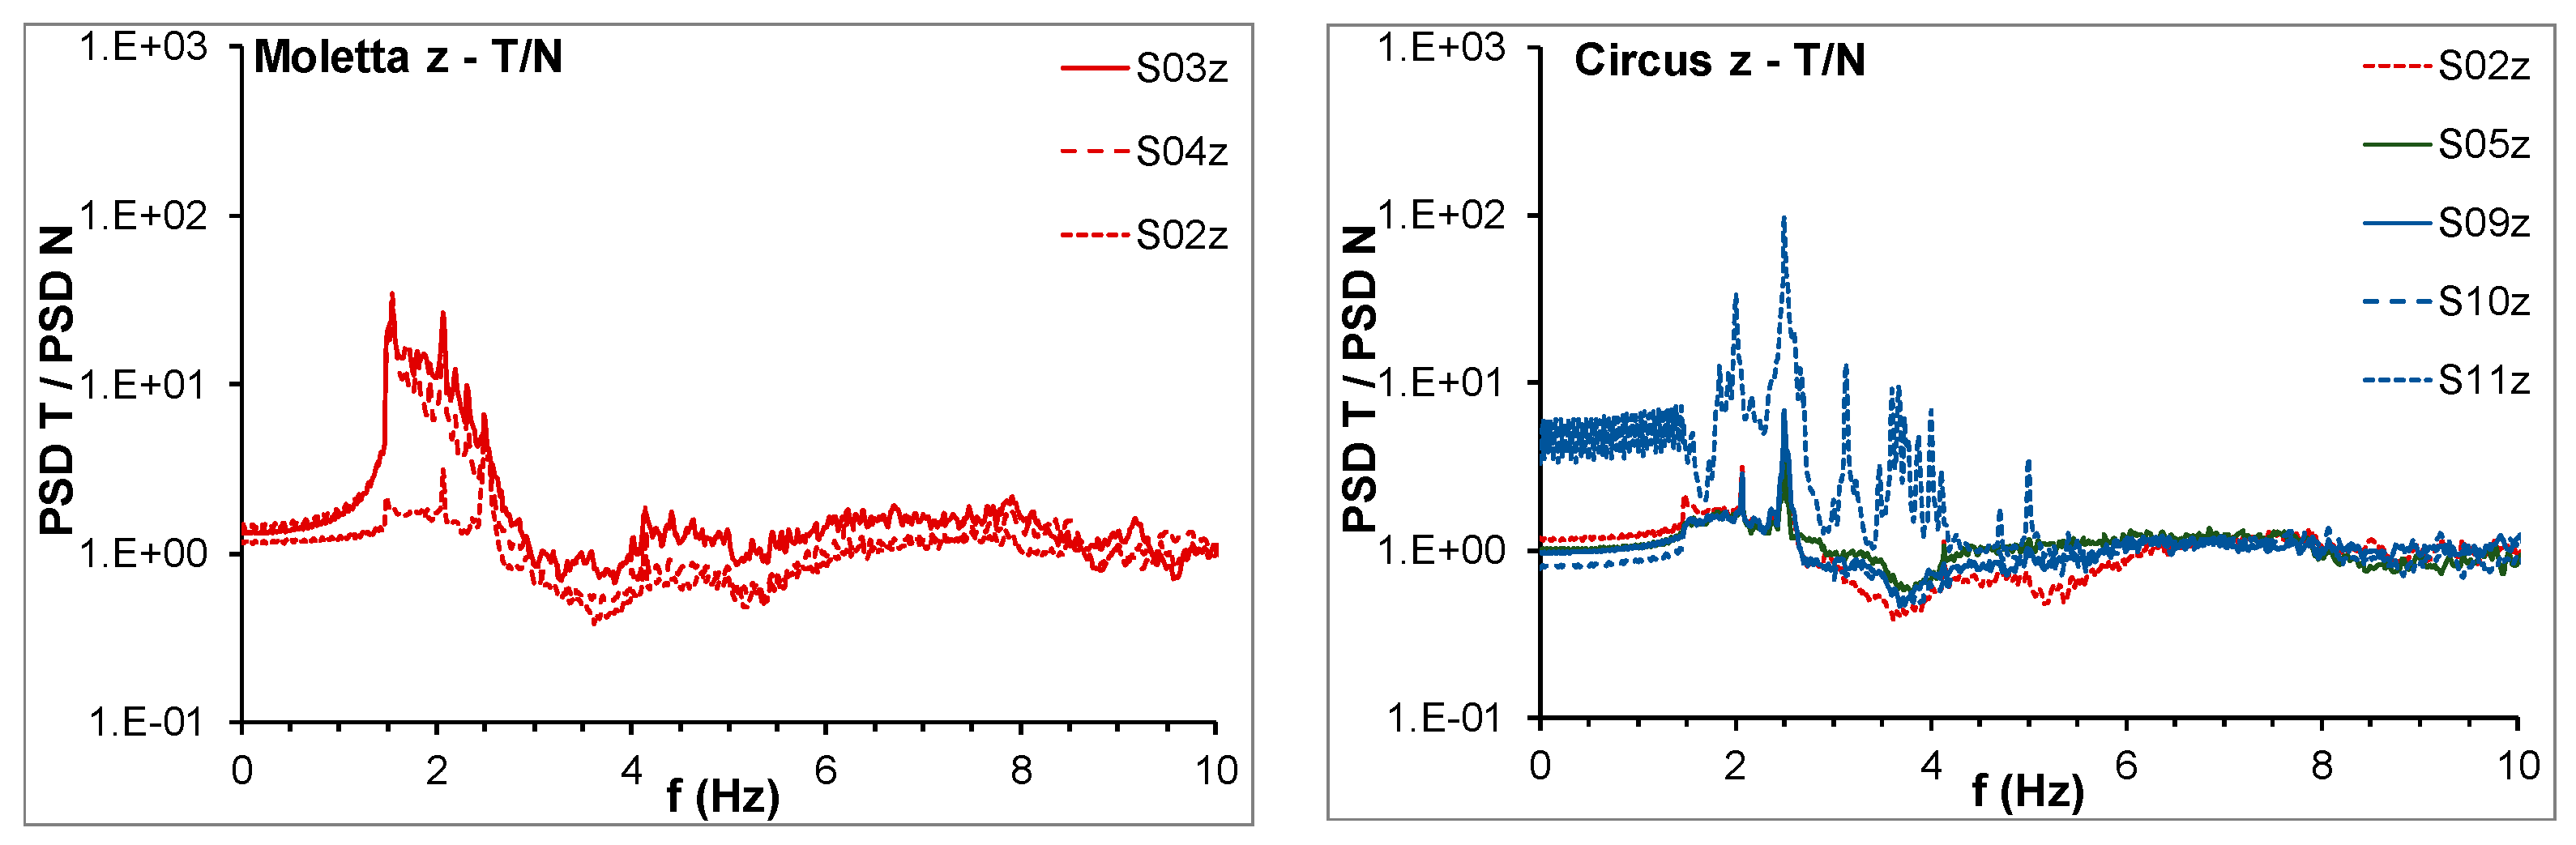
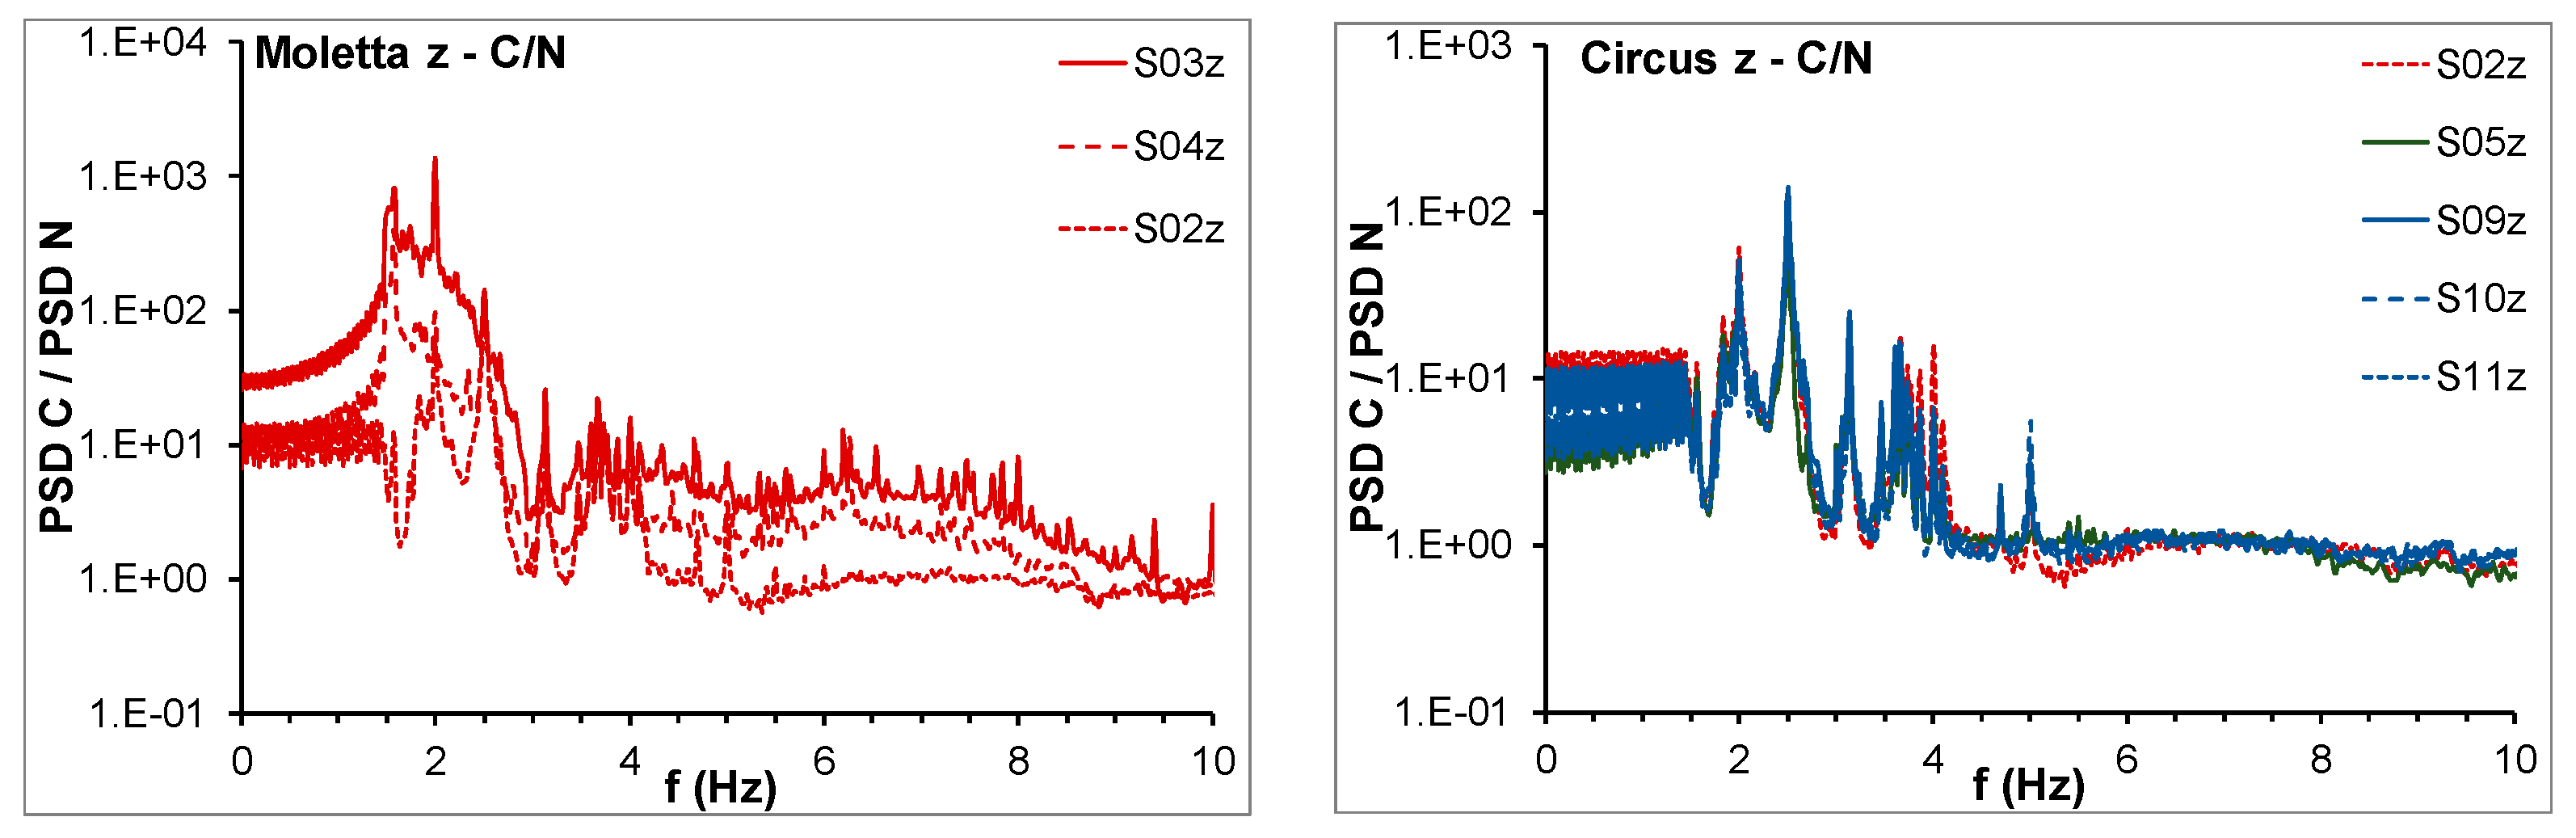
It is evident that 2.5 Hz is the dominant frequency for all the directions, at all measurement points, even in the presence of traffic only. The spectral amplitudes become considerable during the concert. The rations between the spectra during T and N (
Figure 12), and during C and N (
Figure 13) confirm this consideration.
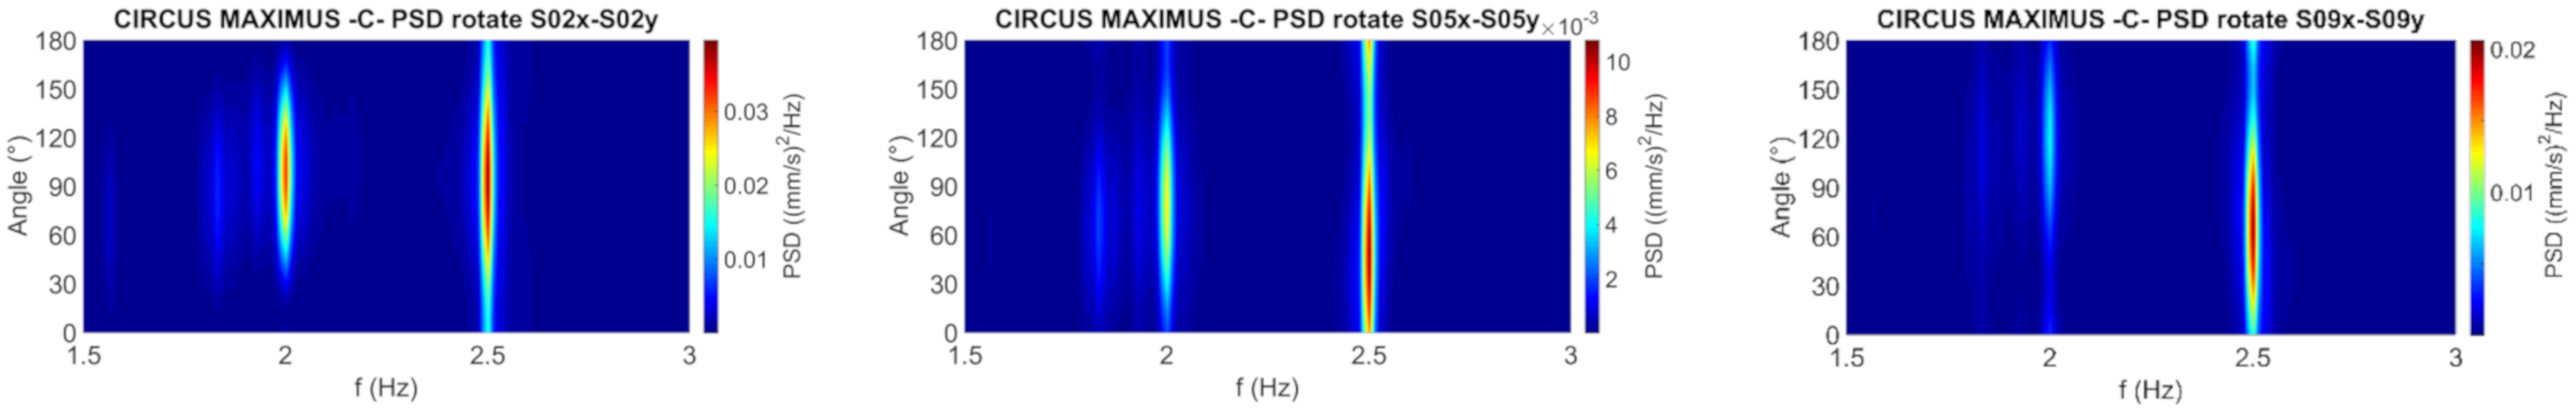
Furthermore, the vertical component at the foot of the tower (S02x) is greater than the horizontal components (S02x and S02y). This resonance frequency does not seem to be linked to the characteristics of the soil, but is probably due to the presence of buried structures. The rotate spectrum analysis (
Figure 14) helped to identify the angle of the maximum spectral amplitude, which remains unchanged during the three time intervals (T, C, and N).
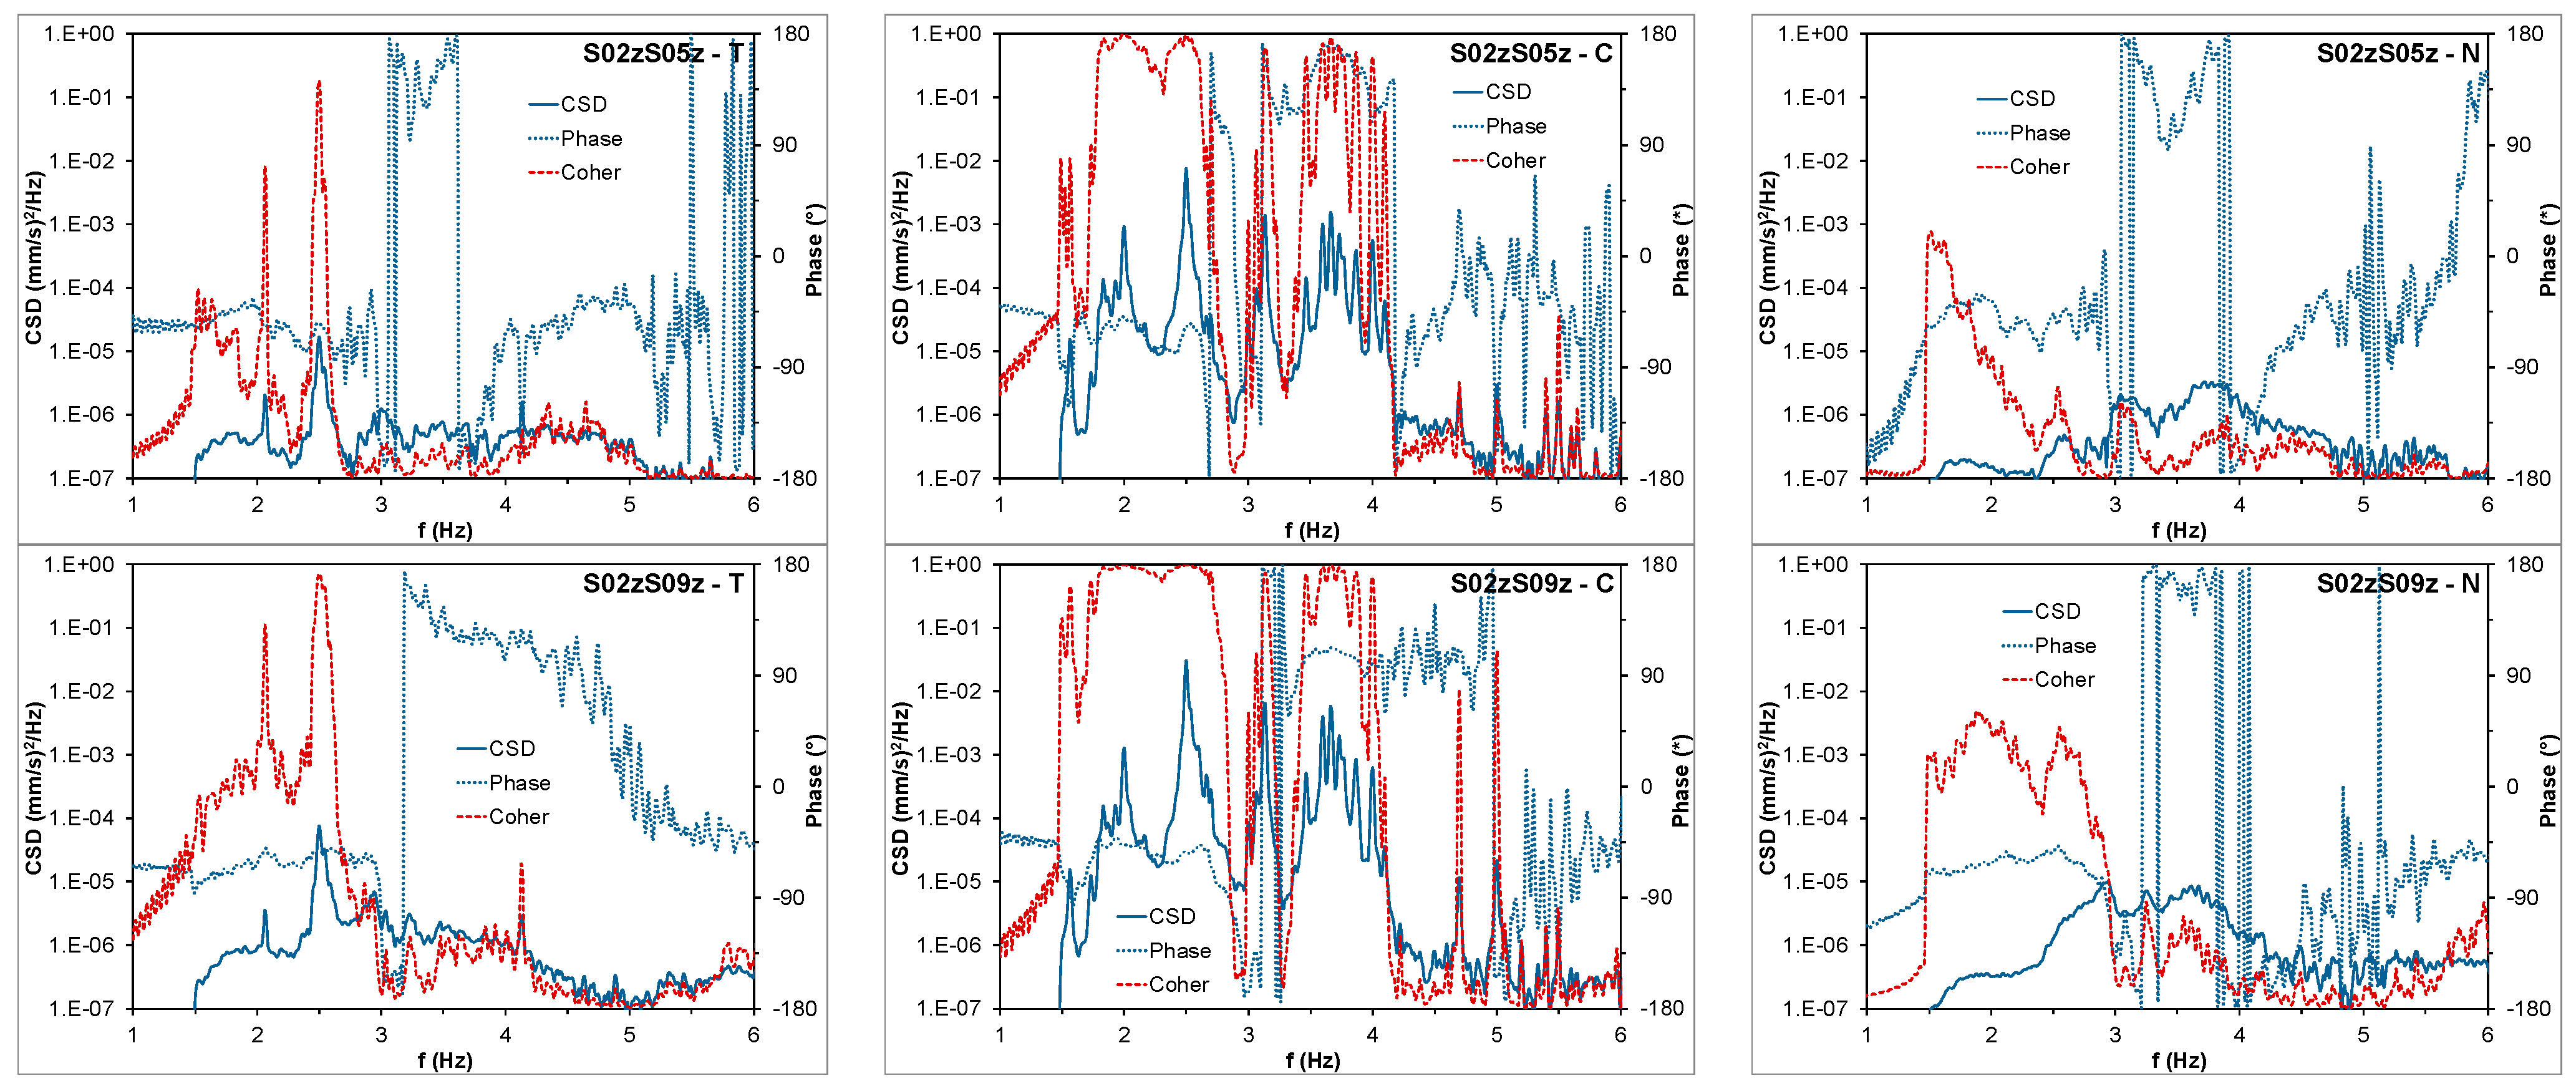
The CDSs plotted in
Figure 15 often show significant values of the phase factor and the coherence function between the records at different locations, validating the hypothesis about presence of buried structures.
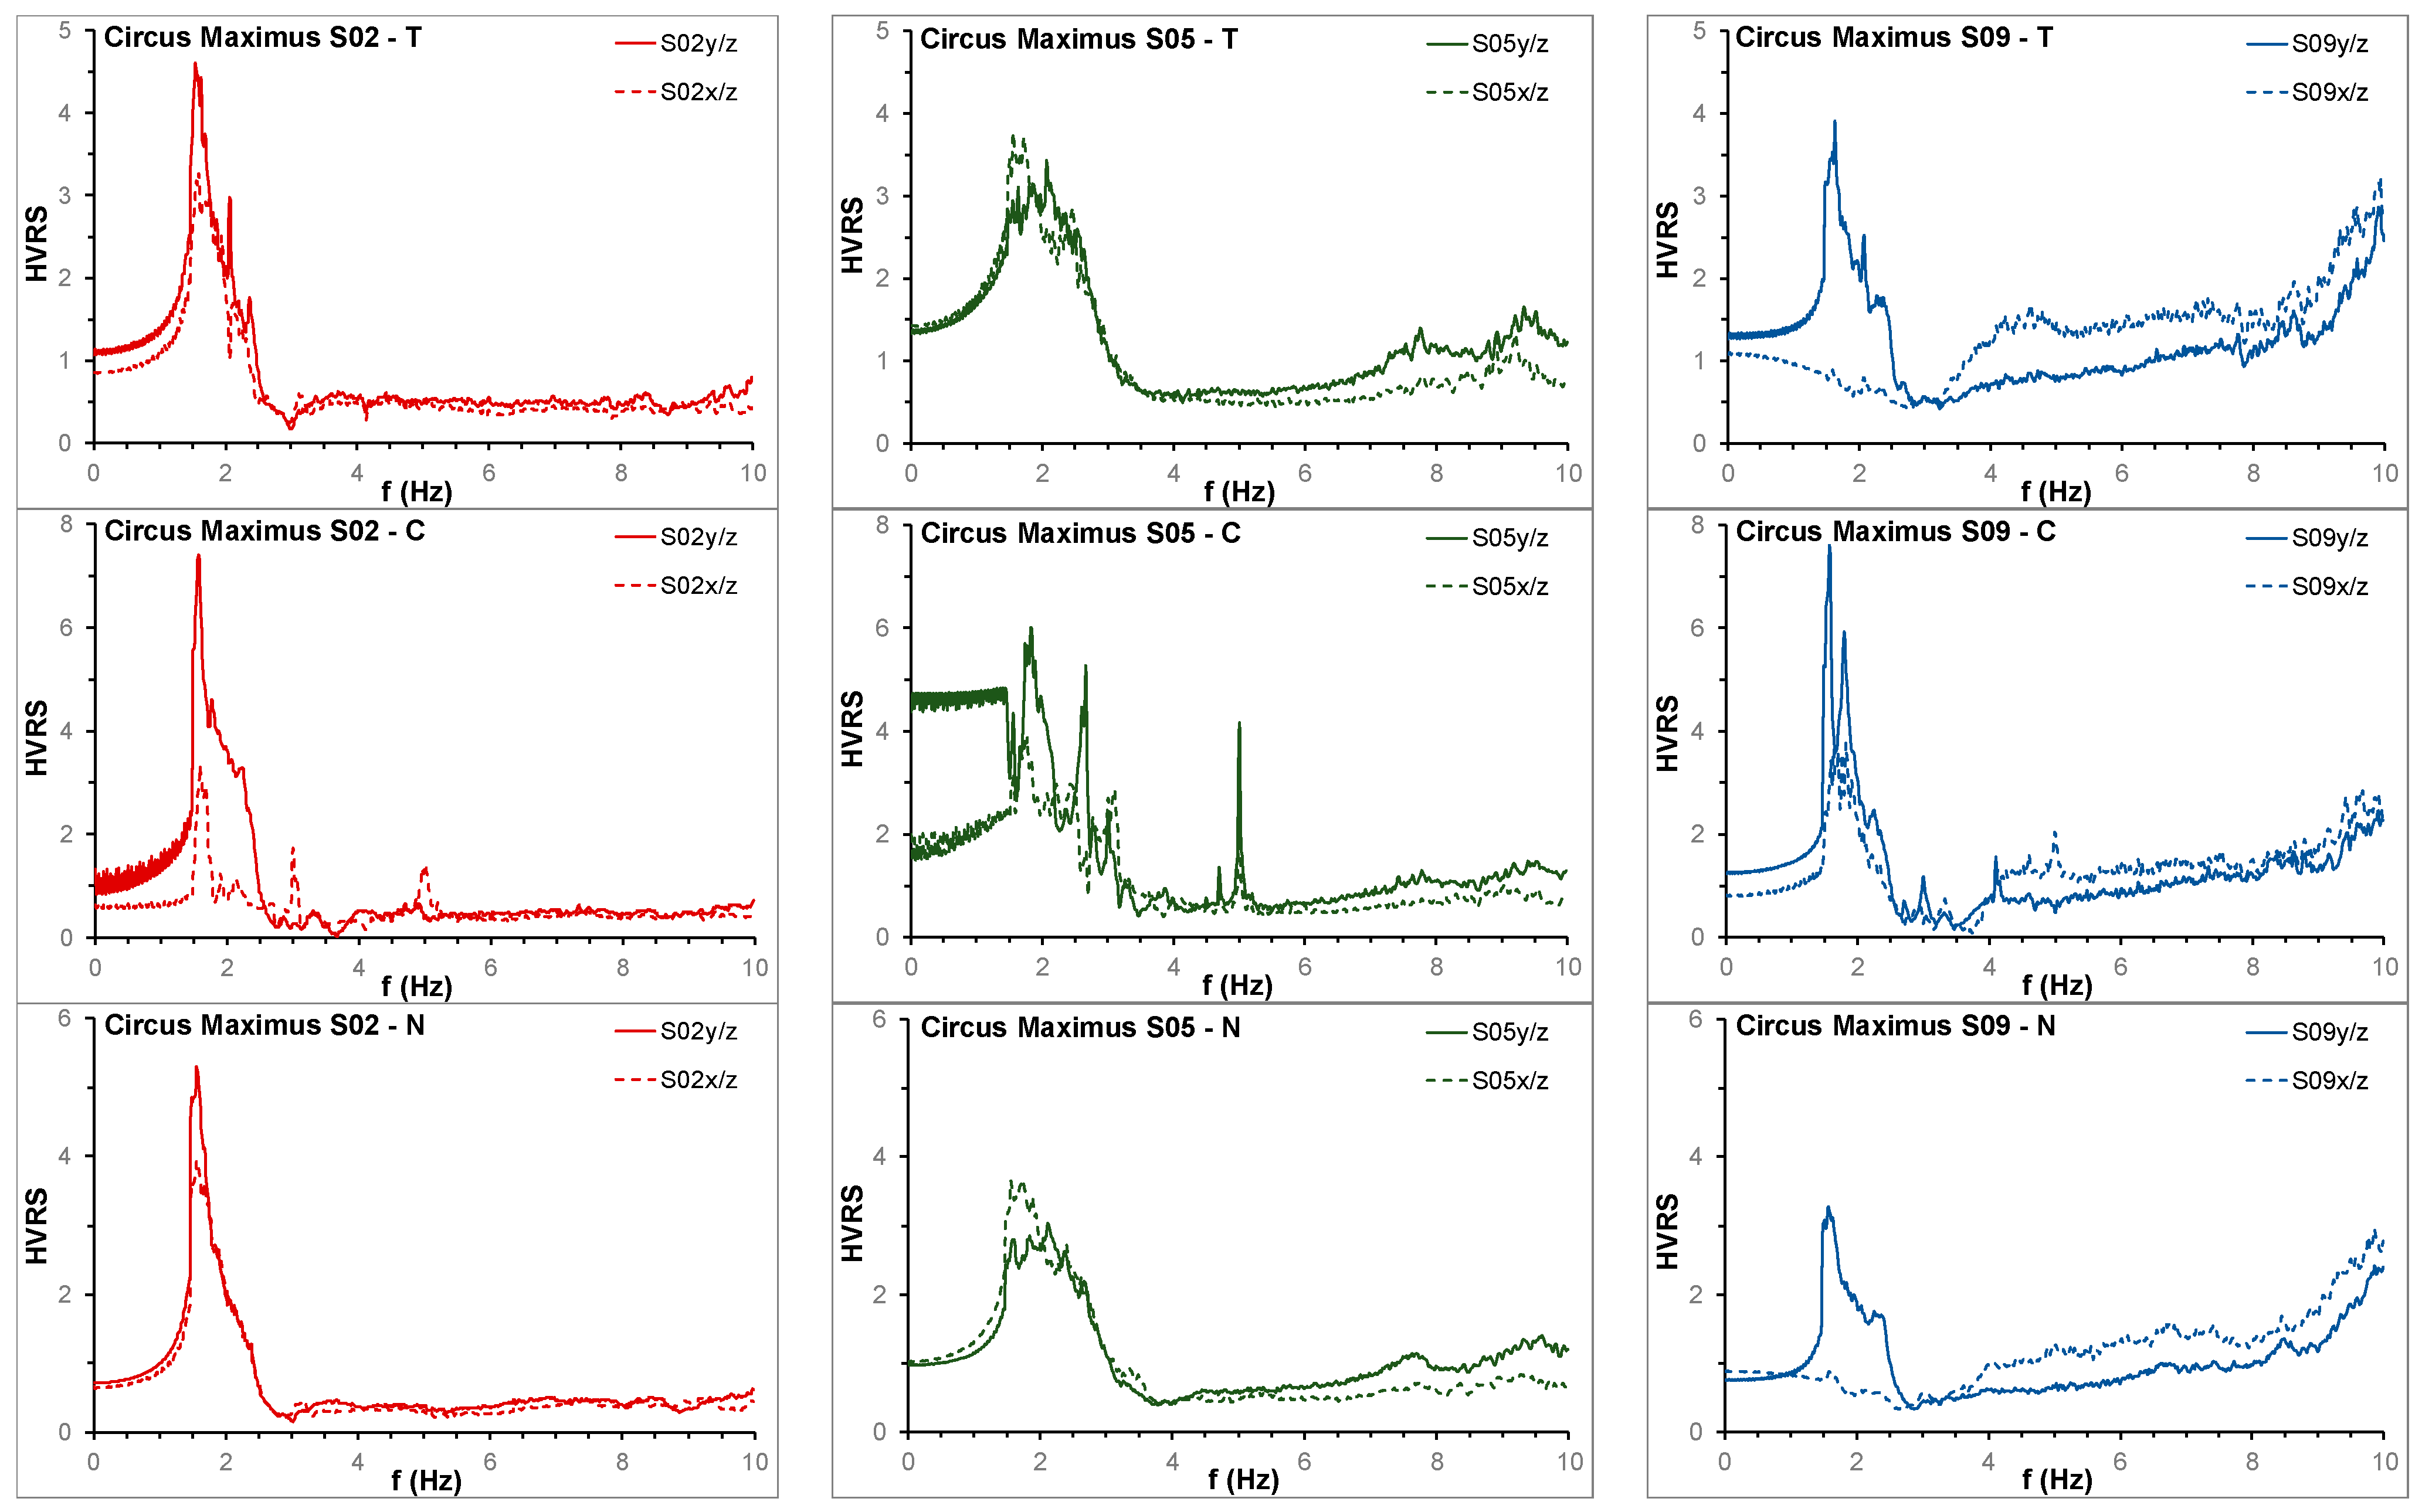
In
Figure 16, the spectral ratios between each horizontal and the vertical component are plotted for S02, S05, and S09. In almost all cases, the maximum ratio is at 1.55 Hz, with values higher for the y direction. This frequency is probably related to the soil characteristics.
5. Time Domain Analysis
5.1. The Torre della Moletta
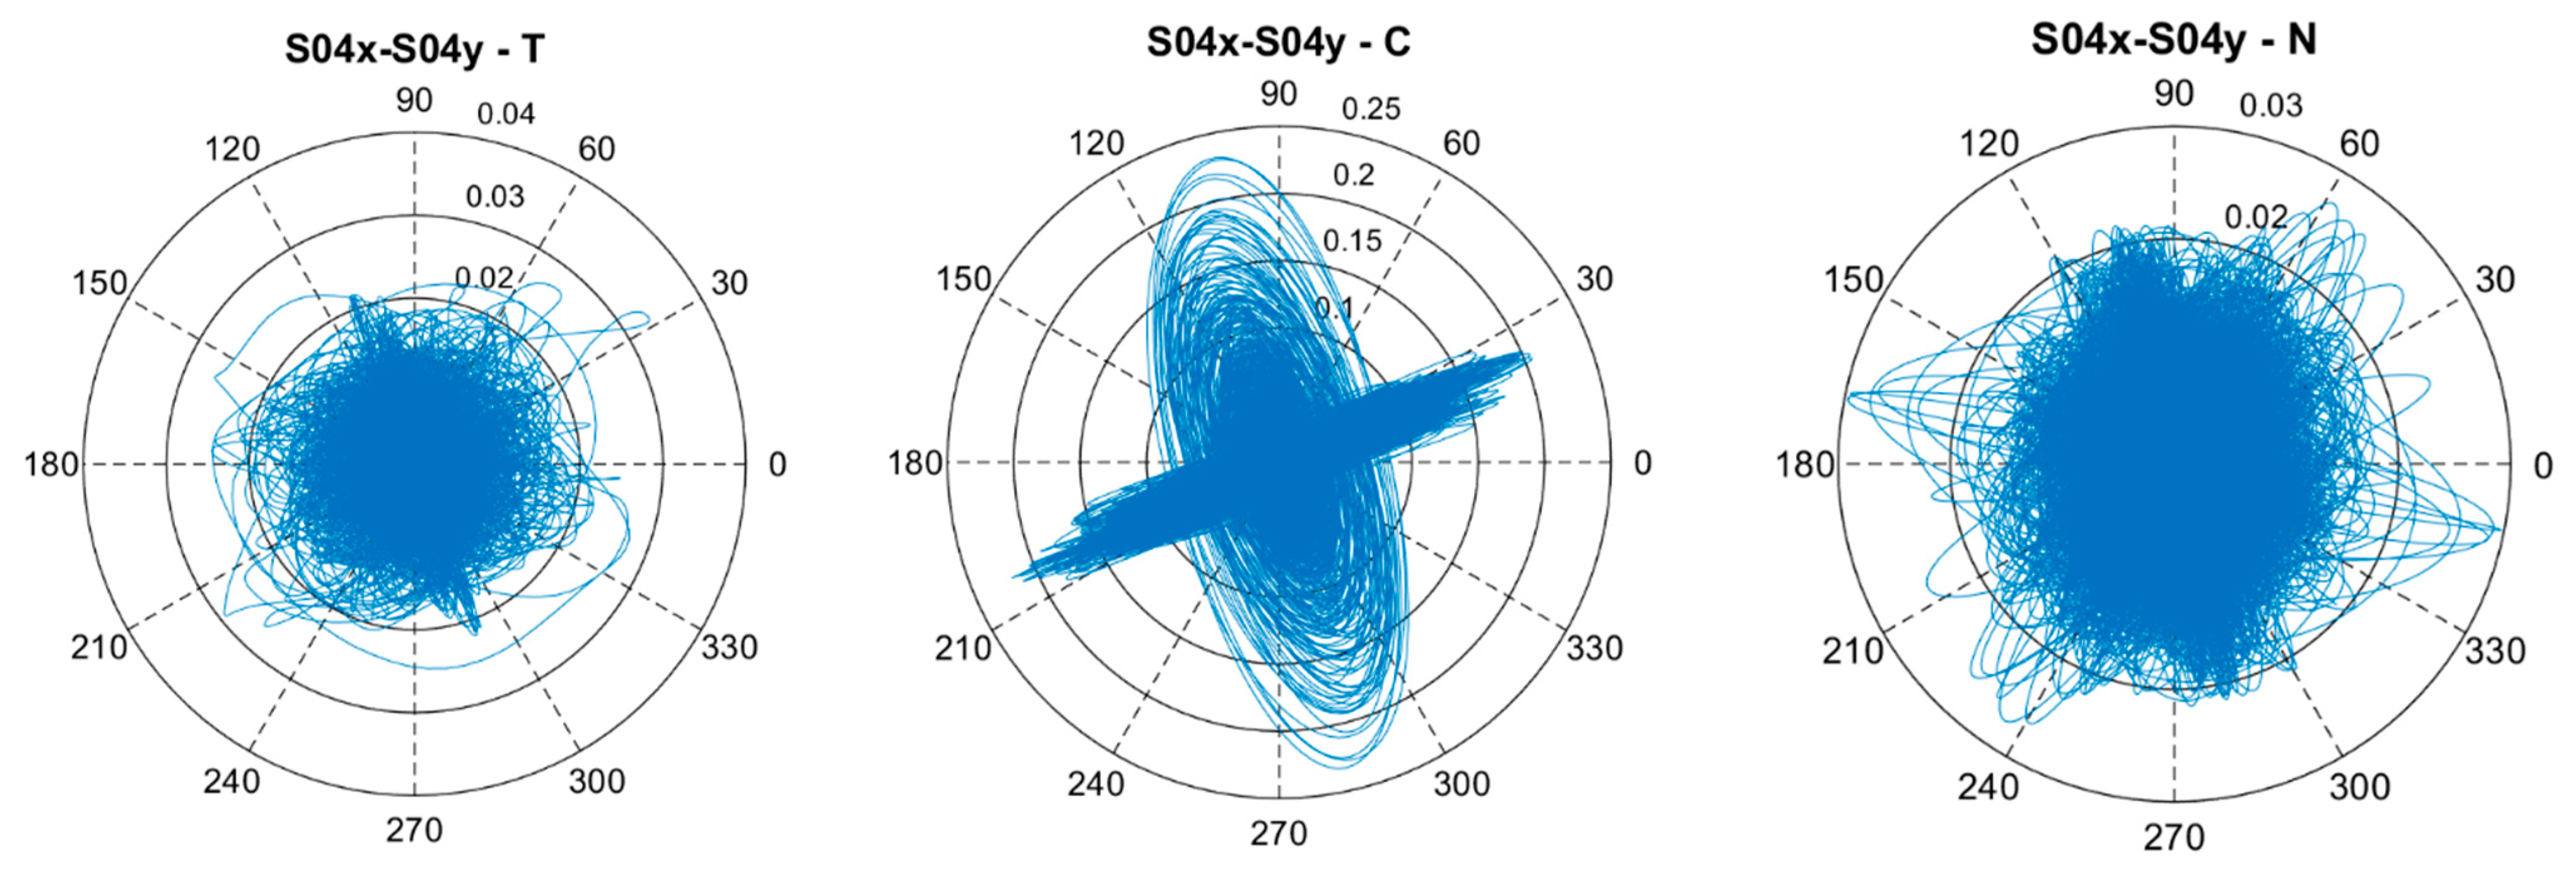
Figure 17 shows the particle motion at S04 of the Torre della Moletta, during the three time intervals (T, C, and N). As one can see, the motion is almost chaotic during N and T without a preferential direction of vibration. Instead, during the concert, two orthogonal preferential directions are evident, with much higher amplitudes. These directions are related to the geometrical characteristics of the tower.
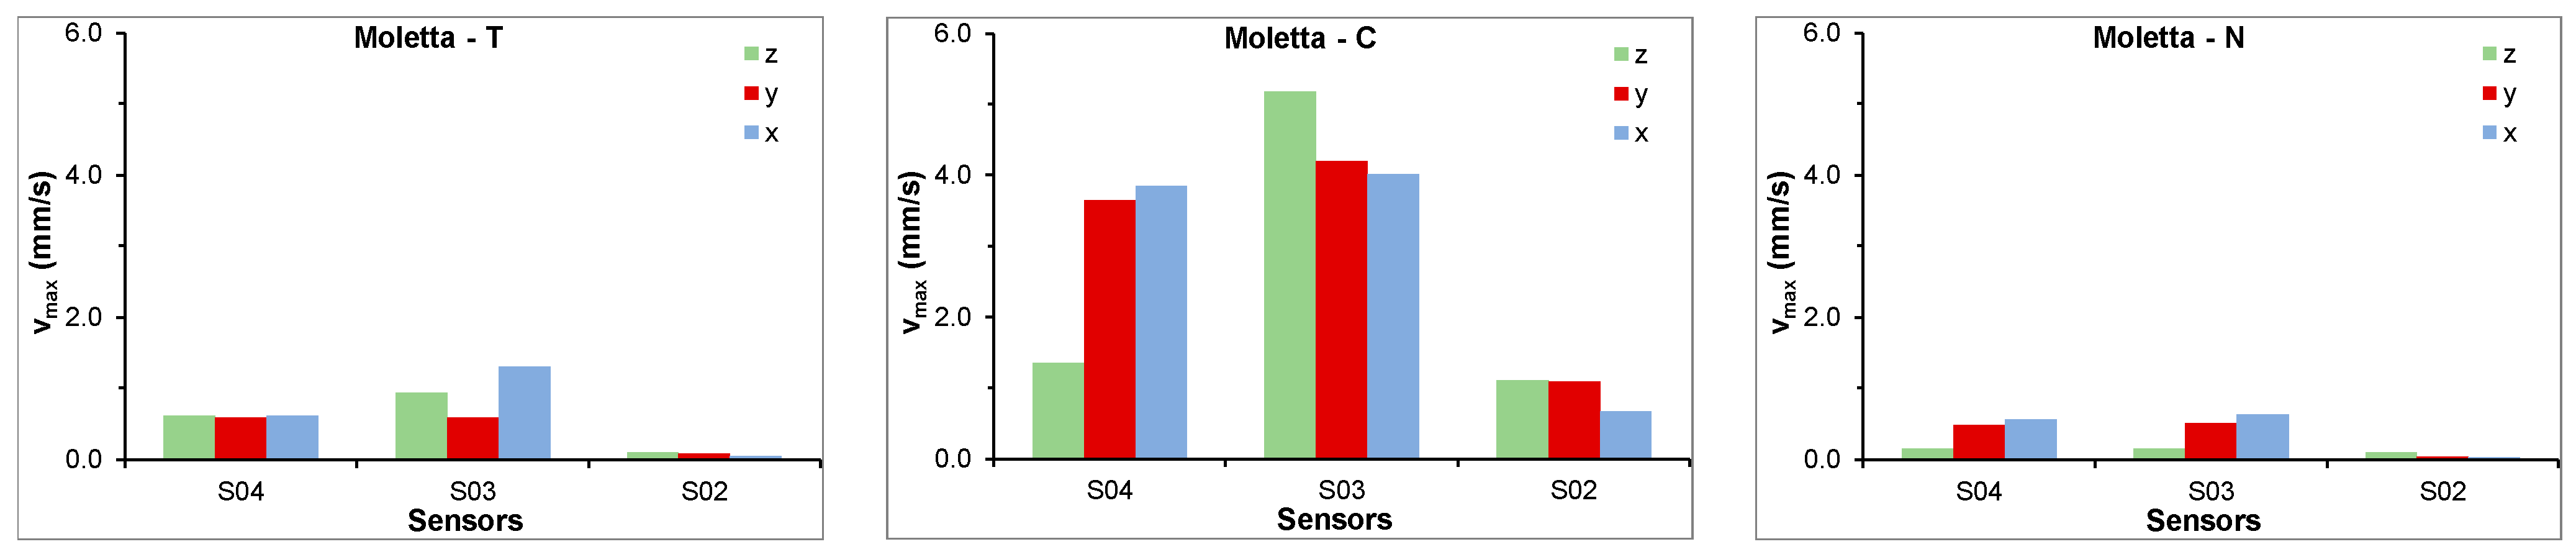
Figure 18 shows the maximum values of the velocity recorded in the three directions (x, y and z) at the three locations (S02, S03 and S04) of the Torre della Moletta, during the three intervals (T, C, and N). The amplitudes recorded during the concert (C) were more than ten times those after the concert in the presence of ambient noise only (N). Instead, those during T were 2–3 times those during N.
5.2. The Circus
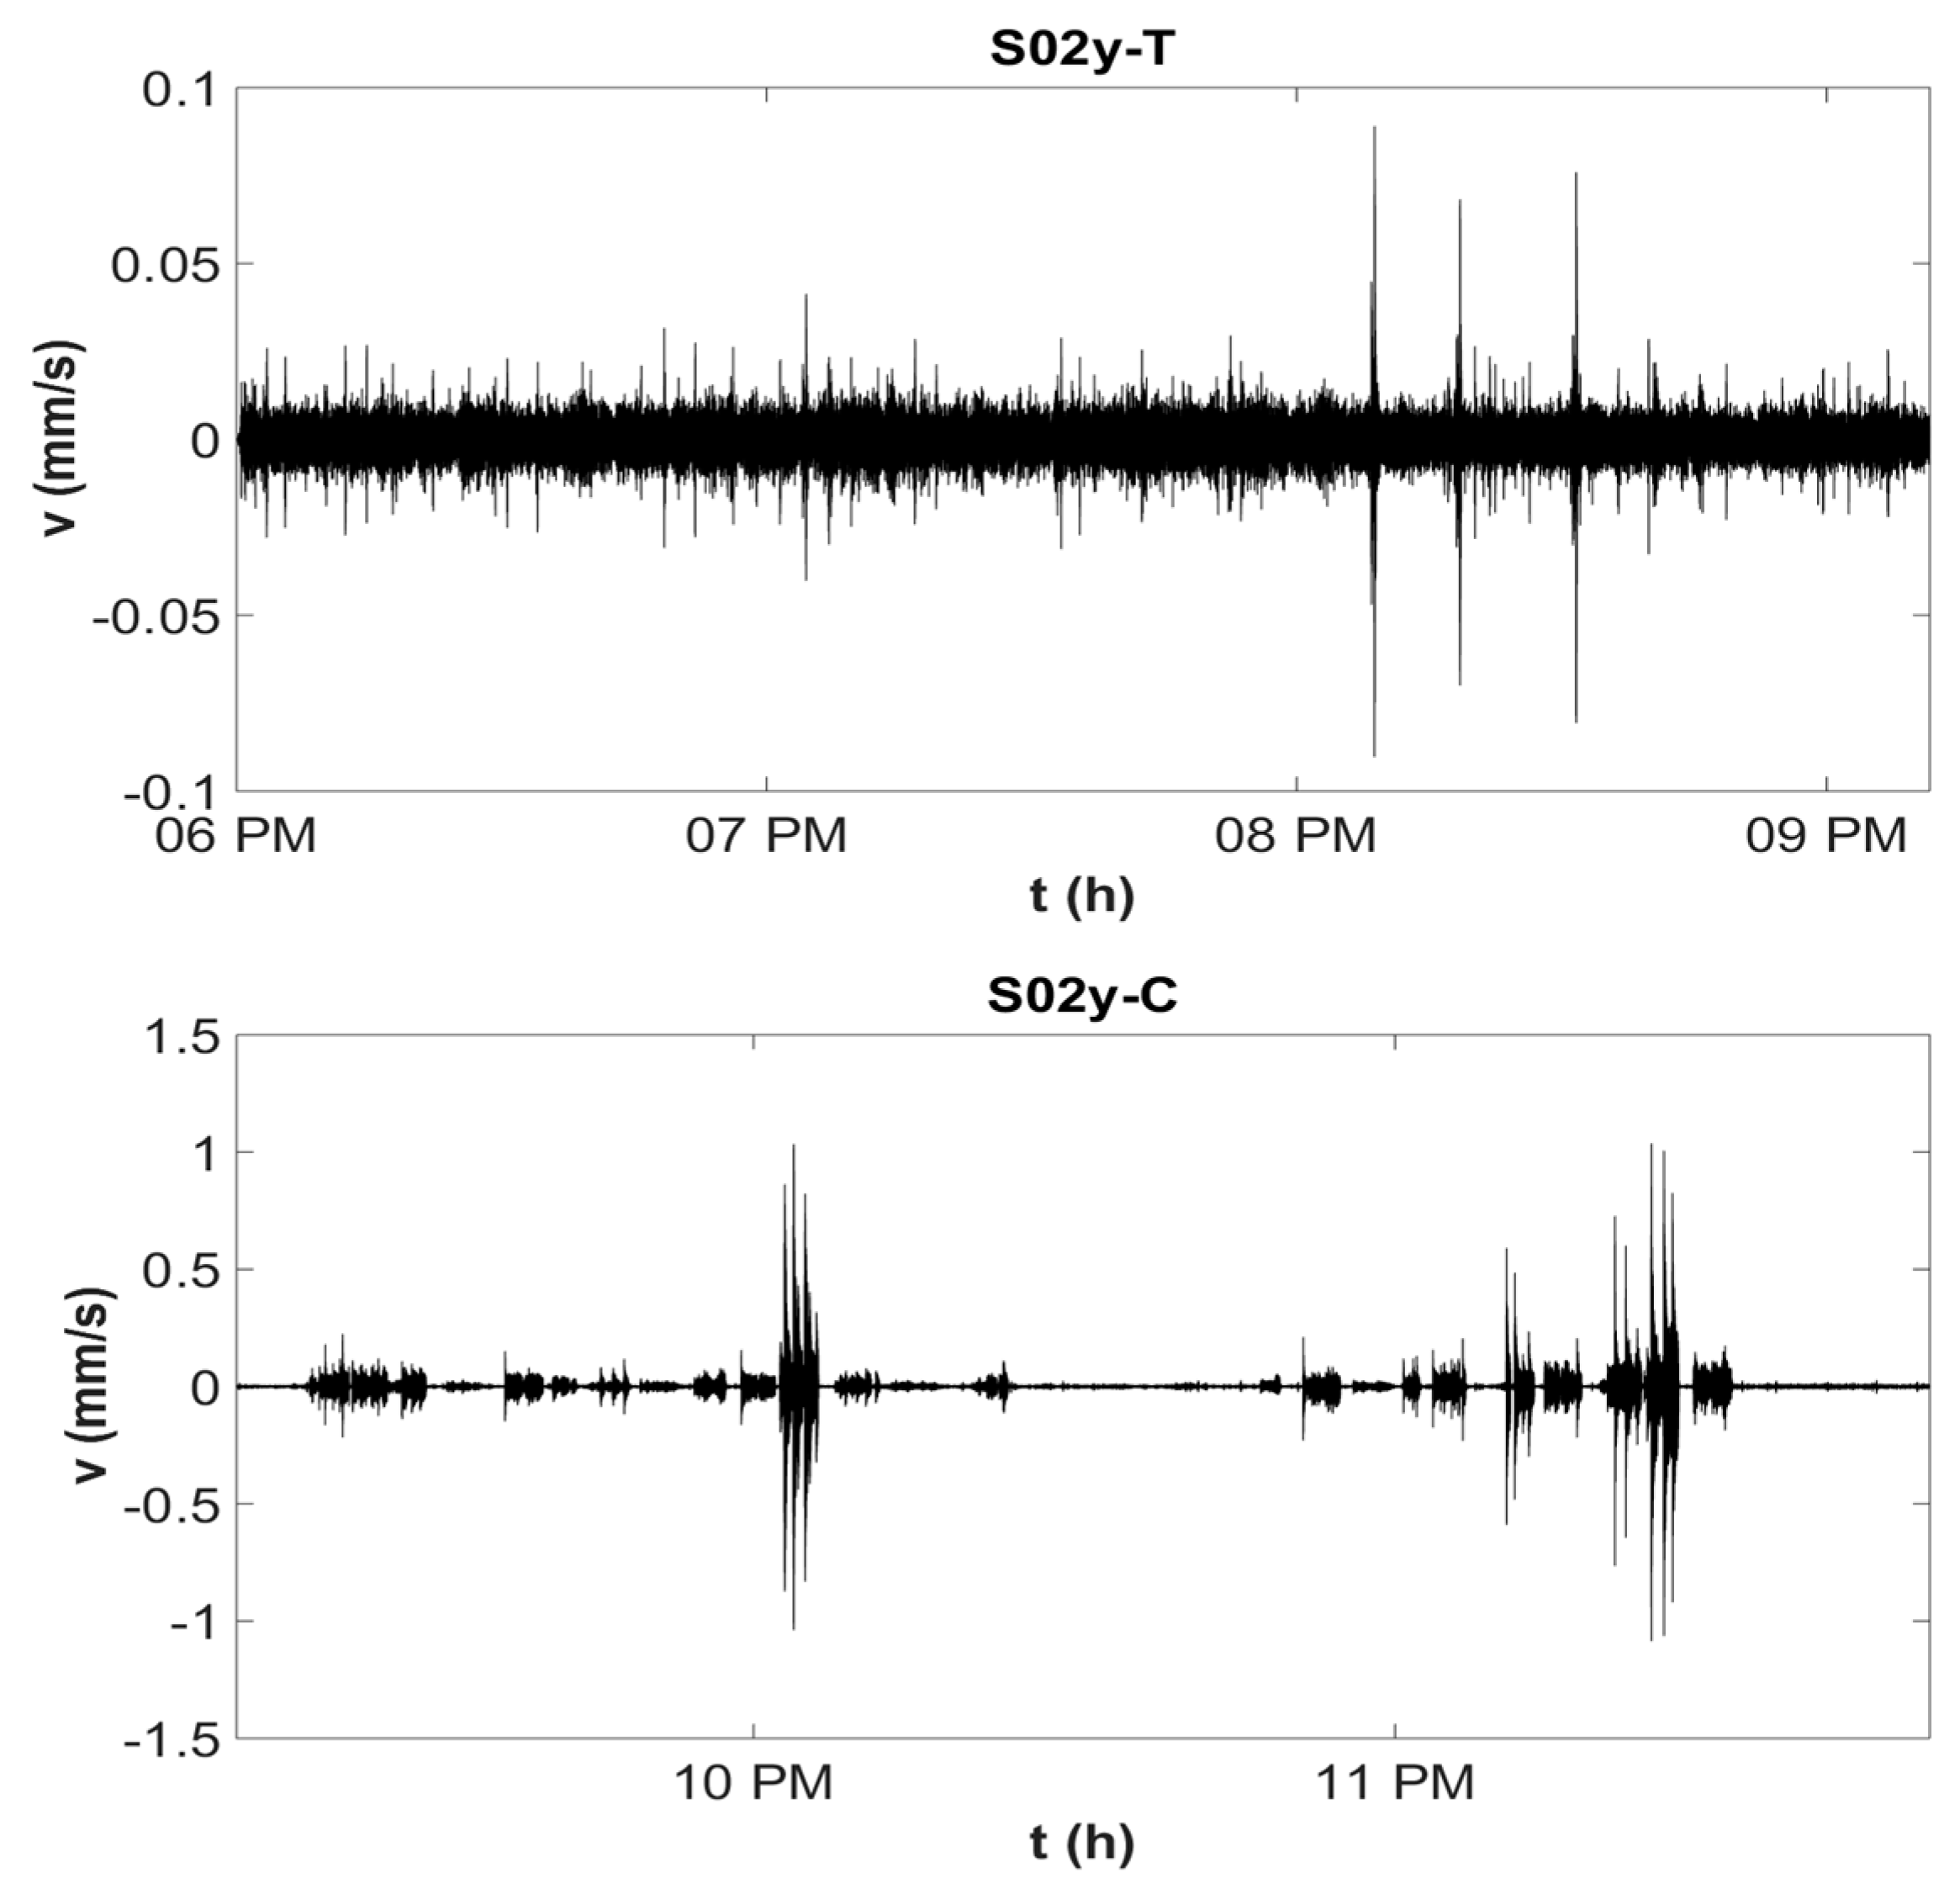
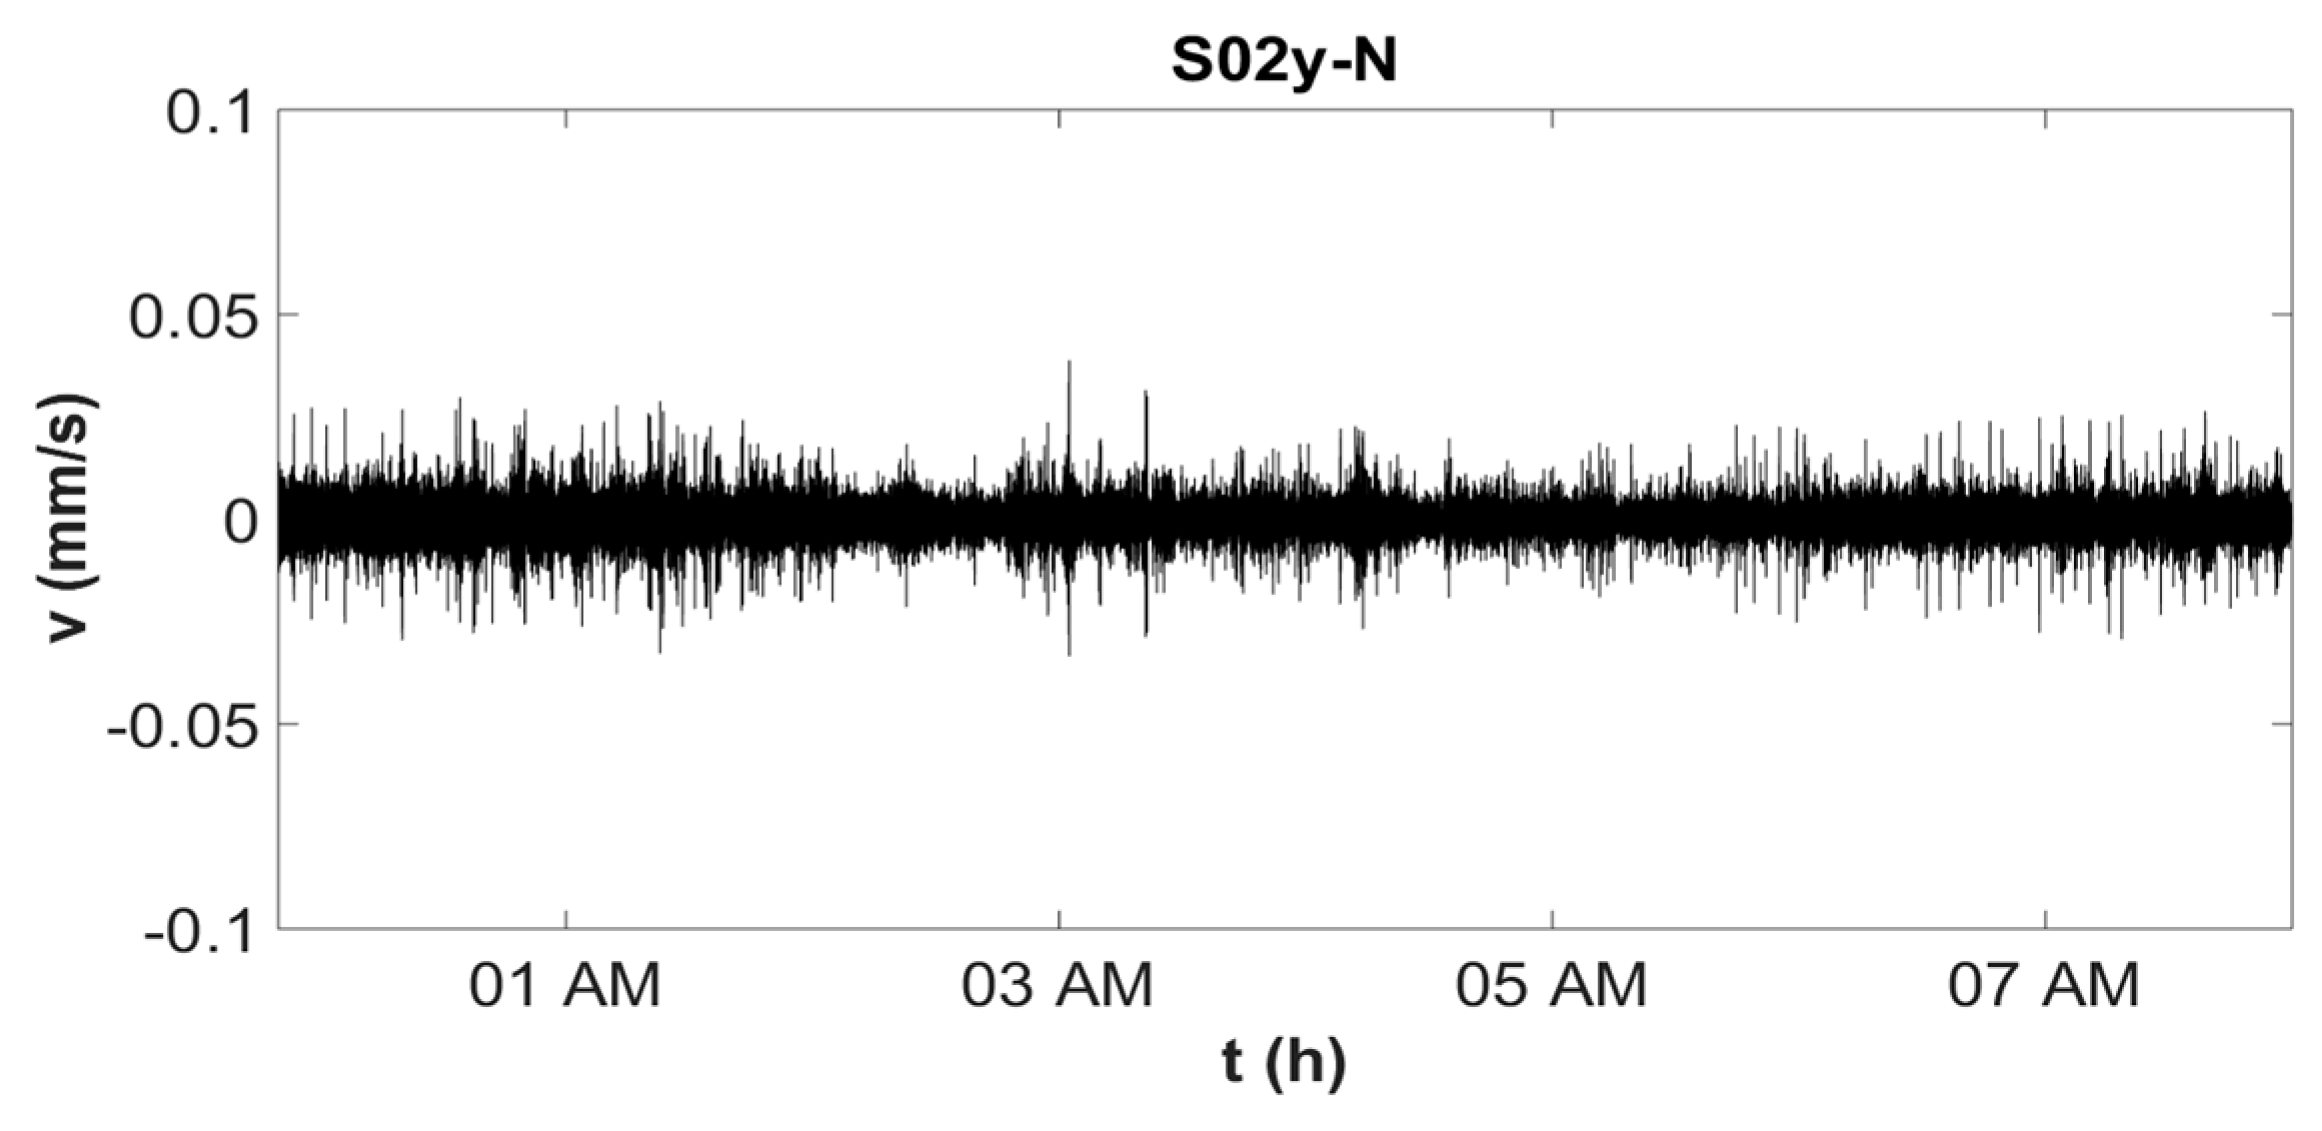
Figure 19 shows the time histories in the y direction at S02, during the three time intervals (T, C, and N), while
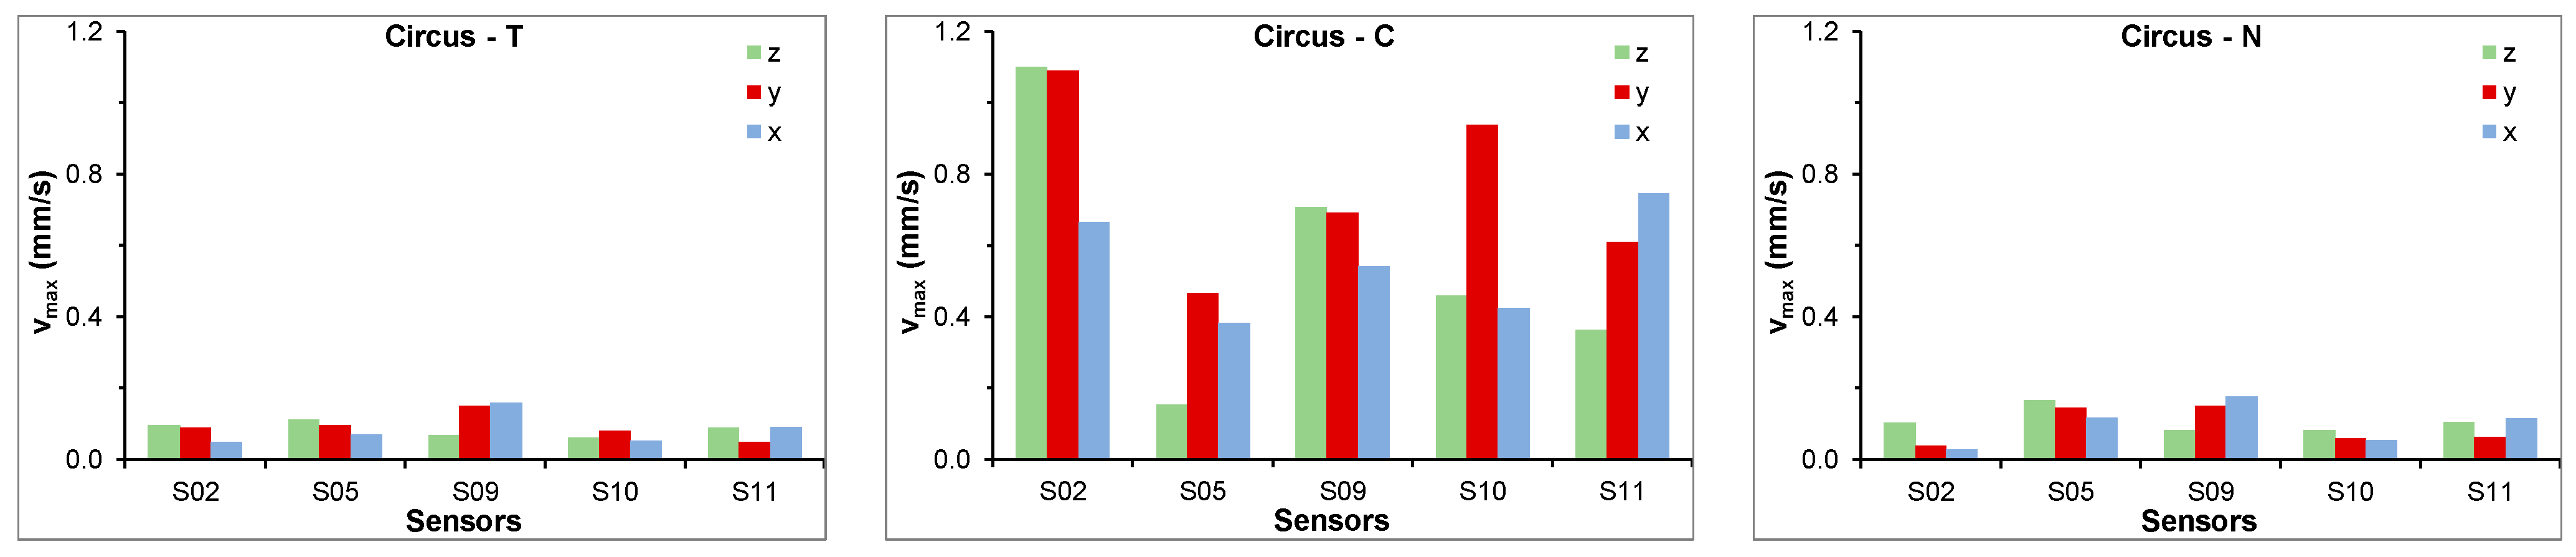
Figure 20 shows the maximum values of the velocity recorded in the three directions (x, y, and z) at the locations S02, S05, S09, S10, and S11, during the three intervals (T, C, and N). As for the tower, the amplitudes during the concert (C) were much higher than that during T and N.
The maximum values of the velocity recorded at different locations are reported in
Table 1. These can be compared with those suggested by the codes for vibration in structures. For historical buildings, subjected to vibrations with frequencies < 10 Hz, the following limit values for the velocity V are suggested by UNI-9916 [
28]:
Short-term vibrations: V = 3.0 mm/s at the foundation and V = 8.0 mm/s at the top;
Permanent vibrations: V = 2.5 mm/s;
Building floors: V = 10 mm/s (no historic buildings).
Table 1.
Maximum values of velocity (mm/s).
Table 1.
Maximum values of velocity (mm/s).
| Location | x | y | z |
|---|
| S02 | 0.67 | 1.09 | 1.10 |
| S03 | 4.01 | 4.20 | 5.18 |
| S04 | 3.85 | 3.65 | 1.35 |
| S05 | 0.38 | 0.47 | 0.17 |
| S09 | 0.54 | 0.69 | 0.71 |
| S10 | 0.43 | 0.94 | 0.46 |
| S11 | 0.75 | 0.61 | 0.36 |
With specific reference to traffic-induced vibrations, SN640312 [
29] suggests:
Permanent vibrations: V = 1.5 ÷ 3.0 mm/s;
Frequent vibrations: V = 3.0 ÷ 6.0 mm/s;
Occasional vibrations: V = 7.5 ÷ 15 mm/s.
As one can see, the recorded values are always lower than the limit ones, even though, in some cases, they approach to them. It must be noted that the limit values are established for non-damage historic buildings. For ruins and historically damaged structures in general, lower values should be considered to avoid further damage.
6. Soil Investigation
In order to better analyze the archaeological site and to direct future investigations on the local seismic response and soil–structures interaction, a detailed analysis of the soil characteristics was carried out. The main features are in the following.
6.1. Geological Setting of the Study Area
The Circus Maximus archeological area is in the historical center of Rome, Italy, within the ancient Murcia valley, between the Aventino and Palatino Hills, and occupies almost the whole SE-NW oriented morphological depression. During the Roman ages, the entire valley was transformed into what today represents the largest monument of antiquity ever built, for religious and recreational activities above all. After the fall of the Roman Empire, the Circus area was abandoned and again subjected to Tiber River floods and the formation of swamps with some periods of re-use. It changes its vocation through the centuries up to the 19th century, e.g., from agricultural to residential, and even to industrial. Starting from the 1930′s, the valley floor was freed from pre-existing industrial buildings, and the Circus Maximum Monumental Area was established to protect the remains. Furthermore, massive excavations were carried out, mainly concentrated in the south-eastern sector. The first investigation campaign involved the drilling of a 1330-m deep borehole [
30,
31], aimed to improve the geological knowledge of the entire Roman sector, which also provided reliable information on the stratigraphy of the Murcia Valley. From a geological point of view, the valley is carved into the Plio-Pleistocene clays known as “Mount Vaticano” Formation (MVF), which is hundreds of meters thick, representing the geological substratum of the whole Roman area. According to Marra et al. [
32,
33], during middle–late Pleistocene and Holocene times, the sedimentary processes over the whole Roman area were strongly controlled by sea level changes linked to glacio-eustatism, thus also influencing the sedimentary processes that led to the progressive infilling of the Murcia valley via a fining-upward sequence, from gravels with some intercalations of clay at the bottom to peaty clay, closed by an anthropogenic layer (historical backfillings). In
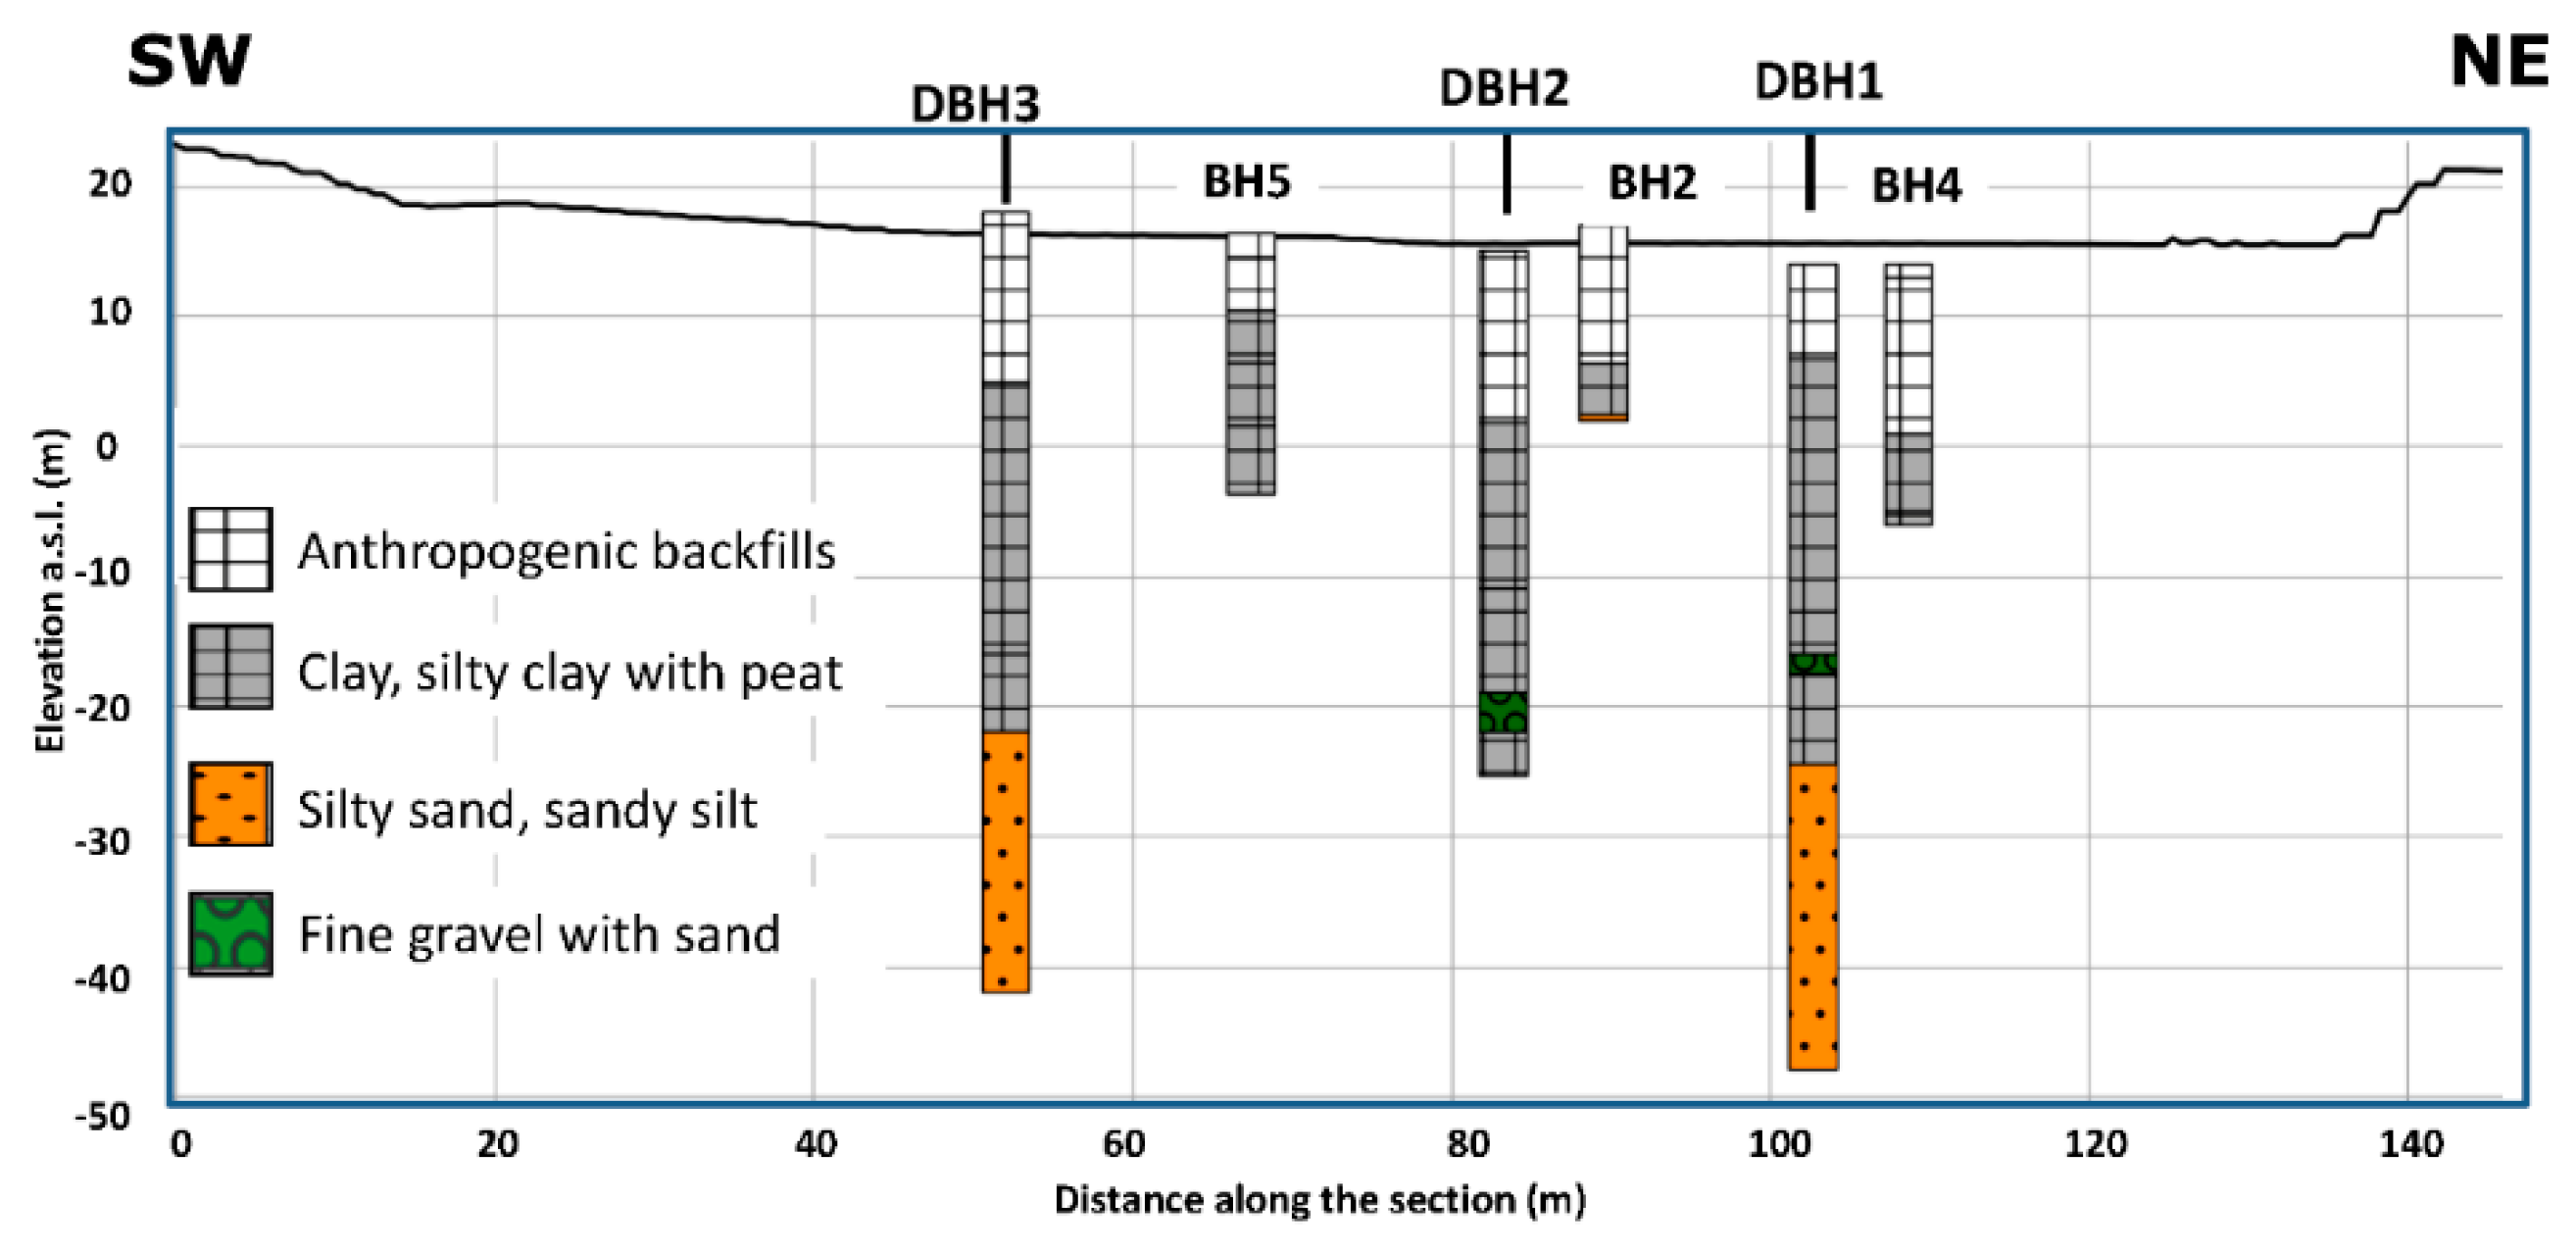
Figure 4, the locations of the available boreholes in the area are shown, while the stratigraphic setting, referred to the south-eastern end of the archeological site, is described hereinafter (
Figure 21). The surface layer is represented by a heterogeneous and poorly graded deposit, from sandy gravel to gravelly silty sand to clayey silt. It is often brown in color, stiff to very stiff in texture, and contains, in some cases, potteries and even fragments of concrete. The thickness ranges from about 1–2 m to about 14 m. To greater depth, a very thick geological body is made of fluvial and fluvial-marshy environments deposits. It consists of clays, silts, and clayey silts, with colors varying from dark brown to dark grey and grey, which are soft to very soft, generally containing abundant organic matter (with levels of peat). This alluvial body is reported in geotechnical borehole logs as slightly coarser at greater depth, ranging from fine sands to sandy silts. Since the drillings did not pass through this fine-grained alluvial body, the whole Valle Murcia quaternary sequence is supposed to be closed at the bottom by gravels (about 12 m thick) which, in turn, rests above the Plio-Pleistocene clays. It is worth noticing that the surface layer, mostly consisting in backfills accumulated through centuries, is rather continuous over the study area and over the whole archeological site. It also contains groundwater whose level is very close to the ground surface since it rests almost constantly at about 13.5 m a.s.l. without significant seasonal variation.
6.2. Geophysical Investigations
Geophysical tests were carried out over the whole study area to characterize the subsoil in terms of possible amplification phenomena, inspecting the fundamental frequency of the site by means of the spectral ratio technique from ambient vibration recordings [
24], deploying three-axial single stations in seven sites, as shown in
Figure 4. Noise data in CM1 to CM4 sites were recorded with three-axial Tromino Engy Plus. In CM5, CM6, and CM7 sites, SL06 three-axial seismometers were used.
A surface wave test was conducted to retrieve a reliable seismic characterization of the subsoil in terms of shear waves velocity Vs. For this purpose, a 57.5-m-long seismic profile was used, deploying 24 sensors equally spaced of 2.5 m (
Figure 4), after checking the compliance of the site conditions with the hypothesis of horizontally layered medium under the seismic profile, as suggested by the stratigraphic setting depicted in
Figure 21 (i.e., transversal to the Murcia Valley, parallel to the seismic line). Vertical and horizontal geophones, both with a nominal frequency of 4.5 Hz, were used to achieve dispersion data, referred to Rayleigh’s (both vertical and radial components were acquired) and Love’s waves, respectively. Seismograms were recorded considering forward and reverse shots along the survey line with different offset distances [
34]. An 8-kg sledgehammer was used as a wave source, striking it vertically over a steel plate to generate Rayleigh’s waves dispersion or over a wooden beam firmly fixed to the ground to generate Love’s waves dispersion. As the site is noisy due to the traffic, a very different number of recordings was stacked at each shot position to achieve seismograms with an acceptable signal-to-noise ratio.
Table 2 resumes the adopted values of the main acquisition parameters.
6.3. Results of the Ambient Vibration Recording Analysis
The procedures proposed in SESAME 2004 were implemented for the processing and the statistical validation of the horizontal–vertical spectral ratio (HVSR) curves. The duration of the noise recordings ranged from 60 to 245 min, using sampling frequencies equal to 128 Hz (Tromino) and 200 Hz (SL06). Each recording was subdivided into time windows of 60 s, the most stationary parts of the registered signals were selected, and the transient parts were excluded, which could be associated to close sources. Then, for each time window, the signal was cosine tapered (5%) and the Fourier spectrum was calculated within the 0.20 ÷ 20-Hz frequency interval. Smoothing was applied using the Konno–Ohmachi function, and a constant bandwidth coefficient “b” ranging from 25 to 35 was adopted [
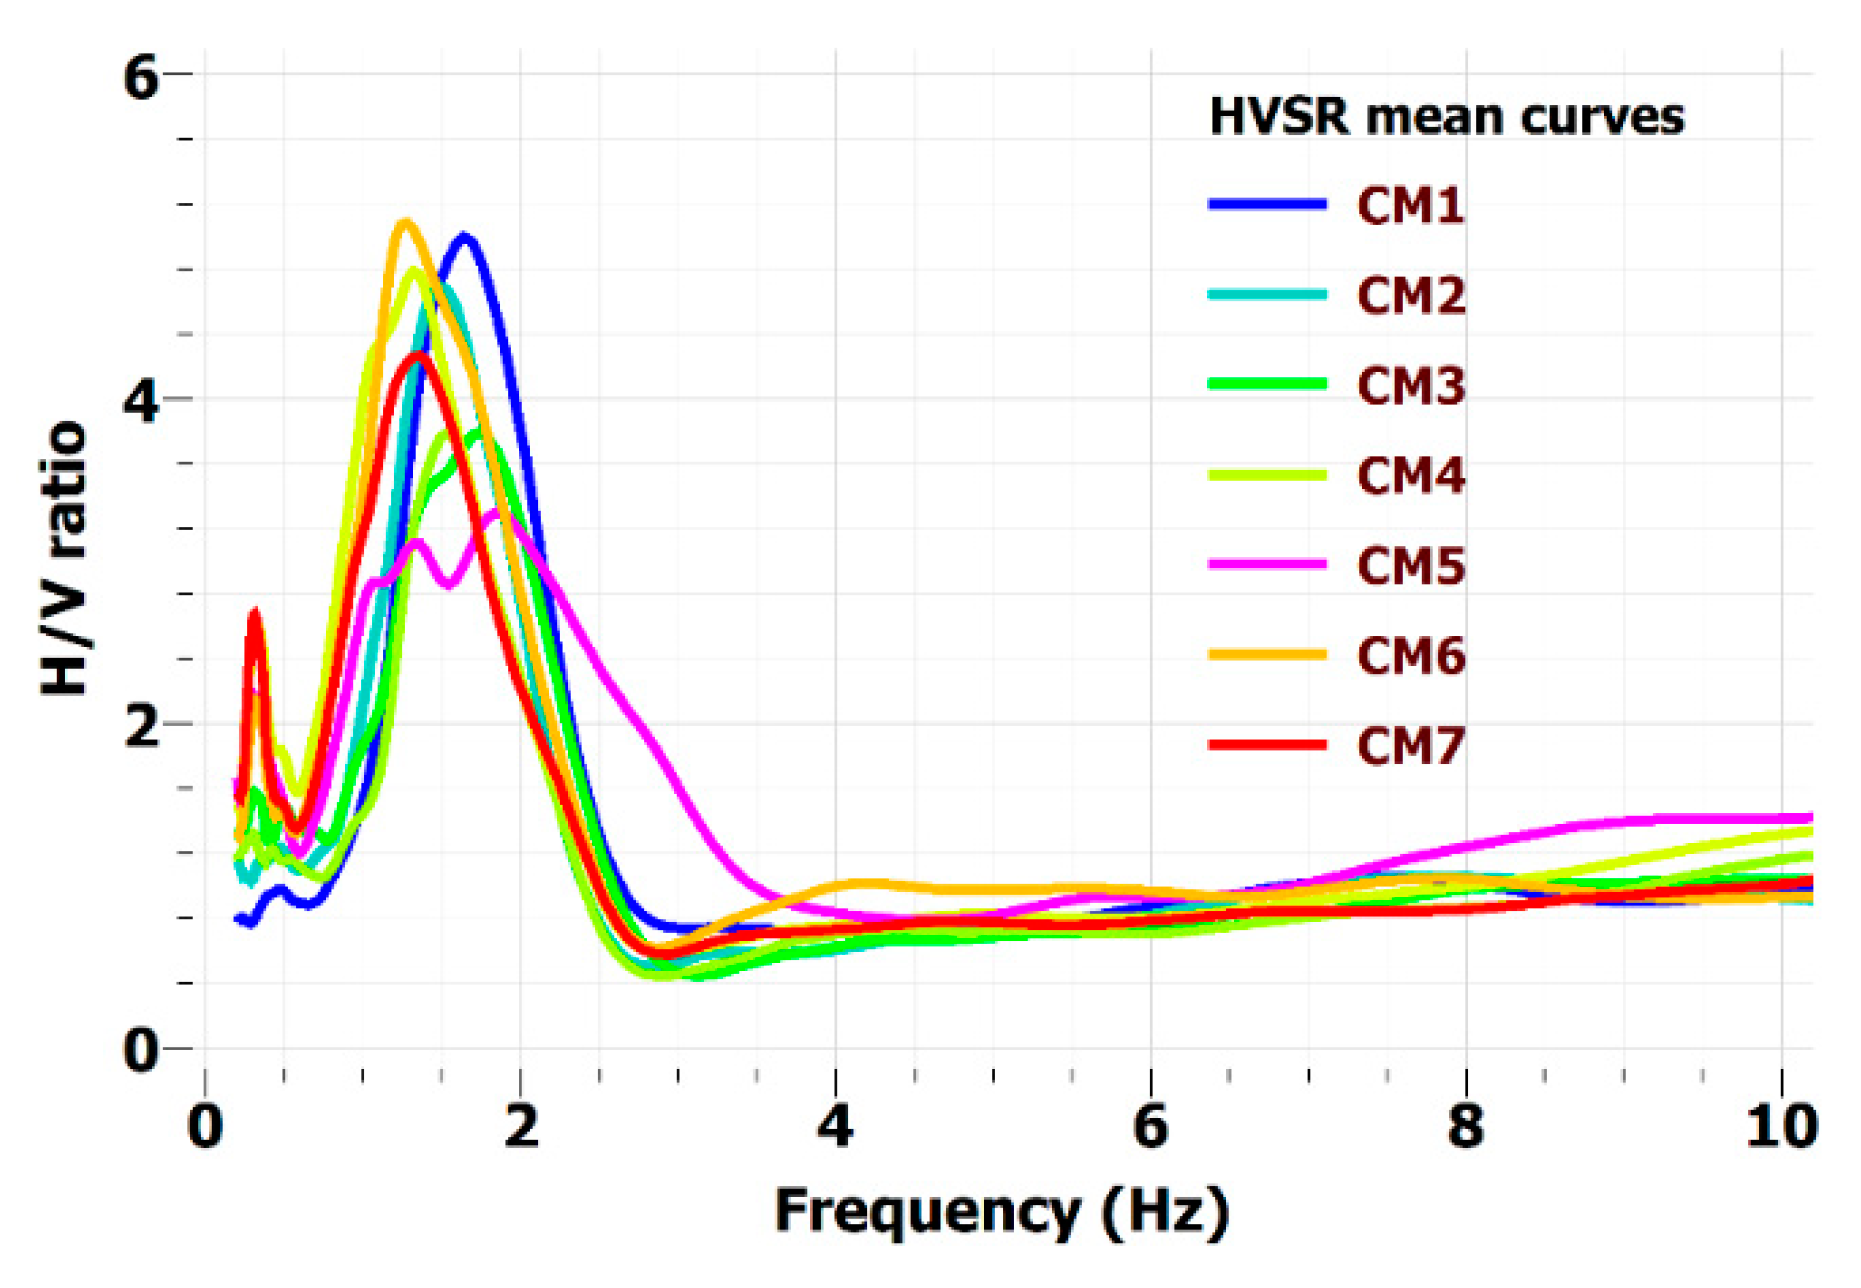
36]. The spectral ratio curve was calculated between the two horizontal components and the vertical one, according to Nakamura’s procedure. Processed data, in terms of HVSR curves, are reported in
Figure 22. At every recording site, a peak around the frequency of 1.5 Hz was detected by using Nakamura technique. The H/V amplitude at the frequency peaks is also high, close to 4, and was even higher for CM1, CM2, CM5, and CM7 locations.
All HVSR curves are also similar in shape apart from the one referred to the CM6 site, since they are slightly broader and with a less pronounced frequency peak amplitude. To infer the fundamental frequency value (F0) for each site, along each curve, the frequency peaks with a spectral ratio value greater than 2 were considered, thus the frequency peak to be considered as F0 is the one at about 1.35 Hz. Incidentally, considering the CM5 and CM6 curves, a secondary frequency peak at 0.35 Hz was detected. This low frequency peak seems to be linked to a deep seismic impedance contrast (hundreds of meters), probably related to the bottom of the Plio–Pleistocene filling of the Rome basin [
37]. These observations (i.e., the two frequency peaks) were used to constrain the shear waves velocity profiles during an inversion process of dispersion data, as shown in the following.
6.4. Dispersion Data Analysis and Shear Waves Profile Determination
The shear wave velocity (Vs) profile of the investigated site was obtained through the joint inversion of dispersion data derived from active tests and HVSR. Following the standard procedure for the acquisition and analysis of a multichannel active seismic record (the so-called multi-channel analysis of surface waves—MASW) [
38], the recorded seismic traces at each shot point were transformed into the velocity–frequency domain to obtain the corresponding phase velocity spectrum. In the present study, the dispersion data were processed according to the full velocity spectrum approach as described in [
39], avoiding difficulties in interpreting spectra in terms of modal dispersion curves. As general consideration, it must be underlined that this was a challenging site where conditions were far from ideal due to the heavy traffic, responsible for a high level of background noise during the active seismic survey. Furthermore, the space available for the seismic-data acquisition was very limited, corresponding to the width of the monumental area. Therefore, to achieve reliable results, the strategy to consider all possible objects for the joint analysis was adopted, namely:
The phase velocity spectrum of the Z component;
The phase velocity spectrum of the R component;
The phase velocity spectrum of the T component.
The horizontal–vertical spectral ratio (HVSR);
The Rayleigh particle motion frequency curve (RPM).
The fourth object was obtained by averaging the HVSR curves in
Figure 22 except for the CM3 and CM4 curves (far from the line). The fifth object can be extracted from active seismic data recorded with vertical and horizontal geophones; it summarizes the actual motion of a particle induced by Rayleigh waves in the subsoil and can be successfully exploited to constrain the shear wave velocity profile [
40,
41].
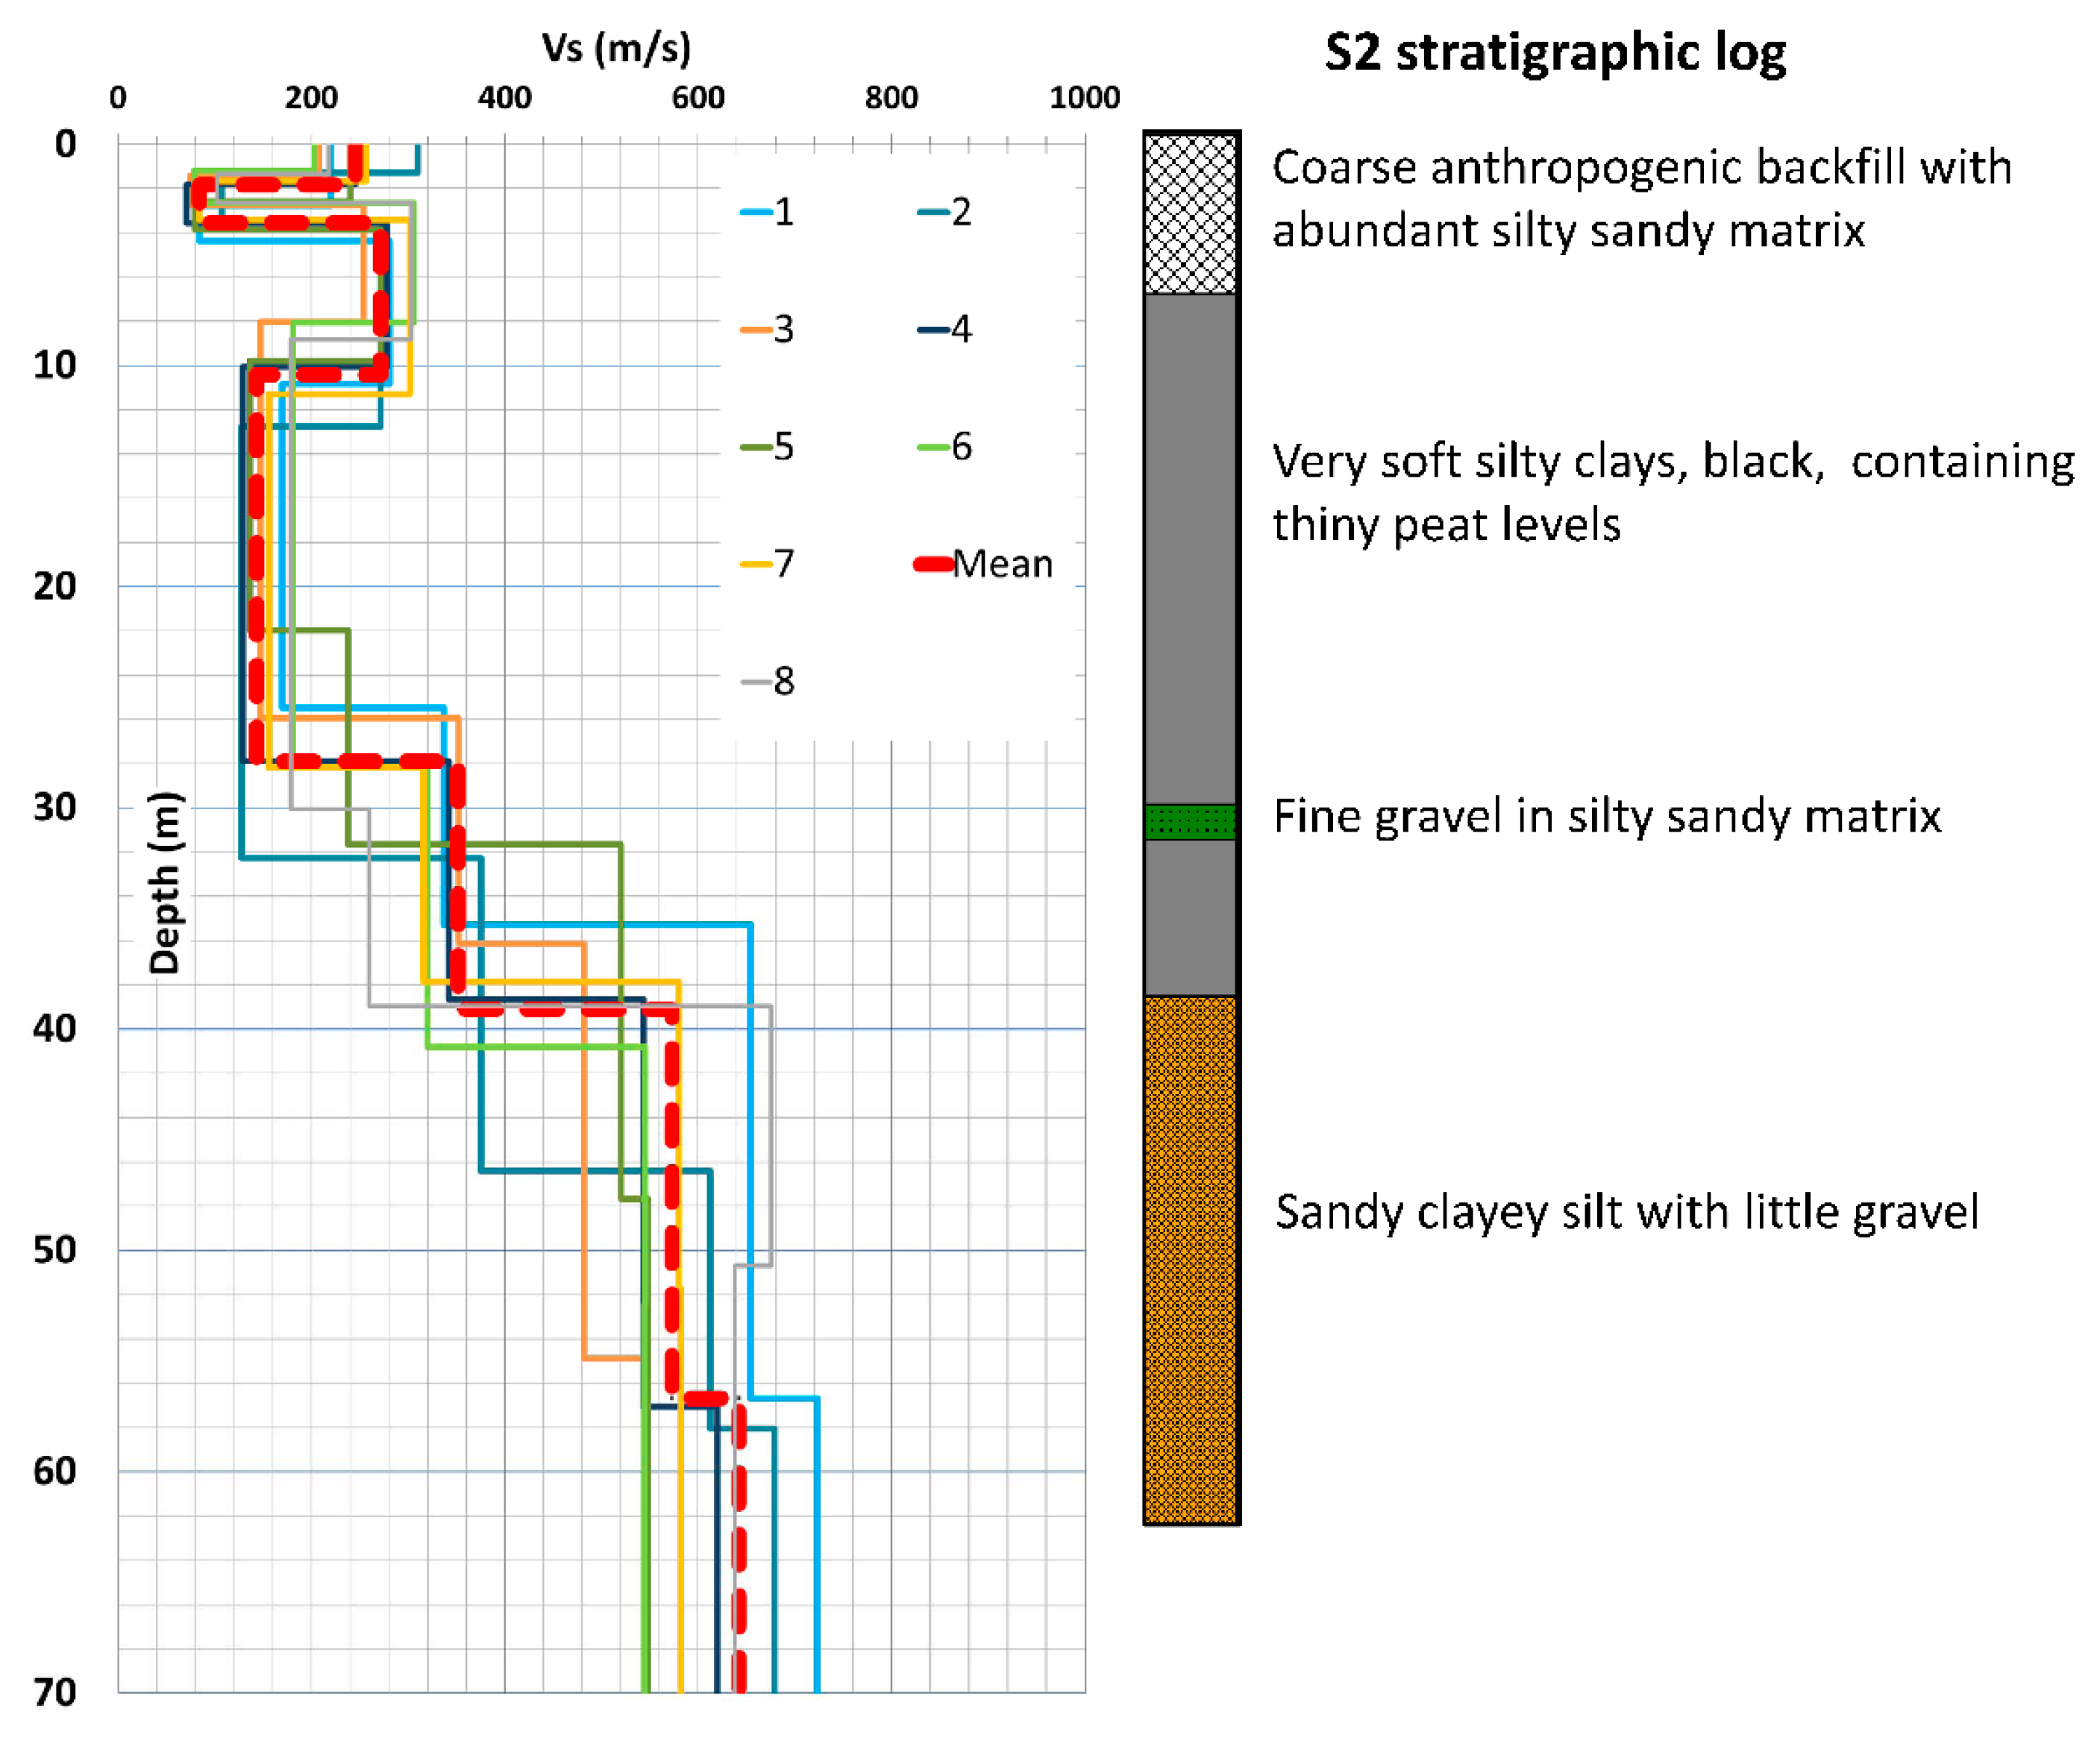
Table 3 summarizes the different data used in joint inversions. The Vs best profiles thus obtained from each joint inversion can be eventually compared, as seen in
Figure 23, whereby the mean profile is also shown. On this regard, it should be noted that the presence of a secondary peak at low frequency along the spectral ratio curve would allow to constrain Vs profiles in depth for some hundred meters (not shown here); however, due to the limited length of the seismic profile (just 67.5 m), the active data cannot sense the materials deeper that approximately 40 m (most of the phase velocity spectra can be used only down to about 4 Hz). Hence, we limit the discussion by considering all the Vs profiles only in the depth range 0–60 m within which the geological setting is enough constrained by boreholes (see geological section in
Figure 21).
The seismic velocity is generally varying as lithology changes in depth (
Figure 2), this was partially expected since surface wave dispersion is indeed capable of precisely depict the soil stiffness variation (i.e., through Vs velocity changes) especially at shallow depths. In particular, the contact between the superficial anthropogenic layer and the underlying very soft clays is marked by an abrupt decrease in Vs from about 300 m/s to 90–100 m/s and also at about 38 m in depth, where the grain size and the degree of consistency of the terrains increase, as the lithology changes from clays to dense sands and silty sands, the Vs values raised up to about 550 m/s (
Figure 23). Note, incidentally, that the retrieved velocity values are in good agreement with those adopted in [
42] for the Seismic Microzonation of the Palatine Hill and surroundings (i.e., including the area subject of this study).
7. Conclusions
The concert of a very famous band hosted at the Circus Maximus in Rome gave the opportunity to analyze the effects of such social events on this archaeological site, which is one of the largest in the world. About 40,000 people attended the event, but even more people were hosted in previous events, such as concerts and sport celebrations, and the site is daily subject to the presence of tourists as well as ambient and traffic-induced vibrations.
Vibrations were recorded before, during, and after the event, on the archaeological ruins and the Torre della Moletta, which are located at the south-east side of the Circus, and also on the ground through single-station noise measurements. The noise recordings were coupled by an active seismic surface waves test for the estimation of the Vs profile.
The spectral analysis allowed pointing out the resonance frequencies and the corresponding modal shapes of the Torre della Moletta, obtained under ambient and traffic-induced vibrations only, as well as the other peaks during the concert.
With reference to the Circus, a dominant frequency at 2.5 Hz is present for all the directions, at all measurement points, even in the presence of traffic only. This resonance frequency is probably related to the presence of buried structures, as confirmed by the significant values of the phase factor and the coherence function in the CSDs between the records at different locations. The buried structures influence the dynamic response of the ground. Both for the tower and the archaeological ruins, the spectral amplitudes become much higher during the concert.
The velocity vibration amplitudes were compared with those suggested by UNI-9916 as limit ones, while those due to traffic-induced vibrations were compared with the maximum ones given by SN640312. The recorded values were always lower than the limit ones, but in some cases they were quite close to them.
The particle motion at the top of the Torre della Moletta, plotted for the three time intervals T, C, and N, pointed out an almost chaotic motion during N and T without a preferential direction of vibration. On the contrary, during the concert, two almost orthogonal preferential directions were evident, with much higher amplitudes.
From an active seismic test, a certain geotechnical complexity in the subsoil emerged: a significant Vs velocity inversion was detected near surface, whose reliability needed to be assessed by means of additional geophysical surveys and direct investigations. It is also clear that the shear waves velocities remain well below 750 m/s on average and never even approached the value 800 m/s, corresponding to the seismic bedrock [
43], which is expected at depths of some hundred meters based on the parametric 1D site response analyses presented in [
44].
One can conclude that significant effects on the structures and ruins of the Circus Maximus were measured during the concert. Rigorously, the results are valid only for this specific case and the particular event, and cannot be generalized easily. Therefore, more detailed investigations are recommended, in general, on the vibrations induced during social events, with the participation of a very high number of people, on this archaeological site. Actually, since several social events are scheduled in the next future, recordings during other concerts will also be obtained. As of now, a suitable model will be set up with the dual purpose of directing the experimental analysis, for example in the selection of the measurements points and in the interpretation of experimental results. This is of particular importance for future use and for the safety of both people and ruins.
Author Contributions
Conceptualization, L.M.P., G.B., P.C., V.D.F., V.V.; methodology, L.M.P., G.B., P.C., V.D.F., V.V.; software, L.M.P., G.B., P.C., V.D.F., V.V.; validation, L.M.P., G.B., P.C., V.D.F., V.V.; formal analysis, L.M.P., G.B., P.C., V.D.F., V.V.; investigation, L.M.P., G.B., P.C., V.D.F., V.V.; resources, L.M.P., G.B., P.C., V.D.F., V.V.; data curation, L.M.P., G.B., P.C., V.D.F., V.V.; writing—original draft preparation, L.M.P., G.B., P.C., V.D.F., V.V.; writing—review and editing, L.M.P., G.B., P.C., V.D.F., V.V.; visualization, L.M.P., G.B., P.C., V.D.F., V.V.; supervision, L.M.P., G.B., P.C., V.D.F., V.V.; project administration, L.M.P., G.B., P.C., V.D.F., V.V.; funding acquisition, G.B., P.C., V.V. All authors have read and agreed to the published version of the manuscript.
Funding
This paper has been prepared in the framework of the European project ARCH—Advancing Resilience of historic areas against Climate-related and other Hazards. This project has received funding from the European Union’s Horizon 2020 research and innovation programme under grant agreement No. 820999. The sole responsibility for the content of this publication lies with the authors. It does not necessarily represent the opinion of the European Union. Neither the EASME nor the European Commission are responsible for any use that may be made of the information contained therein.
Data Availability Statement
The original data can be obtained from the corresponding author.
Acknowledgments
The authors are very grateful to the Superintendence of Cultural Heritage of Roma for allowing this study, and particularly to Maria Letizia Buonfiglio for helpful discussions about the site archaeology and the support during the experimental campaign. The authors also thank Alessandro Colucci and Antonella Paciello of ENEA, and Fernando Ferri and Valerio Ruscito of ISPRA for their helpful contribution in the experimental campaign.
Conflicts of Interest
The authors declare no conflict of interest regarding the publication of this paper.
References
- Clemente, P. Extending the life-span of cultural heritage structures. J. Civ. Struct. Health Monit. 2018, 8, 171–179. [Google Scholar] [CrossRef] [Green Version]
- Clemente, P.; Rinaldis, D. Protection of a monumental building against traffic-induced vibrations. Soil Dyn. Earthq. Eng. 1998, 17, 289–296. [Google Scholar] [CrossRef]
- Clemente, P.; Rinaldis, D.; Buffarini, G. Experimental Seismic Analysis of a Historical Building. J. Intell. Mater. Syst. Struct. 2007, 18, 777–784. [Google Scholar] [CrossRef]
- Clemente, P.; Rinaldis, D. Design of temporary and permanent arrays to assess dynamic parameters in historical and monumental buildings. In Sensing Issues in Civil Structural Health Monitoring; Ansari, F., Ed.; Springer: Dordrecht, The Netherlands, 2005. [Google Scholar] [CrossRef]
- Bongiovanni, G.; Buffarini, G.; Clemente, P.; Saitta, F.; Tripepi, C. Experimental analysis of the Torlonia Building in Avezzano, Italy. In Proceedings of the 7th International Conference on Advances in Experimental Structural Engineering (7AESE), Pavia, Italy, 6–8 September 2017; EUCENTRE Foundation: Pavia, Italy, 2017; pp. 897–909. [Google Scholar] [CrossRef]
- Clemente, P.; Buffarini, G. Dynamic response of buildings of the cultural heritage. In Enciclopedia of Structural Health Monitoring; Boller, C., Chang, F.K., Fujino, Y., Eds.; John Wiley & Sons Ltd.: Chichester, UK, 2009; pp. 2243–2252. [Google Scholar] [CrossRef]
- De Stefano, A.; Clemente, P. Structural health monitoring of historic buildings. In Structural Health Monitoring of Civil Infrastructure Systems; Karbhari, V.M., Ansari, F., Eds.; Woodhead Publishing Ltd.: Sawston, UK, 2009; Volume 13, pp. 412–434. [Google Scholar] [CrossRef]
- De Stefano, A.; Matta, E.; Clemente, P. Structural health monitoring of historical heritage in Italy: Some relevant experiences. J. Civ. Struct. Health Monit. 2016, 6, 83–106. [Google Scholar] [CrossRef]
- Valente, M.; Milani, G. Effects of Geometrical Features on the Seismic Response of Historical Masonry Towers. J. Earthq. Eng. 2018, 22, 2–34. [Google Scholar] [CrossRef]
- Bartoli, G.; Betti, M.; Marra, A.M.; Monchetti, S. On the role played by the openings on the first frequency of historic masonry towers. Bull. Earthq. Eng. 2020, 18, 427–451. [Google Scholar] [CrossRef]
- Bongiovanni, G.; Çelebi, M.; Clemente, P. The flaminio obelisk in Rome: Vibrational characteristics as part of preservation efforts. Earthq. Eng. Struct. Dyn. 1990, 19, 107–118. [Google Scholar] [CrossRef]
- Indirli, M.; Castellano, M.G.; Clemente, P.; Martelli, A. Demo Application of Shape Memory Alloy Devices: The Rehabilitation of S. Giorgio Church in Trignano. Proc. SPIE 2001, 4330, 262–272. [Google Scholar] [CrossRef]
- Bongiovanni, G.; Buffarini, G.; Clemente, P.; Rinaldis, D.; Saitta, F. Experimental vibration analyses of a historic tower structure. J. Civ. Struct. Health Monit. 2017, 7, 601–613. [Google Scholar] [CrossRef]
- Bongiovanni, G.; Buffarini, G.; Clemente, P.; Saitta, F. Time and Frequency Domain Analyses in the Experimental Dynamic Behaviour of the Marcus Aurelius’ Column. Int. J. Archit. Herit. 2021, 15, 64–78. [Google Scholar] [CrossRef]
- Clemente, P.; Saitta, F.; Buffarini, G.; Platania, L. Stability and seismic analyses of leaning towers: The case of the minaret in Jam. Struct. Des. Tall Spéc. Build. 2015, 24, 40–58. [Google Scholar] [CrossRef]
- Clemente, P.; Delmonaco, G.; Puzzilli, L.; Saitta, F. Stability and seismic vulnerability of the Stylite Tower at Umm ar-Rasas. Ann. Geophys. 2019, 62, SE340. [Google Scholar] [CrossRef]
- Clemente, P.; Delmonaco, G.; Puzzilli, L.; Saitta, F. Seismic analysis of the Stylite Tower at Umm ar-Rasas. In Structural Analysis of Historical Constructions; Aguilar, R., Torrealva, D., Moreira, S., Pando, M.A., Ramos, L.F., Eds.; RILEM Bookseries; Springer: Cham, The Netherlands, 2019; Volume 18, pp. 1780–1787. [Google Scholar] [CrossRef]
- Clemente, P.; Hailemikael, S.; Milana, G.; Orlando, L. Preface Special issue: Monitoring and Seismic Characterization of Archaeological Sites and Structures. Ann. Geophys. 2017, 60, S0447. [Google Scholar] [CrossRef]
- Hailemikael, S.; Milana, G.; Cara, F.; Vassallo, M.; Pischiutta, M.; Amoroso, S.; Bordoni, P.; Cantore, L.; Di Giulio, G.; Di Naccio, D.; et al. Sub-surface characterization of the Anphiteatrum Flavium Area (Rome, Italy) through single-station ambient vibration measurements. Ann. Geophys. 2017, 60, S0438. [Google Scholar] [CrossRef] [Green Version]
- Bongiovanni, G.; Buffarini, G.; Clemente, P.; Rinaldis, D.; Saitta, F. Dynamic Characteristics of the Amphitheatrum Flavium northern wall from traffic-induced vibrations. Ann. Geophys. 2017, 60, S0439. [Google Scholar] [CrossRef]
- Lorenzoni, F.; Casarin, F.; Modena, C.; Caldon, M.; Islami, K.; da Porto, F. Structural health monitoring of the Roman Arena of Verona, Italy. J. Civ. Struct. Health Monit. 2013, 3, 227–246. [Google Scholar] [CrossRef]
- Bergamasco, I.; Bongiovanni, G.; Carpani, B.; Clemente, P.; Paciello, A.; Serafini, S. Ambient vibration analysis for the characterization of soil and coverings of Villa dei Misteri in Pompeii. In Proceedings of the Structural Analysis of Historical Constructions, Mexico City, Mexico, 14–17 October 2014; Peña, F., Chávez, M., Eds.; ISBN 04-2014-102011495500-102. [Google Scholar]
- Delmonaco, G.; Puzzilli, L.M.; Traversa, F. Geomechanical and geophysical investigations for sustainable conservation of the Temple of the Winged Lions in Petra (Jordan). In Proceedings of the 7th International Conference on Earthquake Geotechnical Engineering, ICEGE, Rome, Italy, 17–20 June 2019. [Google Scholar]
- Nakamura, Y. A method for Dynamic Characteristics estimation of Subsurface using Microtremor on the Ground Surface. QR RTRI 1989, 30, 25–33. [Google Scholar]
- Ames, C.S. Rome’s seat of passion: An assessment of the archeology and history of the Circus Maximus. Cogent Arts Humanit. 2016, 3, 1168906. [Google Scholar] [CrossRef]
- Humphrey, J. Roman Circuses: Arenas for Chariot Racing, 1st ed.; University of California Press: Berkeley, CA, USA, 1986. [Google Scholar]
- Buffarini, G.; Clemente, P.; Paciello, A.; Rinaldis, D. The Lateran Obelisk: Experimental analysis and modelling. In Protection of Historical Buildings, Proceedings of the International Conference PROHITECH 09 Rome, Italy, 21–24 June 2009; Mazzolani, F.M., Ed.; Taylor & Francis Group: London, UK, 2009; Volume 1, pp. 841–848. ISBN 978-0-415-55803-7. [Google Scholar]
- UNI 9916. Criteria for the Measurement of Vibrations and the Assessment of Their Effects on Buildings; Italian code; UNI: Milan, Italy, 2004. [Google Scholar]
- SN 640312a. Vibrations—Vibration Effects in Buildings; Swiss Standards: Zürich, Switzerland, 2013. [Google Scholar]
- Signorini, R. Risultati geologici della perforazione eseguita dall’AGIP alla mostra autarchica del minerale nel Circo Massimo di Roma. Boll. Soc. Geol. Ital. 1939, 58, 60–63. (In Italian) [Google Scholar]
- Chiocchini, U.; Savarese, G. Review of the stratigraphic record of the borehole Circus Maximus, Rome. Rend. Online Soc. Geol. Ital. 2017, 43, 17–22. [Google Scholar] [CrossRef]
- Marra, F.; Florindo, F.; Anzidei, M.; Sepe, V. Paleo-surfaces of glacio-eustatically forced aggradational successions in the coastal area of Rome: Assessing interplay between tectonics and sea-level during the last ten interglacials. Quat. Sci. Rev. 2016, 148, 85–100. [Google Scholar] [CrossRef]
- Marra, F.; Motta, L.; Brock, A.; Macrì, P.; Florindo, F.; Sadori, L.; Terrenato, N. Rome in its setting. Post-glacial aggradation history of the Tiber River alluvial deposits and tectonic origin of the Tiber Island. PLoS ONE 2018, 13, e0194838. [Google Scholar] [CrossRef] [PubMed] [Green Version]
- Foti, S.; Hollender, F.; Garofalo, F.; Albarello, D.; Asten, M.; Bard, P.-Y.; Comina, C.; Cornou, C.; Cox, B.; Di Giulio, G.; et al. Guidelines for the good practice of surface wave analysis: A product of the InterPACIFIC project. Bull. Earthq. Eng. 2017, 16, 2367–2420. [Google Scholar] [CrossRef]
- Dal Moro, G. Surface Wave Analysis for Near Surface Applications; Elsevier: Amsterdam, The Netherlands, 2014. [Google Scholar]
- Konno, K.; Ohmachi, T. Ground-motion characteristics estimated from spectral ratio between horizontal and vertical components of microtremor. Bull. Seismol. Soc. Am. 1998, 88, 228–241. [Google Scholar] [CrossRef]
- Marcucci, S.; Milana, G.; Hailemikael, S.; Carlucci, G.; Cara, F.; Di Giulio, G.; Vassallo, M. The Deep Bedrock in Rome, Italy: A New Constraint Based on Passive Seismic Data Analysis. Pure Appl. Geophys. 2019, 176, 2395–2410. [Google Scholar] [CrossRef]
- Park, C.B.; Miller, R.D.; Xia, J. Multichannel analysis of surface waves. Geophysics 1999, 64, 800–808. [Google Scholar] [CrossRef] [Green Version]
- Moro, G.D. Surface wave analysis: Improving the accuracy of the shear-wave velocity profile through the efficient joint acquisition and Full Velocity Spectrum (FVS) analysis of Rayleigh and Love waves. Explor. Geophys. 2019, 50, 408–419. [Google Scholar] [CrossRef]
- Moro, G.D.; Al-Arifi, N.; Moustafa, S.S.R. Analysis of Rayleigh-Wave Particle Motion from Active Seismics. Bull. Seismol. Soc. Am. 2016, 107, 51–62. [Google Scholar] [CrossRef]
- Moro, G.D.; Moustafa, S.S.R.; Al-Arifi, N. Improved Holistic Analysis of Rayleigh Waves for Single- and Multi-Offset Data: Joint Inversion of Rayleigh-Wave Particle Motion and Vertical- and Radial-Component Velocity Spectra. Pure Appl. Geophys. 2017, 175, 67–88. [Google Scholar] [CrossRef] [Green Version]
- Mancini, M.; Marini, M.; Moscatelli, M.; Pagliaroli, A.; Stigliano, F.; Di Salvo, C.; Simionato, M.; Cavinato, G.; Corazza, A. A physical stratigraphy model for seismic microzonation of the Central Archaeological Area of Rome (Italy). Bull. Earthq. Eng. 2014, 12, 1339–1363. [Google Scholar] [CrossRef]
- SM Working Group. Guidelines for Seismic Microzonation; Conference of the Italian Regions and Autonomous Provinces—Civil Protection Department: Rome, Italy, 2015. [Google Scholar]
- Pagliaroli, A.; Quadrio, B.; Lanzo, G.; Sanò, T. Numerical modelling of site effects in the Palatine Hill, Roman Forum, and Coliseum Archaeological Area. Bull. Earthq. Eng. 2013, 12, 1383–1403. [Google Scholar] [CrossRef]
Figure 2.
View of the south-east side with the ruins and the Torre della Moletta.
Figure 2.
View of the south-east side with the ruins and the Torre della Moletta.
Figure 3.
Schematic view of the original structure (courtesy of the Superintendence) and present structure.
Figure 3.
Schematic view of the original structure (courtesy of the Superintendence) and present structure.
Figure 5.
Time histories recorded at the base (S02x) and at the top (S04x) of the Torre della Moletta in the x direction.
Figure 5.
Time histories recorded at the base (S02x) and at the top (S04x) of the Torre della Moletta in the x direction.
Figure 6.
PSDs of the recordings on the Moletta Tower for the entire time length.
Figure 6.
PSDs of the recordings on the Moletta Tower for the entire time length.
Figure 7.
PSDs of the recordings on the ground for the entire time length.
Figure 7.
PSDs of the recordings on the ground for the entire time length.
Figure 8.
Energy and first resonance frequency in the three directions at S02, S05, and S09.
Figure 8.
Energy and first resonance frequency in the three directions at S02, S05, and S09.
Figure 9.
PSDs in the three directions (at S02, S03, and S04) for the three time intervals (T, C, and N).
Figure 9.
PSDs in the three directions (at S02, S03, and S04) for the three time intervals (T, C, and N).
Figure 10.
Torre della Moletta: CSDs for the three intervals T, C, and N.
Figure 10.
Torre della Moletta: CSDs for the three intervals T, C, and N.
Figure 11.
Circus: PSDs in the three directions for the three intervals.
Figure 11.
Circus: PSDs in the three directions for the three intervals.
Figure 12.
Ratios between the spectra during T and N.
Figure 12.
Ratios between the spectra during T and N.
Figure 13.
Ratios between the spectra during C and N.
Figure 13.
Ratios between the spectra during C and N.
Figure 14.
Circus: Horizontal spectra rotate at S02, S05, and S09 in C.
Figure 14.
Circus: Horizontal spectra rotate at S02, S05, and S09 in C.
Figure 15.
Circus: CSDs S02z–S05z and S02z–S09z for the three time intervals.
Figure 15.
Circus: CSDs S02z–S05z and S02z–S09z for the three time intervals.
Figure 16.
Circus: HVRS at S02, S05, and S09 in T, C, and N.
Figure 16.
Circus: HVRS at S02, S05, and S09 in T, C, and N.
Figure 17.
Particle motions at the top of the Torre della Moletta in T, C, and N (amplitude in mm).
Figure 17.
Particle motions at the top of the Torre della Moletta in T, C, and N (amplitude in mm).
Figure 18.
Torre della Moletta: the maximum velocity in the three time intervals.
Figure 18.
Torre della Moletta: the maximum velocity in the three time intervals.
Figure 19.
Time histories at S02y in the three time intervals (T, C, and N).
Figure 19.
Time histories at S02y in the three time intervals (T, C, and N).
Figure 20.
Circus: maximum velocity in the three time intervals.
Figure 20.
Circus: maximum velocity in the three time intervals.
Figure 21.
Borehole data projected along the trace of section crossing SW-NE in the study area.
Figure 21.
Borehole data projected along the trace of section crossing SW-NE in the study area.
Figure 22.
Summary of the mean spectral ratio curves obtained at the seven sites.
Figure 22.
Summary of the mean spectral ratio curves obtained at the seven sites.
Figure 23.
Shear waves velocity profiles up to 60 m and the S2 stratigraphic log.
Figure 23.
Shear waves velocity profiles up to 60 m and the S2 stratigraphic log.
Table 2.
Data acquisition parameters (spacing = 2.5 m, sampling rate = 0.00025 s, recording time = 1.5 s, impact source = 8 kg sledgehammer, ZVF = Z-vertical receiver/vertical impact force; RVF = radial horizontal receiver/vertical impact force, THF = transversal horizontal receiver/horizontal Force [
35]).
| File ID | Geophone Type | Shot Position (m) | Impact Source
Direction | Dispersion Type | Stack (n) |
|---|
| ZVF1 | Vertical | −10 | Vertical | ZVF | 6 |
| ZVF2 | Vertical | −5 | Vertical | ZVF | 5 |
| ZVF3 | Vertical | 62.5 | Vertical | ZVF | 9 |
| ZVF4 | Vertical | 67.5 | Vertical | ZVF | 9 |
| RVF5 | Horizontal | −5 | Vertical | RVF | 12 |
| RVF6 | Horizontal | 67.5 | Vertical | RVF | 9 |
| THF7 | Horizontal | −5 | Transversal | THF | 9 |
| THF8 | Horizontal | 67.5 | Transversal | THF | 5 |
Table 3.
Data used during joint inversion step (refer to
Table 1 for abbreviations).
Table 3.
Data used during joint inversion step (refer to
Table 1 for abbreviations).
| ID | 1st | 2nd | 3rd |
|---|
| 1 | RVF 6 | ZVF 4 | RPM64 |
| 2 | RVF 5 | ZVF 2 | RPM52 |
| 3 | THF 7 | ZVF 2 | |
| 4 | THF 8 | RVF 4 | |
| 5 | RVF 5 | HVSR | |
| 6 | THF 8 | HVSR | |
| 7 | ZVF 1 | HVSR | |
| 8 | RVF 6 | HVSR | |
| Publisher’s Note: MDPI stays neutral with regard to jurisdictional claims in published maps and institutional affiliations. |
© 2021 by the authors. Licensee MDPI, Basel, Switzerland. This article is an open access article distributed under the terms and conditions of the Creative Commons Attribution (CC BY) license (https://creativecommons.org/licenses/by/4.0/).


 ,
, 


