Fatigue behaviour of composite tubes under multiaxial loading
Fatigue behaviour of composite tubes under multiaxial loading
Fatigue behaviour of composite tubes under multiaxial loading

Create successful ePaper yourself
Turn your PDF publications into a flip-book with our unique Google optimized e-Paper software.
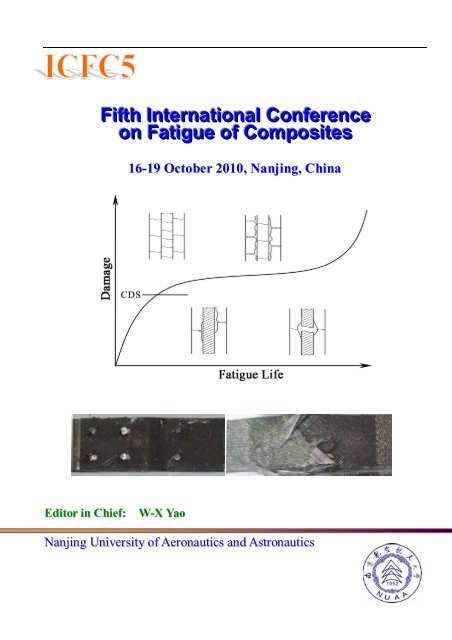
Fiifth IInternatiionall Conference<br />
on Fatiigue <strong>of</strong> Composiites<br />
Editor in Chief: W-X Yao<br />
16-19 October 2010, Nanjing, China<br />
Nanjing University <strong>of</strong> Aeronautics and Astronautics
Contents<br />
<strong>Fatigue</strong> <strong>behaviour</strong> <strong>of</strong> <strong>composite</strong> <strong>tubes</strong> <strong>under</strong> <strong>multiaxial</strong> <strong>loading</strong> ............................................................ 1<br />
M Quaresimin, R Talreja<br />
Damage mechanism and fatigue <strong>behaviour</strong> <strong>of</strong> uniaxially and sequentially loaded wound tube<br />
specimens ......................................................................................................................................................... 8<br />
Frank Schmidt, Peter Horst<br />
An effective method for P-S-N curve fitting <strong>of</strong> <strong>composite</strong> laminates ................................................... 21<br />
D Guan, Q Sun<br />
Constant <strong>Fatigue</strong> Life Diagrams for a Woven CFRP Laminate at Room and High Temperatures 25<br />
M Kawai, Y Matuda, R Yoshimura, H Hoshi, Y Iwahori<br />
Effect <strong>of</strong> stress ratio on fatigue transverse cracking in a CFRP laminate ........................................... 44<br />
K Ogi, R Kitahara, M Takahashi, S Yashiro<br />
<strong>Fatigue</strong> damage characterisation for wind turbine blade GFRPs using computed tomography .... 54<br />
J Lambert, A R Chambers, I Sinclair, S M Spearing<br />
Cyclic interlaminar crack growth in unidirectional and braided <strong>composite</strong>s .................................... 63<br />
S Stelzer, G Pinter, M Wolfahrt, A J Brunner, J Noisternig<br />
Effect <strong>of</strong> Water Uptake on the <strong>Fatigue</strong> Behavior <strong>of</strong> a Quasi-Isotropic Woven Fabric<br />
Carbon/Epoxy Laminate at Different Stress Ratios ............................................................................... 76<br />
M Kawai, Y Yagihashi, H Hoshi, Y Iwahori<br />
Influence <strong>of</strong> thermal and mechanical cycles on the damping <strong>behaviour</strong> <strong>of</strong> Mg<br />
based-nano<strong>composite</strong> ................................................................................................................................... 94<br />
Z Trojanová, A Makowska-Mielczarek, W Riehemann, P Lukáč<br />
Delamination during fatigue testing on carbon fiber fabrics reinforced PPS laminates ................ 103<br />
J Bassery, J Renard<br />
A residual stiffness – residual strength coupled model for <strong>composite</strong> laminate <strong>under</strong> fatigue<br />
<strong>loading</strong> .......................................................................................................................................................... 131<br />
W Lian<br />
An Innovative Energy-Based <strong>Fatigue</strong> Approach for Composites Combining Failure Mechanisms,<br />
Strength and Stiffness Degradation ......................................................................................................... 147<br />
H Krüger, R Rolfes, E Jansen<br />
Experimental characterization and analytical modeling <strong>of</strong> material non-linearity in fatigue<br />
analysis <strong>of</strong> polymer matrix <strong>composite</strong>s ................................................................................................... 158<br />
M Magin, N Himmel<br />
Calorimetric Analysis <strong>of</strong> dissipative Effects associated with the <strong>Fatigue</strong> <strong>of</strong> GFRP Composites.... 161<br />
H Sawadogo, S Panier, S Hariri<br />
<strong>Fatigue</strong>-driven Residual Life Models Based on Controlling <strong>Fatigue</strong> Stress and Strain in Carbon<br />
Fibre/Epoxy Composites............................................................................................................................ 172<br />
J J Xiong, J B Bai, R A Shenoi<br />
Prediction <strong>of</strong> transverse crack initiation <strong>of</strong> CFRP laminates <strong>under</strong> fatigue <strong>loading</strong> ....................... 186
A Hosoi, K Takamura, N Sato, H Kawada<br />
Interfacial <strong>Fatigue</strong> Crack Propagation in Microscopic Model Composite using Bifiber Shear<br />
Specimen ...................................................................................................................................................... 194<br />
M Hojo, Y Matsushita, M Tanaka, T Adachi<br />
Experimental analysis and modelling <strong>of</strong> fatigue <strong>behaviour</strong> <strong>of</strong> thick woven laminated <strong>composite</strong>s<br />
....................................................................................................................................................................... 209<br />
P Nimdum, J Renard<br />
<strong>Fatigue</strong> life assessment via ply-by-ply stress analysis <strong>under</strong> biaxial <strong>loading</strong> .................................... 230<br />
F Schmidt, T J Adam, P Horst<br />
<strong>Fatigue</strong> Damage initiation <strong>of</strong> a PA66/glass fibers <strong>composite</strong> material ............................................... 241<br />
B Esmaeillou, P Fereirra, V Bellenger, A Tcharkhtchi<br />
<strong>Fatigue</strong> life prediction <strong>of</strong> <strong>of</strong>f-axis unidirectional laminate................................................................... 250<br />
F Q Wu, W X Yao<br />
Post-Impact <strong>Fatigue</strong> Damage Monitoring using Fiber Bragg Grating Sensors ............................... 264<br />
C S Shin, S W Yang<br />
Delamination detection in CFRP laminates using A0 and S0 Lamb wave modes ............................. 273<br />
N Hu, Y L Liu, H Fukunaga, Y Li<br />
Effect <strong>of</strong> Temperature on <strong>Fatigue</strong> behavior in nylon 6-clay hybrid nano<strong>composite</strong>s ...................... 288<br />
S J Zhu, M Kichise, A Usuki, M Kato<br />
<strong>Fatigue</strong> Behavior <strong>of</strong> Unidirectional Jute Spun Yarn Reinforced PLA ............................................... 291<br />
H Katogi, Y Shimamura, K Tohgo, T Fujii<br />
An evaluation on thermal shock fatigue damage <strong>of</strong> SiC <strong>composite</strong> using nondestructive technique<br />
....................................................................................................................................................................... 302<br />
J K Lee, S P Lee, J H Byun<br />
Fabrication <strong>of</strong> ti/apc-2 nano<strong>composite</strong> laminates and their fatigue response at elevated<br />
temperature ................................................................................................................................................. 308<br />
M-H R Jen, Y-C Sung, C-K Chang, F-C Hsu<br />
<strong>Fatigue</strong> and Fracture <strong>of</strong> Elastomeric Matrix Nano<strong>composite</strong>s ........................................................... 317<br />
C Bathias, S Y Dong<br />
Correlation between crack propagation rate and cure process <strong>of</strong> epoxy resins ............................... 327<br />
V Trappe, S Günzel<br />
Thermal fatigue <strong>of</strong> AX41 magnesium alloy based <strong>composite</strong> studied using thermal expansivity<br />
measurements.............................................................................................................................................. 331<br />
Z Drozd, Z Trojanová, P Lukáč<br />
<strong>Fatigue</strong> <strong>behaviour</strong> <strong>of</strong> woven <strong>composite</strong> joint ...................................................................................... 339<br />
J Y Zhang, Y Fu, L B Zhao, X Z Liang, H Huang, B J Fei<br />
Damage in thermoplastic <strong>composite</strong> structures: application to high pressure hydrogen storage<br />
vessels ........................................................................................................................................................... 355<br />
C Thomas, F Nony, S Villalonga, J Renard<br />
Residual life predictions <strong>of</strong> repaired fatigue cracks.............................................................................. 367<br />
H Wu, A Imad, N Benseddi<br />
Monotonic and cyclic deformation behavior <strong>of</strong> ultrasonically welded hybrid joints between light
metals and carbon fiber reinforced polymers (CFRP) ......................................................................... 376<br />
F Balle, D Eifler
<strong>Fatigue</strong> <strong>behaviour</strong> <strong>of</strong> <strong>composite</strong> <strong>tubes</strong> <strong>under</strong> <strong>multiaxial</strong> <strong>loading</strong><br />
Abstract<br />
M Quaresimin a, *, R Talreja b<br />
a Department <strong>of</strong> Management and Engineering - University <strong>of</strong> Padova, Stradella S. Nicola, 3 36100 Vicenza, ITALY<br />
b Department <strong>of</strong> Aerospace Engineering, Texas A&M University, College Station, Texas 77843, USA<br />
The paper illustrates the results <strong>of</strong> an extensive investigation on the damage evolution in <strong>composite</strong> glass/epoxy <strong>tubes</strong><br />
subjected cyclic tension-torsion <strong>loading</strong>. S-N fatigue curve, stiffness trends and microscopic damage evolution for<br />
different values <strong>of</strong> biaxiality ratio are discussed.<br />
1. Introduction<br />
In spite <strong>of</strong> its importance in the design <strong>of</strong> structural components that are subjected to complex load<br />
histories with variability <strong>of</strong> <strong>loading</strong> direction and intensity, the fatigue <strong>behaviour</strong> <strong>of</strong> <strong>composite</strong> materials<br />
<strong>under</strong> <strong>multiaxial</strong> <strong>loading</strong> has received only little attention by the scientific community. A recent<br />
review by the authors, [1], indicated the deep lack <strong>of</strong> information about the damage evolution during the<br />
fatigue life: only few papers in fact report quantitative analysis and damage growth data [2], qualitative<br />
information and stiffness trends can be found in [3-7]. A strong influence <strong>of</strong> the shear stress on the<br />
<strong>multiaxial</strong> fatigue strength was also shown. Eventually, the analysis <strong>of</strong> reliability <strong>of</strong> some criteria<br />
available for life prediction, done again in [1], clearly suggested the need <strong>of</strong> a physically based model<br />
suitable to describe and account for the actual fatigue damage.<br />
This paper illustrates the preliminary experimental results <strong>of</strong> a project aimed at investigating the<br />
problem through the following steps: study <strong>of</strong> fatigue damage evolution <strong>under</strong> <strong>multiaxial</strong> <strong>loading</strong><br />
conditions, analysis <strong>of</strong> the mutual influence <strong>of</strong> the stress components and <strong>under</strong>standing <strong>of</strong> the<br />
associated damage mechanisms and, eventually, development <strong>of</strong> a life prediction model suitable to<br />
incorporate these mechanisms.<br />
2. Materials and specimens<br />
Tubular samples to be tested <strong>under</strong> combined tension-torsion <strong>loading</strong> were considered as the optimum<br />
solution to avoid free-edge effects on the damage evolution. Moreover by varying the ratio between<br />
external tension and torsion <strong>loading</strong> the mutual influence <strong>of</strong> the stress components on the damage<br />
evolution can be investigated. Samples were produced by wrapping <strong>of</strong> 4 layers <strong>of</strong> glass/epoxy UD<br />
pre-pregs at 90 o with respect to the longitudinal axis and then autoclave moulding. To compare the use<br />
<strong>of</strong> different alternative clamping set-ups, <strong>tubes</strong> with different external diameter (38 mm or 22 mm) and<br />
* Corresponding author.<br />
E-mail address: marino.quaresimin@unipd.it
2<br />
Fifth International Conference on <strong>Fatigue</strong> <strong>of</strong> Composites<br />
the same thickness (1.5 mm) were produced. Samples with a different lay-up were also manufactured,<br />
by replacing the inner layer <strong>of</strong> UD tape with a balanced fabric layer. In this way, the initial [90]4 lay-up<br />
became [0T/90UD,3]. The [90]4 lay-up allowed us to quantify the influence <strong>of</strong> the shear stress component<br />
on the transverse fatigue strength, in the absence <strong>of</strong> the longitudinal (fiber-direction) stress. The<br />
[0T/90UD,3] facilitated instead a stable and measurable growth <strong>of</strong> the fatigue damage. The following<br />
prepregs were considered: UD tape UE400-REM produced by SEAL-Italy, area weight = 645 g/m 2 ,<br />
Balanced fabric VV345T-DT107A produced by Deltatech-Italy, area weight 345 g/m 2 ).<br />
3. Experimental testing and damage investigation<br />
The tensile properties <strong>of</strong> the prepregs used for manufacturing the <strong>tubes</strong> were first measured by testing<br />
flat coupons <strong>under</strong> tension <strong>loading</strong>. The average values <strong>of</strong> elastic and strength properties measured for<br />
the UD and fabric tape are summarised in table 1.<br />
The <strong>multiaxial</strong> fatigue <strong>behaviour</strong> <strong>of</strong> the <strong>tubes</strong> was investigated by means <strong>of</strong> pulsating tension- torsion<br />
fatigue <strong>loading</strong>. <strong>Fatigue</strong> tests were carried out on a MTS 809 axial-torsional machine, <strong>under</strong><br />
load/torque control at a frequency <strong>of</strong> 10 Hz. S-N fatigue curves for [90]4 <strong>tubes</strong> are shown in figure 1,<br />
for pure tensile <strong>loading</strong> and for biaxiality ratio 12 (6/2) equal to 1.0 and 2.0.<br />
Table 1. Average in-plane properties <strong>of</strong> the materials used for <strong>tubes</strong> manufacturing<br />
EL (MPa) ET (MPa) GLT (MPa) LT L (MPa) T (MPa) LT (MPa)<br />
UD400-REM 34860 9419 3193 0.326 973 50 98<br />
VV345T-DT107A 21700 20800 3351 0.159 448 431 85<br />
Fig. 1. <strong>Fatigue</strong> results for [90]4 glass/epoxy <strong>tubes</strong> <strong>under</strong> tension (12=0) and tension-torsion <strong>loading</strong> (12= 1 and 2) (L denotes tube <strong>of</strong> 38 mm<br />
external diameter, S for 22 mm external diameter; thickness= 1.5 mm).<br />
The presence <strong>of</strong> a shear stress component turned out to have indeed a significant influence, with a<br />
40% drop in the fatigue strength at 2 million cycles for a biaxiality ratio equal to 2 .<br />
As shown again in figure 1, <strong>tubes</strong> with 38 or 22 mm diameter turned out to behave similarly and<br />
therefore it was decided to continue testing with the smaller diameter <strong>tubes</strong> which can be clamped
M Quaresimin, R Talreja / <strong>Fatigue</strong> <strong>behaviour</strong> <strong>of</strong> <strong>composite</strong> <strong>tubes</strong> <strong>under</strong> <strong>multiaxial</strong> <strong>loading</strong><br />
directly by the hydraulic grips <strong>of</strong> the testing machine (see figure 2).<br />
Figure 2 shows the specimen mounted on the axial-torsional testing system as well as the internal<br />
LED light illumination built up to investigate the damage evolution and, in particular, the crack onset<br />
and growth. This is made possible by the transparency <strong>of</strong> the glass-epoxy <strong>tubes</strong>.<br />
Fig. 2. Testing set-up and details <strong>of</strong> the internal lighting <strong>of</strong> <strong>tubes</strong> for observation <strong>of</strong> damage. Example <strong>of</strong> multiple cracking in a [0T/90U,3] tube.<br />
During the testing <strong>of</strong> [90]4 <strong>tubes</strong> the absence <strong>of</strong> stable crack propagation was observed, with cracks<br />
nucleating and propagating almost instantaneously (few cycles) to the whole section <strong>of</strong> the sample,<br />
causing the complete separation into two parts. This <strong>behaviour</strong> could be expected due to the particular<br />
lay-up investigated and was clearly indicated even by the sample stiffness. In fact, both axial and<br />
torsional stiffness were found not to change significantly during the fatigue life <strong>of</strong> the samples, showing<br />
a sudden drop only close to the final failure. Therefore from these tests we can derive only the influence<br />
<strong>of</strong> the shear stress component on the transverse fatigue strength. However, the change <strong>of</strong> the slope <strong>of</strong><br />
fatigue curves shown in figure 1 seems to suggests a change in the damage mechanics as the shear stress<br />
increases. Further data are indeed needed to clarify this situation and also to increase the statistical<br />
significance <strong>of</strong> the results, in particular at high number <strong>of</strong> cycles.<br />
It still remains to identify how the damage evolves during the fatigue life <strong>of</strong> the <strong>tubes</strong>. Under pure<br />
tension a crack nucleates after a certain number <strong>of</strong> cycles and then grows <strong>under</strong> pure mode I condition.<br />
The simultaneous presence <strong>of</strong> shear stress together with the transverse stress changes the scenario<br />
completely and one can speculate that the crack nucleates at the external surface and then propagates to<br />
the inner surface <strong>under</strong> I + III mixed mode <strong>loading</strong>. Then the crack grows along the <strong>tubes</strong> circumference<br />
<strong>under</strong> I + II mixed mode condition, as sketched in figure 3. In view <strong>of</strong> modeling this damage evolution<br />
it is important to verify and quantify these speculations and this can be done experimentally only<br />
slowing down the crack initiation and growth process.<br />
3
4<br />
Fifth International Conference on <strong>Fatigue</strong> <strong>of</strong> Composites<br />
Fig. 3. Schematic <strong>of</strong> the damage process in a [0F/903UD] tube <strong>under</strong> tension-torsion <strong>loading</strong>.<br />
Thus, in the attempt to better investigate the damage evolution it was decided to slightly change the<br />
lay-up from [90]4 to [0T/90U,3]. As said before, the [0T/90U,3] lay-up facilitates a stable growth <strong>of</strong> the<br />
damage, suitable to be observed, measured and, eventually, correlated with the applied stress-state. In<br />
this configuration, the limited amount <strong>of</strong> longitudinal fibers provided enough strength to let the<br />
transverse cracks to nucleate and growth reasonably slowly during the sample fatigue life. Examples<br />
<strong>of</strong> cracks identified on the samples are shown in figure 2, 4 and 5. From figure 2 and 4 it is rather clear<br />
that the internal led light system works pretty well in showing the presence <strong>of</strong> the cracks. For the<br />
[0T/90U,3] <strong>tubes</strong>, the cracking process can be tracked even on axial stiffness curve, where rather evident<br />
drops can be identified in correspondence <strong>of</strong> the nucleation and growth <strong>of</strong> transversal cracks.<br />
Fig. 4. [0T/90U,3] glass/epoxy tube after failure <strong>under</strong> tension-torsion fatigue <strong>loading</strong> (12=2). Internal light makes the transverse cracks outside the<br />
failure zone clearly visible.<br />
Fig. 5. Micrographs <strong>of</strong> longitudinal sections <strong>of</strong> the [0T/90U,3] glass/epoxy tube shown in fig. 3.
M Quaresimin, R Talreja / <strong>Fatigue</strong> <strong>behaviour</strong> <strong>of</strong> <strong>composite</strong> <strong>tubes</strong> <strong>under</strong> <strong>multiaxial</strong> <strong>loading</strong><br />
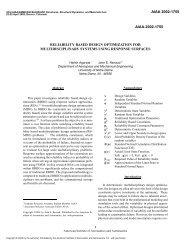
Figure 6 shows the fatigue curves for the [0F/903UD] <strong>tubes</strong>. To allow a comparison with the previous<br />
results on [90]4 <strong>tubes</strong> to be made, the life to initiation <strong>of</strong> the first crack was taken as reference.<br />
Although the <strong>behaviour</strong> <strong>under</strong> pure tension needs to be further clarified, the effect <strong>of</strong> the shear stress on<br />
the fatigue life is comparable with that shown in figure 1 and this may suggest a similar damage<br />
scenario in the two cases. With this new [0F/903UD] lay-up it was possible to monitor the evolution <strong>of</strong> the<br />
damage during the fatigue life. This was done by taking again advantage <strong>of</strong> the internal light system and<br />
visually observing by naked eyes the samples during testing. For the longer tests, a continuous digital<br />
acquisition system controlled by a in-house developed Labview tool was used.<br />
<strong>tubes</strong> with one inner layer <strong>of</strong> fabric and three layer <strong>of</strong> 90 UD Tapes<br />
transverse stress 2 in 90°plies [MPa]<br />
50<br />
45<br />
40<br />
35<br />
30<br />
25<br />
20<br />
15<br />
10<br />
5<br />
10 100 1000 10000 100000 1000000 10000000<br />
cycles for nucleation <strong>of</strong> the first visible crack<br />
12=0<br />
12=05<br />
12=1<br />
12=2<br />
L.<br />
(12=05)<br />
L.<br />
(12=1)<br />
L.<br />
(12=0)<br />
L.<br />
(12=2)<br />
Fig. 6. <strong>Fatigue</strong> results for [0F/903UD] glass/epoxy <strong>tubes</strong> <strong>under</strong> tension (12=0) and tension-torsion <strong>loading</strong> (12= 0.5, 1 and 2).<br />
With reference to figure 3, it can be confirmed first <strong>of</strong> all that the hypothesis made on the damage<br />
onset and evolution was correct: the cracks actually nucleated at the external surface, propagated to the<br />
inner radius and then grew along the tube circumference. However the fraction <strong>of</strong> fatigue life spent in<br />
the different phases is rather different: in fact, the onset and propagation <strong>under</strong> Mode I+ Mode III is, in<br />
general, very fast when compared to the lower circumferential growth.<br />
°<br />
N = 350 cycles<br />
x<br />
y<br />
z<br />
N = 500 cycles<br />
α<br />
z<br />
y<br />
α = 33°<br />
ΔN = 150 cycles<br />
β<br />
N = 1350 cycles<br />
z<br />
y<br />
α = 30°<br />
ΔN = 850 cycles<br />
5
6<br />
β<br />
N = 1800 cycles<br />
z<br />
y<br />
α = 117°<br />
ΔN = 450 cycles<br />
N = 7100 cycles<br />
α<br />
z<br />
y<br />
α = 21° / β = 13°<br />
ΔN = 2600 cycles<br />
α<br />
Fifth International Conference on <strong>Fatigue</strong> <strong>of</strong> Composites<br />
α<br />
N = 2200 cycles<br />
z<br />
y<br />
α = 39°<br />
ΔN = 400 cycles<br />
N = 7787 cycles<br />
z<br />
y<br />
α = 95°<br />
ΔN = 687 cycles<br />
α<br />
N = 4500 cycles<br />
z<br />
y<br />
α<br />
α = 12°<br />
ΔN = 2300 cycles<br />
Fig. 7. Crack growth during the fatigue life <strong>of</strong> a [0F/903UD] tube <strong>under</strong> tension-torsion <strong>loading</strong> (12 = 1, transverse stress 2= 30 MPa).<br />
An example <strong>of</strong> the complete evolution for one <strong>of</strong> the cracks observed and measured during their<br />
growth is reported in figure 7.<br />
crack growth [degrees]<br />
360<br />
315<br />
270<br />
225<br />
180<br />
135<br />
90<br />
45<br />
0<br />
0 10000 20000 30000 40000 50000 60000 70000<br />
number <strong>of</strong> cycles <strong>of</strong> crack propagation<br />
12=0<br />
12=0.5<br />
12=1<br />
12=2<br />
Fig. 8. Crack growth data for [0F/903UD] <strong>tubes</strong> <strong>under</strong> tension-torsion <strong>loading</strong> (nominal tensile stress= 30 MPa).<br />
Being now available the crack "length" (measured in degrees <strong>of</strong> propagation along the tube<br />
circumference) against the number <strong>of</strong> cycles it is possible to assess the possible influence <strong>of</strong> the
M Quaresimin, R Talreja / <strong>Fatigue</strong> <strong>behaviour</strong> <strong>of</strong> <strong>composite</strong> <strong>tubes</strong> <strong>under</strong> <strong>multiaxial</strong> <strong>loading</strong><br />
<strong>multiaxial</strong> <strong>loading</strong> conditions on the crack growth rate. This is made, for the data available so far, in<br />
figure 8 where crack propagation data for pure tension and tension/torsion tests are plotted. All the tests<br />
were done with the same external tensile stress (30 MPa) and progressively increasing the shear stress<br />
from 0 to 60 MPa. The effect <strong>of</strong> the shear stress in accelerating the growth <strong>of</strong> the cracks along the tube<br />
circumference is still dramatically evident.<br />
4. Conclusions<br />
The results <strong>of</strong> an experimental investigation on the fatigue <strong>behaviour</strong> <strong>of</strong> glass/epoxy <strong>tubes</strong> <strong>under</strong><br />
cyclic tension-torsion <strong>loading</strong> has been presented and discussed. The shear stress components associated<br />
to the torsion load (quantified by the biaxiality ratio 12) was found to have a dramatic influence on the<br />
fatigue strength <strong>of</strong> [90]4 and [0T/90U,3] <strong>tubes</strong>, with a reduction in the high cycle fatigue strength up to<br />
40% in the case <strong>of</strong> the [90]4 <strong>tubes</strong>. The slower rate <strong>of</strong> damage propagation obtained for [0T/90U,3] <strong>tubes</strong><br />
allowed the monitoring <strong>of</strong> the damage evolution to be made. Even the crack growth rate turned out to be<br />
affected by the shear stress, with a significant increase in the average rate <strong>of</strong> crack propagation as the<br />
shear stress increased.<br />
References<br />
[1] Quaresimin M., Susmel L., Talreja R., <strong>Fatigue</strong> <strong>behaviour</strong> and life assessment <strong>of</strong> <strong>composite</strong> laminates <strong>under</strong> <strong>multiaxial</strong> <strong>loading</strong>s,<br />
International Journal <strong>of</strong> <strong>Fatigue</strong>, 32, 2-16, 2010.<br />
[2] Adden S, Horst P. Damage propagation in non-crimp fabrics <strong>under</strong> bi-axial static and fatigue <strong>loading</strong>. Composites Science and Technology<br />
33, 626-633, 2006.<br />
[3] Smith E. W., Pascoe K. J., Biaxial fatigue <strong>of</strong> glass-fibre reinforced <strong>composite</strong>. Part 1: fatigue and fracture <strong>behaviour</strong>. Biaxial and<br />
Multiaxial <strong>Fatigue</strong>, Edited by M. Brown and K. J. Miller, EGF 3, Mechanical Engineering Publications, London 1989: 367-396.<br />
[4] Takemura K., Fujii T. <strong>Fatigue</strong> strength and damage progression in a circular-hole-notched GRP <strong>composite</strong> <strong>under</strong> combined tension/torsion<br />
<strong>loading</strong>. Composites Science and Technology, 52, 519-526, 1994.<br />
[5] Fujii T., Lin F. <strong>Fatigue</strong> behavior <strong>of</strong> a plain-woven glass fabric laminate <strong>under</strong> tension/torsion biaxial <strong>loading</strong> Journal <strong>of</strong> Composite<br />
Materials 29, 573-590, 1995.<br />
[6] Kawakami H., Fujii T., Morita Y. <strong>Fatigue</strong> degradation and life prediction <strong>of</strong> glass fabric polymer <strong>composite</strong> <strong>under</strong> tension/torsion biaxial<br />
<strong>loading</strong>s. Journal <strong>of</strong> Reinforced Plastics and Composites, 15, 183-195, 1996.<br />
[7] Inoue A., Fujii T., Kawakami H. Effect <strong>of</strong> <strong>loading</strong> path on mechanical response <strong>of</strong> a glass fabric <strong>composite</strong> at low cyclic fatigue <strong>under</strong><br />
tension/torsion biaxial <strong>loading</strong>. Journal <strong>of</strong> Reinforced Plastics and Composites 19,111-123, 2000.<br />
7
Damage mechanism and fatigue <strong>behaviour</strong> <strong>of</strong> uniaxially and<br />
sequentially loaded wound tube specimens<br />
Abstract<br />
Frank Schmidt *, Peter Horst<br />
Institute <strong>of</strong> aircraft design and lightweight structures, Technische Universität Braunschweig,<br />
Hermann-Blenk Straße 35, 38108 Braunschweig, Germany<br />
In mechanically loaded <strong>composite</strong>s various damage types occur depending on different external load cases. One aspect<br />
<strong>of</strong> this paper is to show the differences in damage and fatigue <strong>behaviour</strong> <strong>under</strong> pure tension/compression and pure shear<br />
fatigue <strong>loading</strong>. For this purpose, fatigue tests with nominally defect-free wound tube specimens and non-destructive tests,<br />
i.e. thermography, optical fracture analysis with high-speed camera and discrete damage monitoring are performed. Based<br />
on the experimental data a comprehensive analysis <strong>of</strong> the successive failure mechanisms (matrix cracking, delamination<br />
and final failure) is conducted. Thereby, the location <strong>of</strong> final failure can be found in an early stage <strong>of</strong> the fatigue life<br />
observing high temperature areas (hot-spots). In the following, the effects <strong>of</strong> two different uniaxial load directions <strong>under</strong><br />
sequence loads, which mean a sequently change from pure shear load to pure tension/compression load after several life<br />
cycles, are investigated.<br />
Keywords: Polymer matrix <strong>composite</strong>s; fatigue test methods; experimental data; non-destructive testing<br />
1. Introduction<br />
The increasing application <strong>of</strong> <strong>composite</strong> materials in several industries, e.g. automobile and aircraft<br />
industry or wind-energy plants, demands a deeper <strong>under</strong>standing <strong>of</strong> the fatigue <strong>behaviour</strong> and its<br />
modelling for different load cases. Thereby, the range <strong>of</strong> fatigue <strong>loading</strong>s is varied. Concerning the high<br />
realistic complexity <strong>of</strong> load histories and arbitrary load ratios or intensities (e.g. aerodynamic loads <strong>of</strong><br />
aircraft wings or rotor blades <strong>of</strong> a wind-energy plant) investigations <strong>of</strong> <strong>multiaxial</strong> cyclic <strong>loading</strong><br />
conditions are required. Additionally, the sequence <strong>of</strong> different load directions and amplitudes is also<br />
crucial for the occurrence and interaction <strong>of</strong> complex damage mechanisms and the fatigue <strong>behaviour</strong> <strong>of</strong><br />
<strong>composite</strong>s.<br />
Although constant-amplitude tests <strong>under</strong> uniaxial <strong>loading</strong> hardly represent realistic fatigue <strong>loading</strong><br />
conditions, mostly these simplified types <strong>of</strong> fatigue <strong>loading</strong> experiments are performed. However, these<br />
investigations lead to a good <strong>under</strong>standing <strong>of</strong> the basic influences <strong>of</strong> fatigue damages and are essential<br />
for the interpretation <strong>of</strong> further researches with <strong>multiaxial</strong> and sequence <strong>loading</strong>s.<br />
The fatigue damage scenarios <strong>of</strong> 0/90 laminates show the initiation and progress <strong>of</strong> transverse cracks<br />
with sharp tips (stage I), the development <strong>of</strong> local delaminations caused by the transverse cracks (stage<br />
II) and the consolidation <strong>of</strong> local delamination surfaces with the final failure (stage III) [1-3]. Analysing<br />
* Corresponding author. Tel: 0049-531-391-9921, Fax: 0049-531-391-9904<br />
E-mail addresses: frank.schmidt@tu-bs.de, p.horst@tu-bs.de
F Schmidt, P Horst / Damage mechanism and fatigue <strong>behaviour</strong> <strong>of</strong> uniaxially and sequentially loaded wound tube specimens<br />
<strong>of</strong> stiffness <strong>behaviour</strong> shows an inverted <strong>behaviour</strong>. The initial stage I consists <strong>of</strong> a steep decrease in<br />
stiffness (triggered by matrix cracks), stage II shows a weak, quasi-linear decrease <strong>of</strong> the stiffness which<br />
is followed by a rapid decrease caused by fibre ruptures and the overall laminate failure in the final<br />
stage III. These damage mechanisms and fatigue <strong>behaviour</strong>s are used for fatigue models. Similar<br />
damage evolutions and stiffness degradations can also be shown in <strong>multiaxial</strong>ly and sequentially loaded<br />
<strong>composite</strong>s. Quaresimin et al. [4] give an up-to-date review <strong>of</strong> current approaches on fatigue <strong>behaviour</strong><br />
<strong>under</strong> <strong>multiaxial</strong> <strong>loading</strong> and distinguish the influence <strong>of</strong> factors such as biaxial stress ratios and damage<br />
mechanisms. Furthermore, a ply-by-ply stiffness degradation model, which describes the first and<br />
second stage <strong>of</strong> the stiffness <strong>behaviour</strong>, based on experimental results <strong>of</strong> <strong>multiaxial</strong> fatigue tests is<br />
developed by Adden et al. [5]. The authors show the application <strong>of</strong> this modelling approach for<br />
<strong>composite</strong>s with arbitrary layers provided that the discrete damage states (crack densities) are known.<br />
Using this approach and experimental test methods Schmidt et al. [6] reveal the transferability <strong>of</strong> the<br />
stiffness <strong>behaviour</strong>s to sequentially loaded specimens. Thereby, the differences in crack development<br />
<strong>under</strong> pure shear loads and pure tension loads are considered and used as input for modelling the<br />
stiffness <strong>behaviour</strong> <strong>under</strong> sequence <strong>loading</strong> (different <strong>loading</strong> directions). Further researches lead to a<br />
fatigue life assessment via ply-by-ply stress analysis [7] and a resulting single lamina-based S-N curve<br />
<strong>of</strong> the critically stressed layer formed by stress redistributions in <strong>multiaxial</strong> fatigue. An enhancement to<br />
this model for calculating the stress redistributions <strong>under</strong> sequence <strong>loading</strong> is conceivable. A further<br />
modelling approach for the effects <strong>of</strong> block <strong>loading</strong> and load sequence is presented by Paepegem et al.<br />
[8]. The authors propose a phenomenological residual stiffness model incorporating a modified static<br />
Tsai-Wu failure criterion. This fatigue damage model is used to simulate the effect <strong>of</strong> block <strong>loading</strong><br />
fatigue tests. Nevertheless, a literature survey on load sequence effects and block <strong>loading</strong> presented in<br />
this paper shows that the opinions on the load sequence effect are strongly divided. Thus, further<br />
researches for a deeper <strong>under</strong>standing <strong>of</strong> the damage accumulation <strong>under</strong> sequence <strong>loading</strong> and for the<br />
validation <strong>of</strong> fatigue damage theories are required.<br />
Concerning the monitoring <strong>of</strong> damages and the fatigue process several approaches can be used.<br />
Applications <strong>of</strong> different non-destructive test methods are required for the interpretation <strong>of</strong> the<br />
correlation between the damage mechanisms and the fatigue <strong>behaviour</strong> (stiffness degradation and final<br />
failure). Adden et al. [9] show fatigue damage characterization in GFRP tube specimens by means <strong>of</strong><br />
circumferential plate waves. The results demonstrate a positive relation between fatigue induced<br />
ultrasonic damping and stiffness degradation. Therefore, using simple measurements <strong>of</strong> circumferential<br />
plate acoustic wave amplitude variations leads to observation <strong>of</strong> fatigue damage. Another possibility <strong>of</strong><br />
monitoring fatigue is the use <strong>of</strong> air-coupled lamb waves [10]. Thereby, the change in wave velocity and<br />
the attenuation parallel to the axial direction <strong>of</strong> the specimens throughout fatigue correlated closely with<br />
the development <strong>of</strong> matrix cracks and measured stiffness degradation. In order to detect the location <strong>of</strong><br />
final failure in an early stage <strong>of</strong> fatigue life <strong>of</strong> <strong>composite</strong> structures, Gagel et al. [11] apply<br />
thermography as a non-destructive test method. By means <strong>of</strong> uniaxial fatigue tests with flat specimens<br />
the authors show the development <strong>of</strong> spots <strong>of</strong> increased temperature correlating with the final failure.<br />
Similar results are also shown by Schmidt et al. [12] investigating nominally defect-free wound tube<br />
9
10<br />
specimens <strong>under</strong> biaxial stress ratios.<br />
Fifth International Conference on <strong>Fatigue</strong> <strong>of</strong> Composites<br />
The current paper contains the experimental results <strong>of</strong> uniaxially and sequentially loaded tube<br />
specimens. Thereby, the occurring damage mechanisms (matrix cracking, delamination and final failure)<br />
measured with different non-destructive test methods and the fatigue <strong>behaviour</strong> for different load cases<br />
are shown. Additionally, these phenomenological results can be used as input for future models<br />
describing the fatigue <strong>behaviour</strong> <strong>of</strong> <strong>composite</strong>s <strong>under</strong> sequence <strong>loading</strong>.<br />
2. Material<br />
Matter <strong>of</strong> the investigation is a nominally defect-free wound tube specimen made <strong>of</strong> E-Glass-fibre<br />
rovings from Owens-Corning (OC 111A) and a resin/hardener-combination <strong>of</strong> RIM135/ RIMH137 from<br />
Hexion. In order to produce these specimens at a high quality standard a self-designed winding machine,<br />
which enables the manufacturing <strong>of</strong> arbitrary lay-ups is used. The winding process and one tube<br />
specimen are shown in figure 1. As in a previous investigation <strong>of</strong> the fatigue <strong>behaviour</strong> <strong>under</strong> biaxial<br />
<strong>loading</strong> [12] the specimens used in the current research consist <strong>of</strong> 8 layers with a symmetric lay-up <strong>of</strong><br />
[0 o /45 o /90 o /-45 o ]S. The applied mass per unit area and the relative mass fractions are shown in talbe 1.<br />
Using resin transfer moulding (RTM) the wound tube specimens are manufactured in the way that the<br />
plies orientated in 0 o -direction (identical to the axial direction <strong>of</strong> the specimens) are the inner and outer<br />
plies.<br />
Fig. 1. Winding process (left) and nominally defect-free wound tube specimen (right).<br />
Table 1. Lay-up <strong>of</strong> the wound tube specimens<br />
Orientation ( o ) Mass per unit area (g/m 2 ) Relative mass fraction (%)<br />
0 638 49<br />
45 301 23<br />
90 63 5<br />
-45 301 23<br />
The testing specimens are <strong>tubes</strong> <strong>of</strong> 46 mm outer diameter, a length <strong>of</strong> 328 mm and a wall thickness <strong>of</strong><br />
approximately 2.0 mm. Due to the wall thickness the fibre volume fraction is about 50 %. After having<br />
completed the RTM-process both ends <strong>of</strong> the tube specimens are strengthened by a GFRP-doubler <strong>of</strong><br />
70 mm length and bonded steel inserts which prevent failure due to the fixing pressure <strong>of</strong> the testing<br />
machine. Such a configuration <strong>of</strong> wound tube specimens makes it possible to
F Schmidt, P Horst / Damage mechanism and fatigue <strong>behaviour</strong> <strong>of</strong> uniaxially and sequentially loaded wound tube specimens<br />
(1) manufacture arbitrary lay-ups with the winding process,<br />
(2) investigate biaxial (tension/compression and torsion) or sequence loads with arbitrary load ratios,<br />
(3) prevent the so-called free edge effect, which occurs when using coupon specimens.<br />
The material lay-up promises high intra- and interlaminar stresses depending on the magnitude <strong>of</strong> the<br />
<strong>loading</strong> and the fraction <strong>of</strong> fibres in the different layers, which are not orientated in global load-direction.<br />
As a consequence fibre-resin-interface cracks will develop and a load transfer inside and between<br />
different layers will occur depending on the amount <strong>of</strong> damage in each layer. Furthermore, these matrix<br />
cracks lead to a decrease <strong>of</strong> the material stiffness <strong>of</strong> the wound tube specimens and to the initiation <strong>of</strong><br />
delaminations. Concerning the active fatigue damage mechanisms, the current work presents the<br />
differences in the development <strong>of</strong> damages <strong>under</strong> different uniaxial and sequence loads.<br />
3. Experiments (uniaxial and sequence <strong>loading</strong>)<br />
The aim <strong>of</strong> the work is to consider the relation between the mechanical properties, the fatigue damage,<br />
the surface temperature and the final failure <strong>of</strong> mechanically loaded wound tube specimens. Thereby,<br />
different load cases are chosen in the current experiments. Two uniaxial <strong>loading</strong> directions (pure<br />
tension/compression and pure shear) and a combination <strong>of</strong> both load cases (sequence loads) are<br />
investigated. Sequence <strong>loading</strong> means the change from pure shear load to pure tension/compression load<br />
after several life cycles. These changes <strong>of</strong> loads are conducted sequently after 1000 (the first interval<br />
length) or 2500 (the second interval length) <strong>loading</strong> cycles for different specimens. Independent <strong>of</strong> the<br />
sequence interval length the tube specimens are firstly loaded with torsion moments in the current work.<br />
Other interval lengths and changes <strong>of</strong> the initial load cases will be conducted in further works.<br />
Furthermore, a change from sequence loads with pure tension/compression and pure shear loads to<br />
sequence loads with arbitrary biaxial load ratios are conceivable.<br />
The experimental tests are similar to a recent research [12] and are performed on a servohydraulic<br />
tension-torsion machine, which provides tensional (up to ±250 kN) as well as torsional (up to<br />
±2200 Nm) loads. All fatigue tests discussed in this paper are conducted in a force-controlled manner<br />
with R = -1 and a frequency <strong>of</strong> 3 Hz. Different uniaxial/biaxial and sequence load ratios are enabled by<br />
using different ratios <strong>of</strong> tension/compression forces and torsional moments.<br />
A constant ambient temperature <strong>of</strong> 20 o C is assured by means <strong>of</strong> a cooling chamber installed between<br />
the grips <strong>of</strong> the testing machine. A small opening at the front side <strong>of</strong> the cooling chamber enables the<br />
application <strong>of</strong> different non-destructive tests during all uniaxially and sequentially loaded fatigue tests.<br />
So, a thermographic camera is used for investigation <strong>of</strong> the thermal development <strong>of</strong> the specimen<br />
surface and a high speed camera is applied for examining the failure progress. Furthermore, aluminium<br />
reflectors are installed to observe the rear side <strong>of</strong> the tube specimen. Applying these reflectors the<br />
thermal infrared emission as well as the optical reflection <strong>of</strong> the rear side <strong>of</strong> the tube specimens is<br />
visible.<br />
In order to calculate the material stiffness and to observe the fatigue <strong>behaviour</strong>, all fatigue tests are<br />
divided into three main parts (see figure 2):<br />
11
12<br />
Fifth International Conference on <strong>Fatigue</strong> <strong>of</strong> Composites<br />
Fig. 2. Protocol <strong>of</strong> fatigue <strong>loading</strong>.<br />
(1) Characterization step: In this step, quasi-static tests are performed with force-controlled ramps<br />
(discrete pure tension/compression force and positive/negative torsion moments). These<br />
characterization loads are chosen in a way that no further damage occurs and they are considerably<br />
smaller than the applied cyclic loads in the fatigue damage steps. Nevertheless, all quasi-static<br />
loads are adequate for calculating the Young‟s (tangent modulus <strong>of</strong> elasticity) and shear modulus.<br />
(2) <strong>Fatigue</strong> damage step: After each characterization step, the fatigue damage step with cyclic loads<br />
(sinus wave form) <strong>of</strong> constant amplitudes follows. Here, the different uniaxial and sequence fatigue<br />
loads are performed. These steps introduce the fatigue damages like matrix cracking, delamination<br />
and fibre failure. For recording the surface temperature <strong>of</strong> the tube specimen during the fatigue<br />
damage steps, the thermographic camera (CEDIP Titanium) is applied. Furthermore, a photo<br />
camera (CASIO Exilim Pro EX-F1) with integrated ring buffer and high-speed-mode is used for<br />
observing the qualitative development <strong>of</strong> matrix cracks and for an optical fracture analysis<br />
(recording the location and type <strong>of</strong> final failure). Consequently, an analysis <strong>of</strong> the location <strong>of</strong> high<br />
surface temperatures (so-called hot-spots) and the location <strong>of</strong> the fracture is conducted.<br />
(3) Discrete damage monitoring: Matrix cracking indicated by the crack density is the first occurring<br />
type <strong>of</strong> fatigue damage and can be monitored with a light microscope (ZEISS Stemi 2000-C).<br />
Based on the nearly similar refraction index <strong>of</strong> resin and glass fibre used for the tube specimens,<br />
the specimen is transparent and matrix cracks are observable via transmitted light method.<br />
Therefore, the fatigue test is stopped after several fatigue damage steps and the specimen is taken<br />
out <strong>of</strong> the testing machine. Subsequently, photos <strong>of</strong> several areas (up to 15) <strong>of</strong> the specimen are<br />
taken and matrix cracks are counted using the photographically documented cracking states.<br />
Differentiating the cracks by their orientation angle leads to the numbers <strong>of</strong> cracks in each single<br />
layer direction (0 o , 45 o , 90 o and -45 o -direction). Additionally, referencing <strong>of</strong> these crack numbers to<br />
the fixed monitoring areas is conducted in order to calculate the specific crack densities, which are<br />
average values <strong>of</strong> all observed areas. Beside the matrix crack monitoring close-up digital photos <strong>of</strong><br />
occurred damages such as delaminations are taken.<br />
Concerning the different parts <strong>of</strong> the fatigue tests, the heating and cooling <strong>of</strong> the tube specimens
F Schmidt, P Horst / Damage mechanism and fatigue <strong>behaviour</strong> <strong>of</strong> uniaxially and sequentially loaded wound tube specimens<br />
repeats continuously during the fatigue damage steps and the characterization steps in the uniaxially and<br />
sequentially loaded fatigue life tests. Due to the external mechanical loads, the experiments reveal a<br />
uniform heating <strong>of</strong> the tube specimens during each fatigue damage step. Due to the cooling to a constant<br />
temperature <strong>of</strong> 20 o C during each characterization step the same initial state <strong>of</strong> the surface temperature <strong>of</strong><br />
the tube specimens is ensured at the beginning <strong>of</strong> each fatigue damage step. Then, the maximum surface<br />
temperatures increase up to 30 o C (except for the occurring hot spot) during the fatigue damage steps,<br />
although the ambient temperature remains at 20 o C. Another advantage <strong>of</strong> controlling the surface<br />
temperatures is the prevention <strong>of</strong> potential thermal damage <strong>of</strong> the matrix during all fatigue life tests.<br />
Fig. 3. typical surface distribution with evaluation areas (left) and development <strong>of</strong> surface temperature during the fatigue life (right).<br />
In order to compare the surface temperatures <strong>of</strong> each tube specimen <strong>under</strong> different load cases, the<br />
surface temperature development during 100 sinus cycles <strong>of</strong> each fatigue damage step is analysed. For<br />
this purpose, the average and maximum temperatures <strong>of</strong> two different areas are determined in several<br />
thermographic pictures. On the left hand side <strong>of</strong> figure 3 a typical surface temperature distribution at the<br />
end <strong>of</strong> the fatigue life (occurred hot-spot) with the measurement areas is shown. The picture illustrates<br />
the increase <strong>of</strong> the surface temperature, which is the subtraction <strong>of</strong> the initial one from the measured<br />
temperature (T-T0). Firstly, the average temperature is used to represent the main surface temperature<br />
and secondly, the maximum temperature is required for detecting the highest temperature along the tube<br />
specimens (at the end <strong>of</strong> the fatigue life for detecting the hot spot temperature). Moreover, a diagram<br />
with the calculated temperature T-T0 <strong>of</strong> selected fatigue damage steps versus the normalized lifespan is<br />
plotted on the right hand side <strong>of</strong> figure 3. Higher values <strong>of</strong> T-T0 imply a faster and higher heating <strong>of</strong> the<br />
specimens during the analyzed 100 sinus cycles <strong>of</strong> the selected fatigue damage steps. Investigating<br />
different load cases reveals differences in the surface temperature development and in the development<br />
<strong>of</strong> high-temperature areas (hot-spots), which is presented in section 4. The comparison <strong>of</strong> thermographic<br />
pictures <strong>of</strong> different specimens at the same time <strong>of</strong> several fatigue damage steps (after exact 100 sinus<br />
13
14<br />
Fifth International Conference on <strong>Fatigue</strong> <strong>of</strong> Composites<br />
cycles <strong>of</strong> each fatigue damage step) is enabled by using a digital output <strong>of</strong> the testing machine, which<br />
always triggers the thermography camera.<br />
4. Experimental results<br />
Firstly, a differentiation between uniaxially loaded and sequentially loaded tube specimens is<br />
conducted showing the basic damage mechanisms and fatigue <strong>behaviour</strong> <strong>under</strong> uniaxial <strong>loading</strong>s<br />
separately. Afterwards the interaction <strong>of</strong> the different fatigue <strong>behaviour</strong>s <strong>under</strong> sequence <strong>loading</strong>s<br />
(combination <strong>of</strong> pure shear loads and pure tension/compression loads) is presented.<br />
4.1 uniaxial pure shear loads<br />
As mentioned above, the crack densities, the Young‟s modulus, the shear modulus and the<br />
development <strong>of</strong> the surface temperatures are measured throughout cyclic <strong>loading</strong>. The following<br />
investigations are shown by reference to an exemplary tube specimen <strong>under</strong> pure shear loads. However,<br />
the results are generally observed for all tested specimens. In figure 4 the crack densities and the<br />
stiffness degradation (Young‟s modulus E/E0 and shear modulus G/G0) are shown. The results are<br />
plotted versus the normalized lifespan <strong>of</strong> the specimen. A quite usual increase <strong>of</strong> the layer-specific crack<br />
densities within the first 10-15 % <strong>of</strong> the fatigue life is followed by saturation <strong>of</strong> the crack densities.<br />
During the first part <strong>of</strong> the fatigue life the stiffnesses show the typical <strong>behaviour</strong> <strong>of</strong> a high degradation<br />
caused by matrix cracking. The magnitude <strong>of</strong> stiffness degradations depends on the highest values <strong>of</strong><br />
respective crack densities. After crack density saturation the specimen exhibits only a minor further<br />
decline <strong>of</strong> the stiffnesses till failure. However, differences in the decrease <strong>of</strong> Young‟s and shear modulus<br />
are monitored. The specimen shows a significantly steeper decrease in the shear modulus caused by the<br />
crack densities <strong>of</strong> the 0 o -layers (high relative mass fraction <strong>of</strong> 49 % leads to high influence on the shear<br />
modulus degradation). This interaction <strong>of</strong> the reached crack density <strong>of</strong> the 0 o -layers and the degradation<br />
<strong>of</strong> the shear modulus is also visible comparing the results <strong>of</strong> the pure shear loaded and pure<br />
tension/compression loaded specimens mentioned below.<br />
Fig. 4. crack densities (left) and moduli + temperature development (right) <strong>under</strong> pure shear loads.<br />
Additionally, the development <strong>of</strong> average and maximum surface temperatures T-T0 (analyzed after<br />
exactly 100 sinus waves <strong>of</strong> selected fatigue damage steps) are illustrated in the diagram on the right<br />
hand side <strong>of</strong> figure 4. The results show a decrease <strong>of</strong> the occurring temperatures within the first 10-15 %
F Schmidt, P Horst / Damage mechanism and fatigue <strong>behaviour</strong> <strong>of</strong> uniaxially and sequentially loaded wound tube specimens<br />
<strong>of</strong> the fatigue life, which is very similar to the stiffness degradation. Consequently, a higher and faster<br />
surface temperature development is measured within the first 10-15 % <strong>of</strong> the fatigue life or more<br />
precisely during the increase <strong>of</strong> matrix cracking. Hence, the initiation <strong>of</strong> matrix cracks dissipates more<br />
energy and leads to higher surface temperatures. Following these temperature decreases an almost<br />
uniform development <strong>of</strong> the surface temperature is measured. During that part the development <strong>of</strong><br />
delaminations begins. The distribution <strong>of</strong> delaminations along tube specimens appears randomly and<br />
leads to local damages increasing local temperatures. This temperature increase caused by<br />
delaminations at the end <strong>of</strong> the fatigue life is also plotted in figure 4 (right). The maximum surface<br />
temperatures at the location <strong>of</strong> delaminations can reach twice the values for T-T0 as the average<br />
temperatures. On the left hand side <strong>of</strong> figure 5 the infrared image with the surface temperatures shortly<br />
before final failure is shown. Only one separated spot <strong>of</strong> higher thermal activity (hot spot) caused by<br />
cyclic <strong>loading</strong> develops after approximately 90 % <strong>of</strong> the fatigue life (at the left upper front side <strong>of</strong> the<br />
specimen, whereas the average temperature is similar to the rest <strong>of</strong> the specimen). This location is equal<br />
to the initiation <strong>of</strong> final failure (figure 5 right).<br />
Fig. 5. infrared image with local hot-spot shortly before final failure (left) and high speed image at failure initiation (right) <strong>under</strong> pure shear loads.<br />
4.2 uniaxial pure tension/compression loads<br />
Analogous to figure 4 the crack densities (left), the stiffness degradations (Young‟s modulus E/E0 and<br />
shear modulus G/G0) and the surface temperature development (right) <strong>of</strong> one exemplarily pure<br />
tension/compression loaded tube specimen are shown in figure 6. The development <strong>of</strong> the crack<br />
densities and the stiffness <strong>behaviour</strong> is very similar to the pure shear loaded specimens. Within the first<br />
10-15 % <strong>of</strong> the lifespan, matrix cracks develop in the different layers and lead to high degradation <strong>of</strong><br />
stiffness. Compared to the pure shear loaded specimens two differences are observed. Firstly, the shear<br />
15
16<br />
Fifth International Conference on <strong>Fatigue</strong> <strong>of</strong> Composites<br />
modulus shows a lesser decrease <strong>under</strong> pure tension/compression loads caused by the very low crack<br />
density <strong>of</strong> the 0 o -layers and secondly, a rapid decrease in Young‟s modulus starting at 75 % <strong>of</strong> lifespan<br />
caused by fibre breaking in the extensively delaminated 0 o -layers is observed. These delaminated layers<br />
also lead to different final failure as mentioned below. The crack density <strong>of</strong> the 0 o -layers reaches lower<br />
values <strong>under</strong> pure tension/compression loads than <strong>under</strong> pure shear loads, which results from the<br />
different intralaminar stresses <strong>of</strong> these layers. External pure tension/compression loads lead to fibre<br />
parallel stresses explaining the lower values <strong>of</strong> crack density. In contrast to this load case the 0 o -layers<br />
obtain higher transverse tension stress leading to a higher crack density <strong>of</strong> the 0 o -layer <strong>under</strong> pure shear<br />
loads.<br />
Fig. 6. crack densities (left) and moduli + temperature development (right) <strong>under</strong> pure tension/compression loads.<br />
Fig. 7. infrared image with local hot-spot shortly before final failure (left) and high speed image at failure initiation (right) <strong>under</strong> pure<br />
tension/compression loads.<br />
Looking at the temperature developments throughout tension/compression cyclic <strong>loading</strong> similar<br />
decreases are measured within the first 10-15 %, whereas the maximum temperatures increase at an<br />
earlier stage <strong>of</strong> fatigue life (at 50 % <strong>of</strong> lifespan). At this point <strong>of</strong> fatigue life delaminations initiate along
F Schmidt, P Horst / Damage mechanism and fatigue <strong>behaviour</strong> <strong>of</strong> uniaxially and sequentially loaded wound tube specimens<br />
the 0 o -layers, which leads to small hot spots at the tips <strong>of</strong> the delaminations influencing the measured<br />
maximum temperatures. Due to the huge number <strong>of</strong> delaminations the infrared image shows many areas<br />
with higher thermal activity caused by cyclic <strong>loading</strong> (see figure 7, left) shortly before final failure. The<br />
location <strong>of</strong> final failure is located in this region <strong>of</strong> higher temperatures (figure 7, right).<br />
4.3 sequence <strong>loading</strong><br />
The interaction <strong>of</strong> damage mechanisms and the fatigue <strong>behaviour</strong> <strong>under</strong> sequence <strong>loading</strong> (sequently<br />
change <strong>of</strong> pure shear load and pure tension/compression load) is investigated. Thereby, two different<br />
interval lengths (1000 cycles and 2500 cycles) are distinguished. The constant load amplitudes are<br />
selected from the experiments described above. Consequently, the following results show the changes in<br />
fatigue <strong>behaviour</strong> <strong>under</strong> sequence load directions and further tests will reveal the influence <strong>of</strong> different<br />
load amplitudes combined with varying load directions.<br />
Fig. 8. crack densities <strong>of</strong> two specimens <strong>under</strong> sequence <strong>loading</strong> with interval length 2500 cycles (left) and interval length 1000 cycles (right)<br />
(limitation max. 10000 cycles).<br />
Fig. 9. Moduli and temperature development <strong>of</strong> two specimens <strong>under</strong> sequence <strong>loading</strong> with interval length 2500 cycles (left) and interval length<br />
1000 cycles (right).<br />
The monitoring <strong>of</strong> matrix cracking reveals the step-like increase <strong>of</strong> the layer-specific crack densities<br />
at the beginning <strong>of</strong> fatigue life. For a better visualisation <strong>of</strong> this effect the crack densities versus the load<br />
cycles are shown in figure 8 with a limitation <strong>of</strong> maximum 10000 cycles. The crack densities increase<br />
<strong>under</strong> pure shear loads and partly reach saturation, before the first change <strong>of</strong> load direction is conducted.<br />
In the following pure tension/compression loads several crack densities show a new steeper increase (in<br />
particular the crack densities <strong>of</strong> the 45 o -layers). Thus, the crack densities <strong>of</strong> the 45 o -layers reach the<br />
17
18<br />
Fifth International Conference on <strong>Fatigue</strong> <strong>of</strong> Composites<br />
maximum crack density measured for specimens <strong>under</strong> pure tension/compression loads. This steeper<br />
increase is not measured for the crack densities <strong>of</strong> 0 o - and 90 o -layers, because these layers reach higher<br />
maximum crack densities <strong>under</strong> pure shear loads than <strong>under</strong> pure tension/compression loads.<br />
Consequently, these crack densities show saturation and no further development <strong>of</strong> matrix cracks in the<br />
first pure tension/compression load interval. These results reveal the influence <strong>of</strong> sequence <strong>loading</strong>s on<br />
the damage evolution. The correlation to the stiffness <strong>behaviour</strong> and surface development is illustrated<br />
in figure 9. The stiffness <strong>behaviour</strong> <strong>under</strong> sequence loads is very similar to the <strong>behaviour</strong> <strong>under</strong> pure<br />
tension/compression or pure shear loads. Within the first 10-15 % <strong>of</strong> lifespan the Young‟s and shear<br />
modulus rapidly decrease followed by a slow, almost linear decline. During these phases <strong>of</strong> the fatigue<br />
life the average and maximum surface temperatures show a step-like <strong>behaviour</strong> which is explained in<br />
detailed below.<br />
After approximately 90 % <strong>of</strong> the lifespan, a further steeper decrease <strong>of</strong> the Young‟s modulus is<br />
measured ending in the final failure, which is equal to the results <strong>of</strong> the specimens <strong>under</strong> pure<br />
tension/compression loads. The reason for this <strong>behaviour</strong> is the initiation and increase <strong>of</strong> huge<br />
delamination areas and occurring fibre breaking in the 0 o -layers within the tension/compression load<br />
intervals <strong>of</strong> the sequence <strong>loading</strong>. Conducting a change from pure tension/compression loads to pure<br />
shear loads leads to an interruption <strong>of</strong> the stiffness decrease (see figure 9, right, at the end <strong>of</strong> fatigue life).<br />
Due to this load direction change the size <strong>of</strong> delaminations remains unchanged and no further increase<br />
<strong>of</strong> delaminated areas or fibre cracking is observed <strong>under</strong> pure shear loads. The influence <strong>of</strong> the load<br />
direction on the damage increase is also revealed by the thermographic changes <strong>under</strong> sequence<br />
<strong>loading</strong>s. On the left hand side <strong>of</strong> figure 10 the occurring hot spots (correlated with delaminations) and<br />
fibre breaking <strong>under</strong> pure tension/compression loads is illustrated. The infrared image <strong>of</strong> the directly<br />
following pure shear load interval (middle <strong>of</strong> the figure 10) shows a uniform heating <strong>of</strong> the specimen<br />
without any hot spots, whereas the 0 o -layers are extensively delaminated (see digital picture on the right<br />
hand side <strong>of</strong> figure 10). Subsequently, the final failure occurs <strong>under</strong> pure tension/compression load.<br />
The differences in surface temperature development <strong>under</strong> sequence <strong>loading</strong> are also shown in figure<br />
11. Besides the sequentially loaded specimens the surface temperature development T-T0 <strong>of</strong> two other<br />
specimens loaded <strong>under</strong> pure shear or pure tension/compression are plotted. Firstly, the surface<br />
temperature developments <strong>of</strong> specimens <strong>under</strong> pure shear loads and pure tension/compressions loads are<br />
different. During the pure tension/compression loads the average and maximum surface temperatures<br />
reach lower values <strong>of</strong> T-T0 than <strong>under</strong> pure shear. This trend is also observed for sequentially loaded<br />
specimens. The temperatures show a step-like <strong>behaviour</strong> and change using different uniaxial load cases.<br />
This effect is independent <strong>of</strong> the interval length and the sequence <strong>of</strong> loads (see figure 11). Starting at<br />
60-70 % <strong>of</strong> lifespan the surface temperatures increase individually due to the occurrence <strong>of</strong> hot-spots<br />
during the pure tension/compression loads. As already stated, the final failure is only caused by the<br />
initiation and development <strong>of</strong> delaminations in the pure tension/compression load intervals.
F Schmidt, P Horst / Damage mechanism and fatigue <strong>behaviour</strong> <strong>of</strong> uniaxially and sequentially loaded wound tube specimens<br />
Fig. 10. thermographic changes <strong>under</strong> sequence <strong>loading</strong> during pure tension/compression load interval (left), the direct following pure shear load<br />
interval (middle) and digital picture at the beginning <strong>of</strong> showed pure shear load interval (right).<br />
Fig. 11. surface temperature development <strong>of</strong> two specimens <strong>under</strong> sequence <strong>loading</strong> with interval length 2500 cycles (left) and interval length<br />
1000 cycles (right).<br />
5. Conclusion<br />
The experimental procedures and results <strong>of</strong> uniaxially and sequentially fatigue loaded tube specimens<br />
are presented. Due to the application <strong>of</strong> non-destructive test methods such as crack monitoring and<br />
thermography the fatigue <strong>behaviour</strong> is related to the damage mechanisms (development <strong>of</strong> matrix cracks<br />
and initiation <strong>of</strong> delaminations). During the last few percentages <strong>of</strong> the lifespan hot-spots caused by<br />
cyclic <strong>loading</strong> develop and the location <strong>of</strong> the later final failure is detected in early stage <strong>of</strong> fatigue life.<br />
A correlation <strong>of</strong> the located hot-spots and the final failure is proved by means <strong>of</strong> a high-speed camera.<br />
The two uniaxial load cases (pure tension/compression and pure shear load) lead to different damage<br />
mechanisms and surface temperature developments, which are applicable to sequentially loaded<br />
specimens. In ongoing work, it is attempted to investigate sequentially loaded specimens with different<br />
biaxial load cases and load amplitudes.<br />
19
20<br />
Acknowledgements<br />
Fifth International Conference on <strong>Fatigue</strong> <strong>of</strong> Composites<br />
The authors gratefully acknowledge the support by the German Science Foundation (DFG) within the<br />
project PAK267 (Effects <strong>of</strong> Defects).<br />
References<br />
[1] Schulte K. Baron C., Neubert N.: Damage development in carbon fibre epoxy laminates: cyclic <strong>loading</strong>, Composites, 1985, pp. 281-285<br />
[2] Talreja R.: Damage and fatigue in <strong>composite</strong>s – a personal account, Composites Science and Technology 68, 2008, pp. 2585-2591<br />
[3] Nairn J.A., Hu S.: The initiation and growth <strong>of</strong> delaminations induced by matrix microcracks in laminated <strong>composite</strong>s, International<br />
Journal <strong>of</strong> Fracture 57, 1992, pp. 1-24<br />
[4] Quaresimin M., Susmel L., Talreja R.: <strong>Fatigue</strong> <strong>behaviour</strong> and life assessment <strong>of</strong> <strong>composite</strong> laminates <strong>under</strong> <strong>multiaxial</strong> <strong>loading</strong>s,<br />
International Journal <strong>of</strong> <strong>Fatigue</strong> 32, pp. 2-16, 2010<br />
[5] Adden S., Horst P.: Stiffness degradation <strong>under</strong> fatigue in <strong>multiaxial</strong>ly loaded non-crimped-fabrics, International Journal <strong>of</strong> <strong>Fatigue</strong> 32,<br />
2010, pp. 108-122<br />
[6] Schmidt F., Adden S., Möhle E., Horst P.: Description and modelling <strong>of</strong> the multi-axial stiffness degradation in fatigue loaded NCFs <strong>under</strong><br />
sequence <strong>loading</strong>, 13th European Conference on Composites, ECCM-13, Stockholm, 2008<br />
[7] Schmidt F., Adam T. J., Horst P.: <strong>Fatigue</strong> modelling <strong>of</strong> a nominally defect-free GFRP <strong>composite</strong> <strong>under</strong> multi-axial <strong>loading</strong>, submitted to<br />
Composites Science and Technology, 2010<br />
[8] Paepegem W., Degrieck J.: Effects <strong>of</strong> load sequence and block <strong>loading</strong> on the fatigue response <strong>of</strong> fiber-reinforced <strong>composite</strong>s, Mechanics<br />
<strong>of</strong> Advanced Materials and Structures 9, 2002, pp. 19-35<br />
[9] Adden S., Pfleiderer K., Solodov I., Horst P., Busse G.: Characterization <strong>of</strong> stiffness degradation caused by fatigue damage using<br />
circumferential plate acoustic waves, Composite Science and Technology 68, 2008, pp. 1616-1623<br />
[10] Rheinfurth M., Schmidt F., Solodov I., Busse G., Horst P.: Air-coupled Lamb waves combined with thermography for monitoring fatigue<br />
in biaxially loaded <strong>composite</strong> <strong>tubes</strong>, submitted to Composites Science and Technology, 2010<br />
[11] Gagel A., Lange D., Schulte K.: On the relation between crack-densities, stiffness degradation and surface temperature distribution <strong>of</strong><br />
tensile fatigue loaded glass-fibre non-crimp-fabric reinforced epoxy, Composites Part A 37, 2006, pp. 222-228<br />
[12] Schmidt, F., Geier M., Horst P.: Characterization <strong>of</strong> the fatigue <strong>behaviour</strong> <strong>of</strong> nominally defect-free wound tube specimens <strong>under</strong> biaxial<br />
<strong>loading</strong>, submitted to Composites: Part A, 2010
Abstract<br />
An effective method for P-S-N curve fitting <strong>of</strong> <strong>composite</strong><br />
laminates<br />
D Guan *, Q Sun<br />
School <strong>of</strong> Aeronautic, Northwestern Polytechnical University, Xi’an 710072, China<br />
A method for P-S-N curve fitting <strong>of</strong> <strong>composite</strong> laminates is presented, which is based on the heteroscedastic regression<br />
analysis theory. The results <strong>of</strong> two groups <strong>of</strong> carbon fiber laminates fatigue test show that P-S-N curve with high<br />
confidence and high reliability can be obtained by this method. The presented method consider all the test data <strong>of</strong> an S-N<br />
curve in different stress levels as a whole, not only make use <strong>of</strong> test data more fully, but also has higher precision than<br />
traditional methods.<br />
Keywords: P-S-N curve; Regression analysis; <strong>Fatigue</strong> test; Confidence; Reliability<br />
1. Introduction<br />
P-S-N curve has important significance in structural fatigue properties description and fatigue life<br />
estimation. Commonly used methods for measuring P-S-N curve in engineering is single-specimen test<br />
method and group test method, the former belongs to the field <strong>of</strong> homoscedastic regression analysis,<br />
without considering the changes in variance <strong>of</strong> log fatigue life <strong>under</strong> different stress levels, On the<br />
contrary, the latter consider the changes in variance, but the effect <strong>of</strong> the number <strong>of</strong> specimen on its<br />
precision is great.<br />
The dispersivity <strong>of</strong> fatigue test data <strong>of</strong> <strong>composite</strong> is so large that the single-specimen test method is<br />
not applicable, and the group test method needs a large number <strong>of</strong> specimens to ensure its precision.<br />
Reference [1] proposes a method <strong>of</strong> linear variance regression analysis. A small sample test method for<br />
S-N and P-S-N curves is established in reference [2], which can obtain S-N and P-S-N curves <strong>of</strong> metal<br />
materials by scattered test. A method for P-S-N curve fitting <strong>of</strong> <strong>composite</strong> based on the heteroscedastic<br />
regression analysis theory is presented in this paper, and two groups <strong>of</strong> carbon fiber laminates P-S-N<br />
curve test has been performed to validate the efficiency <strong>of</strong> this method.<br />
2. Heteroscedastic regression analysis theory<br />
The S-N curve <strong>of</strong> materials can be described by power function formula<br />
* Corresponding author. Tel / Fax: +86-29-88492850<br />
E-mail addresses: guanfei@mail.nwpu.edu.cn<br />
<br />
S N = C<br />
(1)
22<br />
Fifth International Conference on <strong>Fatigue</strong> <strong>of</strong> Composites<br />
Where, N is fatigue life, S is stress, and C is undetermined constants. Using log function on both<br />
sides <strong>of</strong> Eq. (1)<br />
When<br />
Eq. (2) can be written<br />
lg N = lgC - lg S<br />
(2)<br />
y = lg N, x = lg S, a = lg C, b = - <br />
(3)<br />
y = a + bx<br />
(4)<br />
Eq. (4) shows that there exists linear log relationship between the structural fatigue life and the stress.<br />
A larger number <strong>of</strong> fatigue test data suggest that lgN obey normal distribution and the standard<br />
deviation <strong>of</strong> it will linear increase with the stress decrease if the S-N or P-S-N curves are linear in log<br />
coordinate. The relationship between and the stress is expressed as<br />
Where, 0, , x0are<br />
undetermined parameters [1].<br />
( x) = [1 + (<br />
x - x )]<br />
(5)<br />
0 0<br />
Independence fatigue test <strong>of</strong> single specimen was performed for ni times in the same stress S i and<br />
the fatigue life is denoted by Nij ( i = 1,2, , m; j = 1,2, , ni<br />
), transform Nij to a set <strong>of</strong> data<br />
[ x , y ]( i = 1,2, , m; j = 1,2, , n ) by using Eq.(3), then the formula <strong>of</strong> P-S-N curve with high<br />
i ij i<br />
confidence and high reliability can be obtained by method <strong>of</strong> heteroscedastic regression analysis [2].<br />
And<br />
yp = ap + bp x<br />
(6)<br />
u ˆ c0 0 ( c2x + 2 c3)<br />
a ˆ ˆ p = a + c00(1 -x0) u p -<br />
2 c x + c x + c<br />
2<br />
1 2 3<br />
ˆ<br />
ˆ<br />
u c0 0 (2 c1x + c2<br />
)<br />
b ˆ<br />
p = b + c0 0 u p -<br />
2 c x + c x + c<br />
0<br />
n i=<br />
1<br />
2<br />
1 2 3<br />
(7)<br />
(8)<br />
1 m<br />
x = n x<br />
(9)<br />
x =<br />
i i<br />
nx<br />
( )<br />
m<br />
i i<br />
2<br />
i= 1 I xi<br />
m ni<br />
2<br />
i= 1 I xi<br />
( )<br />
0<br />
(10)<br />
I( x) = 1 + (<br />
x - x )<br />
(11)<br />
2<br />
-1<br />
m<br />
- u <br />
<br />
i<br />
- w <br />
i=<br />
1 <br />
21 c0= 1 - , = n - 3<br />
(12)<br />
22 <br />
2 2 2<br />
u p 1 u <br />
c1<br />
= + 1- w l <br />
<br />
xx w <br />
<br />
2 2<br />
2 (1 -x0)<br />
up 2x<br />
u <br />
c2<br />
= - 1- w l <br />
<br />
xx w <br />
<br />
(13)<br />
(14)
Where, ˆ, , ˆ0<br />
deviator [3].<br />
D Guan, Q Sun / An effective method for P-S-N curve fitting <strong>of</strong> <strong>composite</strong> laminates<br />
2 2 2<br />
2<br />
(1 - x0) u m<br />
p u<br />
-2<br />
x <br />
<br />
c3 = + 1 niI( xi)<br />
+ 1- (15)<br />
w i= 1 l <br />
xx w <br />
<br />
l<br />
xx<br />
2<br />
n ( x - x)<br />
= (16)<br />
( )<br />
m<br />
i i<br />
i= 1<br />
2<br />
I xi<br />
1 <br />
w= 2+ u-0.64-<br />
<br />
+ u<br />
-0.64<br />
<br />
a bˆ are the estimated value <strong>of</strong> undetermined parameters, u , uare standard normal<br />
3. P-S-N curve test<br />
The grade <strong>of</strong> carbon fiber laminates is CYCOM 970/PWC T300, the ply orientations is<br />
[45/0/0/0/-45/90/45/0/0/-45]S and the single thickness is 0.155mm. All laminates were divided into two<br />
groups (named A and B) for P-S-N curve test, Table.1 shows the results <strong>of</strong> test.<br />
Table 1. Results <strong>of</strong> P-S-N curve test<br />
No. Stress ratio/R Frequency / HZ Smax / MPa <strong>Fatigue</strong> life /cycle<br />
A1 0.1 5 404 7270 23134 32204 15480<br />
A2 0.1 5 388 13875<br />
A3 0.1 5 357 18936 75687 12713 70427 15971 26340<br />
A4 0.1 5 334 106155 685025 940843 82132 322380<br />
A5 0.1 5 303 1102374 404326 1076982 997271<br />
B1 -1 5 605 1584 175 144<br />
B2 -1 5 557 2757 9942 1088 1431 5574<br />
B3 -1 5 478 41174 38049 25092 29197 41621<br />
B4 -1 5 414 126022 145341 234957 203935 215949<br />
B5 -1 5 366 420749 803786 798668 572645 811787<br />
Table 1 shows that the P-S-N curve with high precision can‟t be obtained from the data <strong>of</strong> group A by<br />
group test method unless complementary test [2,4], however, by the method <strong>of</strong> heteroscedastic<br />
regression analysis, all the test data <strong>of</strong> an S-N curve in different stress levels can be analyzed as an<br />
integration, so its information quantity is much bigger than group test method, which is equivalent to<br />
reduce the number <strong>of</strong> specimens test needed.<br />
The formula <strong>of</strong> P-S-N curve with 95% confidence and 95% reliability can be obtained by Eq. (6~17).<br />
Group A<br />
Or<br />
Group B<br />
p<br />
23<br />
(17)<br />
yp, A = 45.9851- 16.5397xA<br />
(18)<br />
N 10 S -<br />
= (19)<br />
45.9851 16.5397<br />
p, A A<br />
yp, B = 46.0492 - 15.8161xB<br />
(20)
24<br />
Or<br />
Fifth International Conference on <strong>Fatigue</strong> <strong>of</strong> Composites<br />
N 10 S -<br />
= (21)<br />
46.0492 15.8161<br />
p, B B<br />
N95/95 is the structural safe life with 95% confidence and 95% reliability in different stress levels and<br />
it can be calculated by Eq. (18~21) or obtained from P-S-N curve which was measured by traditional<br />
group test method, in addition, the test value <strong>of</strong> N95/95 can be obtained from fatigue test data by<br />
probability-based method [4] as log fatigue life lgN obey normal distribution. Table.2 shows the value<br />
<strong>of</strong> N95/95,B given in different ways.<br />
Group Smax / MPa<br />
B<br />
Table 2. N95/95,B given in different ways<br />
Heteroscedastic<br />
regression analysis<br />
N95/95,B<br />
Group test<br />
method<br />
Test value<br />
(the control group)<br />
605 112 0 /<br />
557 417 6 61<br />
478 4689 571 13251<br />
414 45547 41081 57767<br />
366 319835 1605342 193566<br />
Selected the test value <strong>of</strong> N95/95,B as reference value, results <strong>of</strong> table 2 suggest that compared with<br />
traditional group test method the P-S-N curve given by the method <strong>of</strong> heteroscedastic regression<br />
analysis has higher precision.<br />
4. Conclusions<br />
1)By the method <strong>of</strong> heteroscedastic regression analysis, all the test data <strong>of</strong> an S-N curve in different<br />
stress levels can be analyzed as an integration, the use <strong>of</strong> test data is more fully than traditional methods.<br />
2)Fitting the group test data by the presented method can obtain the P-S-N curve with high precision.<br />
3)To the fatigue test data with large dispersivity, P-S-N curve with high confidence and high<br />
reliability can be given by this method also.<br />
References<br />
[1] FU HuiMin. Linear variance regression analysis[J]. Acta Aeronautica et Astronautica Sinica, 1994, 15(3):295~302.<br />
[2] FU HuiMin, LIU ChenRui. Small sample test method for S-N and P-S-N curves[J]. Journal <strong>of</strong> Mechanical Strength, 2006, 28(4): 552~555.<br />
[3] GAO ZhenTong. <strong>Fatigue</strong> reliability[M]. Beijing: Beijing University <strong>of</strong> Aeronautics and Astronautic Press, 2000.<br />
[4] WU FuMin. Structural fatigue strength[M]. Xi‟an: Northwestern Polytechnical University Press, 1985.
Constant <strong>Fatigue</strong> Life Diagrams for a Woven CFRP Laminate<br />
at Room and High Temperatures<br />
Abstract<br />
M Kawai a, *, Y Matuda a , R Yoshimura a ,<br />
H Hoshi b , Y Iwahori b<br />
a Department <strong>of</strong> Engineering Mechanics and Energy, University <strong>of</strong> Tsukuba, Tsukuba 305-8573, Japan<br />
b Japan Aerospace Exploration Agency, Mitaka 6-13-1, Japan<br />
The effect <strong>of</strong> temperature on the constant fatigue life (CFL) diagram for a woven fabric carbon/epoxy quasi-isotropic<br />
laminate has been examined. Constant amplitude fatigue tests are first performed at different stress ratios on coupon<br />
specimens at room temperature (RT), 100 and 150 o C, respectively. The experimental results show that the CFL diagram<br />
for the woven CFRP laminate, which is plotted in the plane <strong>of</strong> mean and alternating stresses, becomes asymmetric about<br />
the alternating stress axis, and the CFL envelope for a given constant value <strong>of</strong> life can be described using a curve over a<br />
range <strong>of</strong> fatigue cycles, regardless <strong>of</strong> test temperature. The CFL envelopes for all these test temperatures take their peaks<br />
approximately at the same stress ratio “critical stress ratio” that is given by the ratio <strong>of</strong> compressive strength to tensile<br />
one. Then, these experimental CFL diagrams are compared with the predictions using the anisomorphic CFL diagram<br />
approach that allows constructing the asymmetric and nonlinear CFL diagram for a given <strong>composite</strong> on the basis <strong>of</strong> the<br />
static strengths in tension and compression and the reference S-N relationship for the critical stress ratio. It is<br />
demonstrated that the anisomorphic CFL diagram approach can successfully be employed for predicting the CFL diagram<br />
and thus for predicting the S-N relationships for the woven CFRP laminate at any stress ratios regardless <strong>of</strong> test<br />
temperature.<br />
Keywords: CFRP; S-N curve; Stress Ratio; Constant <strong>Fatigue</strong> life (CFL) Diagram; Anisomorphic CFL Diagram; High Temperature; Critical Stress<br />
Ratio<br />
1. Introduction<br />
Accurate prediction <strong>of</strong> constant amplitude fatigue lives <strong>of</strong> <strong>composite</strong>s for any stress ratios as well as<br />
for any amplitude levels is a vital prerequisite to a successful fatigue life analysis <strong>of</strong> <strong>composite</strong><br />
structures. The fatigue load that should be withstood by the structural components made <strong>of</strong> <strong>composite</strong>s<br />
is characterized by changes in the amplitude, mean, frequency and waveform <strong>of</strong> stress cycling during<br />
service. These mechanical factors characterizing fatigue load are well known to have significant<br />
influences on the fatigue lives <strong>of</strong> glass and carbon fiber-reinforced polymer matrix <strong>composite</strong>s [1-3].<br />
For evaluation <strong>of</strong> the effect <strong>of</strong> <strong>loading</strong> mode on the sensitivity to fatigue <strong>of</strong> <strong>composite</strong>s, however, a large<br />
number <strong>of</strong> fatigue experiments for many different kinds <strong>of</strong> cyclic <strong>loading</strong> are needed. They consume<br />
considerable time and cost. From a practical point <strong>of</strong> view, therefore, it is required to develop a time -<br />
and cost-saving procedure for identifying the <strong>loading</strong> mode dependence <strong>of</strong> the fatigue strength <strong>of</strong><br />
* Corresponding author.<br />
E-mail addresses: mkawai@kz.tsukuba.ac.jp
26<br />
Fifth International Conference on <strong>Fatigue</strong> <strong>of</strong> Composites<br />
<strong>composite</strong>s with reasonable accuracy on the basis <strong>of</strong> a limited number <strong>of</strong> tests. Establishment <strong>of</strong> a<br />
theoretical method for predicting the S-N curves for <strong>composite</strong>s <strong>under</strong> constant amplitude fatigue<br />
<strong>loading</strong> at any stress ratios is a definite contribution to this demand.<br />
To predicting the S-N curve for constant amplitude fatigue <strong>loading</strong> at a given stress ratio, there are<br />
two kinds <strong>of</strong> approaches developed so far: (1) the approach using a master S-N relationship; (2) the<br />
approach using a constant fatigue life (CFL) diagram, typically plotted in the plane <strong>of</strong> alternating and<br />
mean stresses.<br />
The master S-N curve approach has successfully been applied, for example, by Ellyin and El Kadi [4]<br />
and Kawai et al. [5-9] to prediction <strong>of</strong> the <strong>of</strong>f-axis fatigue lives <strong>of</strong> unidirectional <strong>composite</strong>s not only for<br />
different fiber orientations but also for different values <strong>of</strong> stress ratio. In the master S-N curve approach,<br />
a fatigue failure criterion for <strong>composite</strong>s is formulated on the basis <strong>of</strong> a master S-N curve into which the<br />
S-N curves for different cyclic <strong>loading</strong> conditions collapse with the aid <strong>of</strong> an effective measure <strong>of</strong><br />
fatigue strength. The master S-N curve approach thus relies on an effective fatigue strength measure that<br />
makes the effect <strong>of</strong> mechanical factors on the S-N curves for <strong>composite</strong>s invisible. Ellyin and El Kadi [4]<br />
prescribed the master S-N curve using the elastic strain energy associated with fatigue <strong>loading</strong>. Kawai et<br />
al. [5-9] defined the master S-N curve by taking advantage <strong>of</strong> a non-dimensional effective stress based<br />
on the Tsai-Hill static failure criterion [10]. A different measure to define a fatigue master curve for<br />
<strong>composite</strong>s has also been proposed and validated by Caprino and D‟Amore [11], Caprino and Giorleo<br />
[12], and D‟Amore et al. [13]. However, it is not straightforward in general to define an effective<br />
measure <strong>of</strong> fatigue strength by which the fatigue data for a given <strong>composite</strong> material at different stress<br />
ratios collapse into a single master S-N relationship.<br />
Incidentally, it is interesting to view a similar approach for conventional materials in a historical<br />
perspective. Different forms <strong>of</strong> equivalent stress amplitudes to identify a single controlling S-N<br />
relationship have been given, for example, by the Goodman equation [14], the Smith-Watson-Topper<br />
(SWT) parameter [15], and the Walker parameter [16]. These equivalent stress amplitudes yield the<br />
fatigue models based on the master S-N curve approach. The use <strong>of</strong> these equivalent stress amplitudes<br />
in fatigue modeling implicitly assumes that the master S-N curve is identified with the S-N curve for R<br />
= -1. In the case for <strong>composite</strong> materials, however, these effective stress amplitudes and the <strong>under</strong>lying<br />
assumption that the master S-N relationship always corresponds to a single stress ratio should be<br />
probed.<br />
In contrast to the master S-N curve approach, the CFL diagram approach allows easily<br />
accommodating itself to the mean stress sensitivity observed by experiment. Therefore, it is considered<br />
that the CFL diagram approach is a more practical method especially for the problems dealing with a<br />
non-Goodman type <strong>of</strong> fatigue behavior <strong>of</strong> <strong>composite</strong>s. Harris et al. [17-21] examined the CFL diagrams<br />
for CFRP laminates for various stress ratios, and showed that the CFL envelopes for different values <strong>of</strong><br />
life are asymmetric and nonlinear, and their peak positions are slightly <strong>of</strong>fset to the right <strong>of</strong> the<br />
alternating stress axis. The experimental results obtained by Ramani and Williams [22] indicated that<br />
the maxima <strong>of</strong> the asymmetric CFL envelopes they observed are associated with a stress ratio which is<br />
not equal to R = –1 but almost equal to the ratio <strong>of</strong> compressive strength to tensile one. In fact, Boller
M Kawai, Y Matuda, etc. / Constant <strong>Fatigue</strong> Life Diagrams for a Woven CFRP Laminate at Room and High Temperatures<br />
[23, 24] had already reported all these features <strong>of</strong> the CFL diagrams for <strong>composite</strong>s in the early days <strong>of</strong><br />
<strong>composite</strong> fatigue exploration. These experimental observations suggest that the mean stress sensitivity<br />
in fatigue <strong>of</strong> <strong>composite</strong>s <strong>of</strong>ten deviates from that predicted on the basis <strong>of</strong> the Goodman‟s assumption.<br />
A method for describing the full shape <strong>of</strong> the asymmetric and nonlinear CFL diagram for CFRP<br />
laminates has been developed by Harris et al. [17-21]. They found that the asymmetric and nonlinear<br />
CFL diagrams for the CFRP laminates can approximately be described using nested bell-shaped curves,<br />
and developed a formula for describing the bell-shape CFL diagram for <strong>composite</strong>s. Kawai et al. [25, 26]<br />
also discussed the same issue and proposed an asymmetric and piecewise nonlinear CFL diagram for<br />
CFRP laminates; it was called an anisomorphic CFL diagram. The anisomorphic CFL diagram approach<br />
takes into account the gradual change in shape <strong>of</strong> CFL curves as well as the occurrence <strong>of</strong> peak <strong>of</strong><br />
alternating stress amplitude at a non-zero mean stress, and it was shown to be valid for the<br />
fiber-dominated fatigue failure in quasi-isotropic [45/90/-45/0]2S and [0/60/-60]2S carbon/epoxy<br />
laminates and in a cross-ply [0/90]3S carbon/epoxy laminate [26]. The anisomorphic CFL diagram has a<br />
great advantage in efficient identification <strong>of</strong> the mean stress sensitivity in fatigue <strong>of</strong> <strong>composite</strong>s over<br />
existing methods, and it can be built using only the static strengths in tension and compression and the<br />
reference S-N relationship fitted to the fatigue data obtained at a particular stress ratio which is equal to<br />
the ratio <strong>of</strong> compressive strength to tensile one; it is called the critical stress ratio.<br />
Recently, the anisomorphic CFL diagram approach was shown to be applicable to prediction <strong>of</strong> the<br />
matrix-dominated fatigue life <strong>of</strong> carbon/epoxy angle-ply laminates [27]. However, the validity <strong>of</strong> the<br />
anisomorphic CFL diagram approach to prediction <strong>of</strong> S-N curves for any stress ratios has been<br />
evaluated only for the fatigue failure in non-woven carbon/epoxy laminates at room temperature. In the<br />
fatigue design <strong>of</strong> <strong>composite</strong> structures, we <strong>of</strong>ten need to predict the fatigue lives <strong>of</strong> <strong>composite</strong>s that are<br />
exposed to different temperatures. From a view to developing it to an engineering tool for fatigue<br />
analysis <strong>of</strong> <strong>composite</strong>s, therefore, the anisomorphic CFL diagram approach should further be checked<br />
for applicability not only to different kinds <strong>of</strong> <strong>composite</strong>s with different sensitivities to fatigue but also<br />
to a given <strong>composite</strong> at different temperatures.<br />
In the present study, the anisomorphic CFL diagram approach [24-27] is tested for applicability to<br />
prediction <strong>of</strong> fatigue life <strong>of</strong> a woven fabric carbon/epoxy quasi-isotropic laminate at different<br />
temperatures. First, constant amplitude fatigue tests at different stress ratios are performed at room and<br />
high temperatures; T = RT, 100 and 150 o C. By using the fatigue test results, the stress ratio sensitivity in<br />
fatigue and the effect <strong>of</strong> temperature on the shape <strong>of</strong> the CFL diagram for the woven fabric laminate are<br />
elucidated. Then, for each <strong>of</strong> the test temperatures, the anisomorphic CFL diagram is constructed using<br />
the static strengths in tension and compression and the reference S-N relationship for the critical stress<br />
ratio, and compared with the experimental CFL diagram. Finally, the S-N curves for different stress<br />
ratios are predicted using the anisomorphic CFL diagram and compared with S-N data to assess the<br />
theoretical method in regard to its applicability to S-N curve prediction.<br />
27
28<br />
2. Material and testing procedure<br />
2.1 Material and specimen<br />
Fifth International Conference on <strong>Fatigue</strong> <strong>of</strong> Composites<br />
The material used in this study was the plain weave roving fabric carbon/epoxy <strong>composite</strong><br />
QFC133-6E01A manufactured by TORAY. The woven fabric <strong>composite</strong>s were laid up by hand to<br />
fabricate the quasi-isotropic laminates with the 12-ply lay-up sequence <strong>of</strong> [(±45)/(0/90)]3S, and then<br />
they were cured in an autoclave at 350 o F (176.6 o C). The nominal thickness <strong>of</strong> as-received laminates was<br />
about 2.4 mm.<br />
Two kinds <strong>of</strong> coupon specimens with different nominal dimensions were utilized. For static tension<br />
tests and tension-tension (T-T) fatigue tests in which only tensile load is applied to specimens, the long<br />
specimens based on the testing standards JIS K7073 [28] and JIS K7083 [29] were employed; as shown<br />
in Fig. 1(a), the dimensions were gauge length LG = 100 mm and width W = 20 mm. For static<br />
compression tests and compression-compression (C-C) and tension-compression (T-C) fatigue tests,<br />
short specimens were used to reduce the risk <strong>of</strong> buckling <strong>of</strong> specimens due to compressive <strong>loading</strong><br />
involved; as shown in Fig. 1(b), the dimensions were gauge length LG = 10 mm and width W = 10 mm.<br />
The nominal dimensions <strong>of</strong> the compressive specimens were determined on the basis <strong>of</strong> the testing<br />
standards JIS K7076 [30] and the report <strong>of</strong> Harberle and Matthews [31] that discussed compression test<br />
methods suitable for <strong>composite</strong> laminates.<br />
20<br />
10<br />
50 100<br />
50<br />
(a) Gauge length 100 mm<br />
45 10 45<br />
(b) Gauge length 10 mm<br />
Fig. 1. Specimen geometry (dimension in mm).<br />
For testing at room temperature (RT), rectangular-shaped aluminum alloy tabs were glued on both<br />
ends <strong>of</strong> specimens with epoxy adhesive (Araldite) in order to protect their gripped portions. The<br />
thickness <strong>of</strong> end-tabs was 1.0 mm for the tensile specimens and 2.0 mm for the compressive specimens.<br />
In the T-T fatigue tests at 100 o C and the T-T and T-C fatigue tests at 150 o C, however, untabbed<br />
specimens were finally employed, since slipping <strong>of</strong> end-tabs happened during fatigue tests and it could<br />
not be avoided. The test data for untabbed specimens were used for discussion <strong>of</strong> this study; since the 0 o<br />
layers <strong>of</strong> the laminate used in this study are protected by the ±45 o layers on the surface, a harmful effect
M Kawai, Y Matuda, etc. / Constant <strong>Fatigue</strong> Life Diagrams for a Woven CFRP Laminate at Room and High Temperatures<br />
<strong>of</strong> directly gripping <strong>of</strong> the ends <strong>of</strong> specimens is not much significant.<br />
2.2 Testing procedure<br />
Constant amplitude fatigue tests were performed <strong>under</strong> load control at room temperature (RT) and at<br />
high temperatures (100 and 150 o C). <strong>Fatigue</strong> load was applied to specimens in a sinusoidal waveform<br />
with a constant frequency <strong>of</strong> 10 Hz; the fatigue <strong>loading</strong> condition is based on the testing standard JIS<br />
K7083 [29]. Most specimens were fatigue tested for up to 10 6 cycles, and the fatigue tests that lasted<br />
over this limit were terminated prior to fracture. In this study, fatigue tests were first performed for five<br />
kinds <strong>of</strong> stress ratios: R = 0.1, 0.5, 10, -1 and to elucidate the effect <strong>of</strong> stress ratio on fatigue life.<br />
A particular value <strong>of</strong> stress ratio , which is called the critical stress ratio [25-27], is defined as the<br />
ratio <strong>of</strong> compressive strength C (< 0) to tensile one T<br />
(> 0); i.e. = / . In order to identify<br />
the tensile and compressive strengths <strong>of</strong> the woven carbon/epoxy quasi-isotropic laminate, static tension<br />
and compression tests were performed at the test temperatures (RT, 100 and 150 o C) prior to fatigue<br />
testing. The static tests were carried out at a constant rate <strong>of</strong> 1.0%/min until the specimens fractured,<br />
following the testing standards JIS K7073 [28].<br />
C T<br />
Static and fatigue tests were conducted in a servo hydraulic MTS-810 testing machine. For raising the<br />
temperature <strong>of</strong> a specimen, a heating chamber with a precise digital control capability was employed.<br />
Each specimen was clamped in the heating chamber by the high temperature hydraulic wedge grips<br />
fitted on the testing machine, and it was heated up to a prescribed test temperature in air without<br />
applying load and preconditioned in the test environment for 1 h prior to testing. Variation <strong>of</strong> specimen<br />
temperature in time from the prescribed value was less than 1.0 o C. Humidity in the heating chamber<br />
was not controlled. The longitudinal and lateral strains <strong>of</strong> each specimen were measured using strain<br />
gauges that were mounted back to back at its center. Measurement <strong>of</strong> the longitudinal strain <strong>of</strong> a<br />
specimen was complemented by a linear variable differential transformer (LVDT) on the testing<br />
machine and by a two-camera video extensometer (DVE-201, SHIMAZU).<br />
3. Experimental results and discussion<br />
The in-plane specimen coordinate system is denoted as (x, y). The x-axis is taken in the <strong>loading</strong><br />
direction.<br />
3.1 Static tensile and compressive behavior<br />
The axial stress-strain relationships for the woven CFRP laminate that were obtained from tension<br />
tests at RT, 100 and 150 o C are shown in Fig. 2. Since only the displacement measurement using DVE<br />
was available in testing at 150 o C, Fig. 2 adopted nominal strain in common for all the test temperatures.<br />
The stress-strain relationships at RT and 100 o C are linear until ultimate fracture. In contrast, the<br />
stress-strain relationship at 150 o C has a knee point and thus its overall shape becomes nonlinear. The<br />
reproducibility <strong>of</strong> the yielding behavior at 150 o C has been confirmed. In Fig. 2, it is also seen that as<br />
temperature increases, the axial tensile modulus becomes smaller and the fracture strain tends to become<br />
29
30<br />
larger.<br />
Axial stress x , MPa<br />
Fifth International Conference on <strong>Fatigue</strong> <strong>of</strong> Composites<br />
1000<br />
800<br />
600<br />
400<br />
200<br />
Woven CFRP laminate<br />
[(±45)/(0/90)] 3s<br />
Experimental<br />
1.0%/min<br />
DVE<br />
0<br />
0 0.5 1 1.5 2<br />
Axial strain x , %<br />
RT<br />
Tension<br />
100¼C<br />
150¼C<br />
Fig. 2. Tensile stress-strain relationships at different temperatures.<br />
No significant difference was found between the ultimate tensile failure modes at RT and 100 o C.<br />
The tensile specimens tested at RT and 100 o C failed at a right angle to the <strong>loading</strong> direction, and they<br />
accompanied neither remarkable pull-out <strong>of</strong> fibers nor delamination. In contrast, the tensile specimens<br />
tested at 150 o C failed in a shear mode, and they accompanied local delamination that developed in the<br />
45 o direction or in the ±45 o directions to the <strong>loading</strong> direction. These observations suggest that the<br />
interlaminar and in-plane shear strengths <strong>of</strong> the woven CFRP laminate were significantly reduced by the<br />
exposure to the high temperature <strong>of</strong> 150 o C. It is thus considered that the stress level <strong>of</strong> the knee point<br />
observed in the stress-strain relationship at 150 o C corresponds to the onset <strong>of</strong> local deformation and<br />
failure due to the reduction in strength.<br />
Fig. 3 shows the compressive stress-strain relationships at RT, 100 and 150 o C. The axial compressive<br />
strains shown in this figure are based on the longitudinal displacement <strong>of</strong> actuator that was measured<br />
with LVDT on the testing machine. The reason is that the displacement measurement using DVE was<br />
not successful for the short specimens used in the compression tests. In Fig. 3, it is seen that the tangents<br />
<strong>of</strong> the compressive stress-strain relationships monotonically decrease with increasing strain, regardless<br />
<strong>of</strong> temperature, and thus they exhibit small but clear nonlinearity over the range <strong>of</strong> deformation until<br />
failure. In the compression test at 150 o C, the yielding behavior that appeared in the tension test at the<br />
same temperature was not observed. The compressive elastic modulus decreased with increasing test<br />
temperature, in line with the temperature dependence observed in the tension test results. However, the<br />
fracture strain in compression decreased with increasing test temperature in contrast to the increasing<br />
tendency in tension. The comparison <strong>of</strong> the results in Fig. 2 and Fig. 3 reveals that the reduction in<br />
compressive strength with increasing temperature is more significant than the reduction in tensile<br />
strength. No appreciable difference was observed between the fracture modes in compression at<br />
different temperatures. All the specimens failed in an out-<strong>of</strong>-plane shear mode <strong>under</strong> compression,<br />
regardless <strong>of</strong> test temperature.
M Kawai, Y Matuda, etc. / Constant <strong>Fatigue</strong> Life Diagrams for a Woven CFRP Laminate at Room and High Temperatures<br />
Axial stress x , MPa<br />
-600<br />
-500<br />
-400<br />
-300<br />
-200<br />
-100<br />
0<br />
0<br />
Woven CFRP laminate<br />
[(±45)/(0/90)] 3s<br />
Experimental<br />
1.0%/min<br />
LVDT<br />
-1<br />
-2<br />
150¼C<br />
-3<br />
Axial strain x , %<br />
100¼C<br />
Compression<br />
-4<br />
RT<br />
Fig. 3. Compressive stress-strain relationships at different temperatures.<br />
3.2 Temperature dependence <strong>of</strong> tensile and compressive strengths<br />
The ultimate tensile and compressive strengths <strong>of</strong> the woven CFRP laminate are plotted in Fig. 4 as a<br />
function <strong>of</strong> test temperature. The tensile and compressive strengths at RT, 100 and 150 o C are listed in<br />
Table 1; they are the averages <strong>of</strong> two or three samples.<br />
Table 1. Tensile and compressive strengths <strong>of</strong> [(±45)/(0/90)]3s woven fabric carbon/epoxy laminate at different temperatures<br />
Temperature T (MPa) C<br />
(MPa) (= / )<br />
RT 840.98 –464.69 –0.55<br />
100ºC 813.30 –371.43 –0.46<br />
150ºC 611.95 –215.75 –0.35<br />
Fig. 4 demonstrates that both the tensile and compressive strengths decrease with increasing<br />
temperature. The reduction in strength at high temperature is more significant in compression than in<br />
tension. The ratios <strong>of</strong> compressive strength to tensile one at RT, 100 o C and 150 o C were C / T = 0.55,<br />
0.46, and 0.35, respectively. The reduction in tensile strength in the range from RT to 100 o C is small,<br />
but it turns much larger than before as temperature exceeds 100 o C. By contrast, an appreciable<br />
decreasing tendency can be seen in compression over the whole range from RT to 150 o C. The gradual<br />
decrease in compressive strength with increasing temperature suggests that the compressive strength <strong>of</strong><br />
the woven <strong>composite</strong> is more sensitive to temperature, and it was more significantly affected by the<br />
decrease in stiffness and strength <strong>of</strong> the matrix material due to exposure to high temperature.<br />
A change in the ratio <strong>of</strong> compressive strength to tensile one with temperature means that the critical<br />
stress ratio (i.e., = / ) changes with temperature accordingly. In the construction <strong>of</strong> the<br />
C T<br />
anisomorphic CFL diagram for the woven <strong>composite</strong>, which will be discussed later, the S-N relationship<br />
for the critical stress ratio is used. Therefore, the above observation <strong>of</strong> the change in strength with<br />
temperature suggests that the anisomorphic CFL diagram is affected by temperature.<br />
-5<br />
C T<br />
31
32<br />
3.3 <strong>Fatigue</strong> behavior<br />
Fifth International Conference on <strong>Fatigue</strong> <strong>of</strong> Composites<br />
Fig. 4. Temperature dependence <strong>of</strong> tensile and compressive strengths.<br />
The fatigue data for the stress ratios R = 0.1, 0.5, 10, -1.0, -0.553 (= ) that were obtained from<br />
constant amplitude fatigue tests at RT are shown Fig. 5, as plots <strong>of</strong> maximum fatigue stress level against<br />
the logarithm <strong>of</strong> number <strong>of</strong> reversals to failure log(2 N f ) . Note that while the values <strong>of</strong> max are<br />
plotted for T-T <strong>loading</strong> and T-C <strong>loading</strong> at R = , the absolute values <strong>of</strong> minimum fatigue stress min<br />
are plotted for C-C <strong>loading</strong> and T-C <strong>loading</strong> at R =- 1.<br />
The static tensile strength T and compressive<br />
strength C that were obtained at the same test temperature are plotted at 2N f = 1 as points <strong>of</strong> the<br />
ordinate in the S-N diagram, respectively. The dashed lines in the figure indicate the S-N curves fitted to<br />
the fatigue data. A nonlinear function <strong>of</strong> the same form as Eq. (8), which is presented later, was used to<br />
describe these S-N curves. The S-N curves fitted to the fatigue data help us not only to observe the<br />
similarity and difference in shape between the S-N relationships for different stress ratios, but also to<br />
evaluate the maximum fatigue stress levels for different constant values <strong>of</strong> life that are required to<br />
identify the experimental CFL diagram for the woven CFRP laminate; the construction <strong>of</strong> CFL diagram<br />
is discussed later.<br />
In Fig. 5, it is seen that the S-N relationships at RT greatly depend on stress ratio. The overall<br />
features in the sensitivity to mean stress are similar to those reported so far, e.g. [17-27]. The<br />
sensitivity to fatigue becomes highest <strong>under</strong> T-C <strong>loading</strong> at R = , suggesting that a larger value <strong>of</strong><br />
alternating stress amplitude has a more degrading effect on the fatigue <strong>of</strong> the <strong>composite</strong>. It is also seen<br />
in Fig. 5 that the S-N data for the stress ratios in the range R 1 can approximately be described<br />
by means <strong>of</strong> the smooth dashed curves that are connected with the point indicating the tensile strength.<br />
By contrast, the S-N curves fitted to the fatigue data for T-C ( R = -1 ) and C-C ( R = 10 ) fatigue<br />
<strong>loading</strong> can smoothly be connected to the compressive strength. The specimens are apt to fail in a<br />
compressive mode <strong>under</strong> the completely reversed <strong>loading</strong> condition at R = -1.0 since = -0.55 -<br />
1
M Kawai, Y Matuda, etc. / Constant <strong>Fatigue</strong> Life Diagrams for a Woven CFRP Laminate at Room and High Temperatures<br />
and thus the distance from the minimum fatigue stress to the compressive strength C- is less<br />
min<br />
than the distance from the maximum fatigue stress to the tensile strength T- . max<br />
(| |), MPa<br />
min<br />
max<br />
1000<br />
800<br />
600<br />
400<br />
200<br />
0<br />
10 0<br />
Woven CFRP laminate [(±45)/(0/90)] 3s<br />
UTS<br />
UCS<br />
Experimental<br />
RT 10 Hz<br />
○ R = 0.1 ▲ R = 0.5<br />
◆ = -0.55<br />
□ R = 10 ▼ R = -1<br />
10 1<br />
10 2<br />
10 3<br />
2N f<br />
10 4<br />
10 5<br />
Fig. 5. S-N relationships at room temperature.<br />
The fatigue data presented in Fig. 5 are normalized using the static strengths, in which the tensile<br />
strength is used for R = 0.1, 0.5, and -0.55 ( ) and the compressive strength for R = -1 and 10. The<br />
normalized S-N data, which are plotted in Fig. 6, demonstrate that stress ratio has a marked influence on<br />
the slope <strong>of</strong> S-N relationship. A largest gradient <strong>of</strong> S-N relationship is accompanied by fatigue <strong>loading</strong><br />
at the critical stress ratio R = . This suggests that fatigue damage develops most rapidly <strong>under</strong> fatigue<br />
<strong>loading</strong> at the critical stress ratio.<br />
max / T (| min / C |)<br />
2<br />
1.5<br />
1<br />
0.5<br />
0<br />
10 0<br />
Woven CFRP laminate [(±45)/(0/90)] 3s<br />
Experimental<br />
RT 10 Hz<br />
○ R = 0.1 ▲ R = 0.5<br />
◆ = -0.55<br />
□ R = 10 ▼ R = - 1<br />
10 1<br />
10 2<br />
10 3<br />
2N f<br />
10 4<br />
Fitted<br />
10 5<br />
Fitted<br />
10 6<br />
10 6<br />
Fig. 6. Normalized S-N relationships at room temperature.<br />
Obviously, the slope <strong>of</strong> the S-N relationship for T-T <strong>loading</strong> at R = 0.1 is steeper than that for C-C<br />
<strong>loading</strong> at R = 10. This feature indicates that the reduction in fatigue strength <strong>under</strong> C-C <strong>loading</strong> is less<br />
than that <strong>under</strong> T-T <strong>loading</strong>, and thus fatigue damage develops more slowly <strong>under</strong> C-C <strong>loading</strong>. These<br />
features <strong>of</strong> fatigue failure for the woven CFRP laminate are similar to those for non-woven CFRP<br />
10 7<br />
10 7<br />
33
34<br />
Fifth International Conference on <strong>Fatigue</strong> <strong>of</strong> Composites<br />
laminates [10-17]. The above observations, i.e. the different strengths in tension and compression and<br />
the different sensitivities to fatigue <strong>under</strong> T-T and C-C <strong>loading</strong> conditions, reveal that a CFL diagram<br />
which is given as a plot <strong>of</strong> alternating stress against mean stress becomes asymmetric about the<br />
alternating stress axis.<br />
The fatigue data obtained at 100 o C and 150 o C are shown Fig. 7 and Fig. 8, respectively. The effect <strong>of</strong><br />
stress ratio on the S-N relationship at high temperature is similar to that observed at RT, except the case<br />
for R = 10 at 150 o C. A significant reduction in fatigue strength can be seen at 150 o C <strong>under</strong> fatigue<br />
<strong>loading</strong> at R = 10 in the range <strong>of</strong> life<br />
4<br />
N f 10 . The large reduction in fatigue strength <strong>under</strong> C-C<br />
<strong>loading</strong> at R = 10 is consistent with a significant decrease in compressive strength at 150 o C that was<br />
observed above. The large reduction in static and fatigue strengths in compression suggests a severe loss<br />
<strong>of</strong> load bearing capability <strong>of</strong> the woven CFRP laminate at 150 o C <strong>under</strong> compression, in contrast to a<br />
moderate capability left to sustain static and fatigue loads in tension at the same high temperature.<br />
These observations suggest that an allowable maximum temperature for the woven CFRP laminate<br />
should be determined on the basis <strong>of</strong> the temperature dependence <strong>of</strong> compressive fatigue strength,<br />
especially when it is applied in the design <strong>of</strong> <strong>composite</strong> structures that are required to sustain<br />
compressive fatigue load at elevated temperature.<br />
(| |), MPa<br />
max min<br />
1000<br />
800<br />
600<br />
400<br />
200<br />
0<br />
10 0<br />
Woven CFRP laminate [(±45)/(0/90)] 3s<br />
UTS<br />
UCS<br />
Experimental 100¼C 10 Hz<br />
○ R = 0.1 ▲ R = 0.5<br />
◆ = -0.46<br />
□ R = 10 ▼ R = -1<br />
10 1<br />
3.4 Temperature dependence <strong>of</strong> S-N relationship<br />
10 2<br />
10 3<br />
2N f<br />
10 4<br />
Fig. 7. S-N relationships at 100 o C.<br />
The normalized S-N relationships for the woven CFRP laminate at RT, 100 and 150 o C are compared<br />
10 5<br />
Fitted<br />
in Fig. 9 and Fig. 10 for T-T <strong>loading</strong> at R = 0.1 and C-C <strong>loading</strong> at R = 10, respectively.<br />
Comparing the normalized S-N relationships at RT and 100 o C, we can see that the relative fatigue<br />
strength at 100 o C is smaller than that at RT, regardless <strong>of</strong> stress ratio. This suggests that the fatigue<br />
resistance at 100 o C is lower than that at RT, and thus the fatigue resistance <strong>of</strong> the <strong>composite</strong> is lowered<br />
by the increase in test temperature. In contrast, the relative fatigue strength at 150 o C for T-T <strong>loading</strong> at R<br />
= 0.1 tends to slightly exceed the relative fatigue strength level at 100 o C for the same stress ratio <strong>of</strong> R =<br />
0.1.<br />
10 6<br />
10 7
M Kawai, Y Matuda, etc. / Constant <strong>Fatigue</strong> Life Diagrams for a Woven CFRP Laminate at Room and High Temperatures<br />
(| |), MPa<br />
max min<br />
max / T<br />
800<br />
600<br />
400<br />
200<br />
0<br />
1.5<br />
1<br />
0.5<br />
0<br />
10 0<br />
10 0<br />
Woven CFRP laminate [(±45)/(0/90)] 3s<br />
UTS<br />
UCS<br />
Experimental 150⎫ C 10 Hz<br />
○ R =0.1 ▲ R =0.5<br />
◆ =-0.35 □ R =10 ▼ R =-1<br />
10 1<br />
10 2<br />
10 3<br />
2N f<br />
10 4<br />
Fig. 8. S-N relationships at 150 o C.<br />
10 5<br />
Woven CFRP laminate [(±45)/(0/90)] 3s<br />
Experimental<br />
10 Hz R = 0.1<br />
○ RT<br />
● 100⎫C<br />
× 150⎫C<br />
10 1<br />
10 2<br />
10 3<br />
2N f<br />
10 4<br />
10 5<br />
Fitted<br />
Fitted<br />
Fig. 9. Comparison <strong>of</strong> the normalized S-N relationships at different temperatures (R = 0.1).<br />
max / C<br />
1.5<br />
1<br />
0.5<br />
0<br />
10 0<br />
Woven CFRP laminate [(±45)/(0/90)] 3s<br />
Experimental<br />
10 Hz R = 10<br />
○ RT<br />
● 100⎫C<br />
◇ 150⎫ C with Tab<br />
× 150⎫ C without Tab<br />
10 1<br />
10 2<br />
10 3<br />
2N f<br />
10 4<br />
10 5<br />
10 6<br />
10 6<br />
Fitted<br />
Fig. 10. Comparison <strong>of</strong> the normalized S-N relationships at different temperatures (R = 10).<br />
10 6<br />
10 7<br />
10 7<br />
10 7<br />
35
36<br />
Fifth International Conference on <strong>Fatigue</strong> <strong>of</strong> Composites<br />
As seen in Fig. 10 for C-C <strong>loading</strong> at R = 10, on the other hand, the relative fatigue strength<br />
monotonically decreases with increasing temperature. Only a degrading effect <strong>of</strong> temperature on fatigue<br />
failure is involved by C-C <strong>loading</strong> at R = 10, in contrast to the difference in temperature dependence<br />
between the range from RT to 100 o C and the range from 100 to 150 o C for fatigue <strong>loading</strong> at R = 0.1.<br />
It is worth recalling the observation [32] that the relative fatigue strength <strong>of</strong> CFRP laminate with a<br />
ductile matrix becomes larger than that <strong>of</strong> CFRP laminate with a more brittle matrix. The above<br />
observations in the present study along with the earlier observation just recalled suggest that the<br />
increase in ductility and the decrease in strength for the matrix <strong>of</strong> a given <strong>composite</strong> with increasing<br />
temperature might have a qualitatively different influence on the fatigue failure <strong>of</strong> the <strong>composite</strong> <strong>under</strong><br />
T-T and C-C <strong>loading</strong>.<br />
The experimental results obtained in this study suggest that the maximum temperature below which<br />
the relative fatigue strength <strong>of</strong> the <strong>composite</strong> monotonically decreases with increasing temperature<br />
should lie between 100 o C and 150 o C. It is also expected that the temperature below which the<br />
compressive strength does not rapidly reduce may be found in the range from 100 o C to 150 o C.<br />
The fatigue failure mode was similar to the observation in the previous study [17]. More significant<br />
pull-out <strong>of</strong> fibers, fracture into small pieces, and delamination were observed in the specimens that<br />
failed in fatigue, compared with those failed in static load. No clear difference was seen between the<br />
fatigue failure modes at RT and 100 o C. In the specimens fatigue failed at 150 o C, however, a little more<br />
significant fiber fracture into small pieces and a more extensive delamination were observed.<br />
4. <strong>Fatigue</strong> life prediction using anisomorphic CFL diagram<br />
A constant fatigue life (CFL) diagram, in which alternating stress a is plotted against mean stress<br />
m for different constant values <strong>of</strong> life, is a useful engineering tool for efficient fatigue analysis <strong>of</strong> a<br />
given material. The experimental results for the fatigue failure <strong>of</strong> non-woven CFRP laminates [17-21,<br />
26] reveal that (1) the shape <strong>of</strong> CFL envelope gradually changes from a straight line to a nonlinear curve<br />
as the constant value <strong>of</strong> fatigue life increases, and (2) the CFL diagram is <strong>of</strong>ten asymmetric about the<br />
alternating stress axis in the m a -plane. These experimental facts elucidate that a linear and<br />
symmetric CFL diagram, i.e. the Goodman diagram [14], which is based on the S-N relationship for R =<br />
-1 cannot always be applied with good accuracy to the fatigue life analysis <strong>of</strong> <strong>composite</strong>s. In order to<br />
establish a theoretical CFL diagram that is suitable for <strong>composite</strong>s, therefore, challenging studies have<br />
been attempted [17-21, 25-27].<br />
The anisomorphic CFL diagram approach, which was recently proposed by Kawai and coworkers<br />
[25-27] with a view to developing an efficient engineering tool for preliminary fatigue life analysis <strong>of</strong><br />
<strong>composite</strong>s, enables us to take into account all these characteristics <strong>of</strong> the CFL diagrams for carbon fiber<br />
<strong>composite</strong>s. This engineering method was shown to be valid not only for the fiber-dominated fatigue [26]<br />
but also for the matrix-dominated fatigue [27] in non-woven carbon/epoxy laminates. In this study, the<br />
anisomorphic CFL diagram approach is further tested for the fatigue failure <strong>of</strong> the woven CFRP<br />
laminate at different temperatures.
M Kawai, Y Matuda, etc. / Constant <strong>Fatigue</strong> Life Diagrams for a Woven CFRP Laminate at Room and High Temperatures<br />
4.1 Anisomorphic CFL diagram<br />
The anisomorphic CFL diagram is the first to consider a family <strong>of</strong> piecewise nonlinear fatigue failure<br />
envelopes for different constant values <strong>of</strong> life in the -plane. m a The anisomorphic CFL envelope for a<br />
given constant value <strong>of</strong> life N f is composed <strong>of</strong> two smooth curves that are independently defined in<br />
the two segments <strong>of</strong> mean stress. It is assumed that these two domains <strong>of</strong> mean stress are associated<br />
with the T-T and C-C dominated fatigue failure <strong>of</strong> a given <strong>composite</strong>, respectively. The two smooth<br />
curves are smoothly connected with each other at a point<br />
the constant amplitude ratio<br />
a 1-<br />
<br />
=<br />
1+<br />
<br />
m<br />
( ) ( )<br />
( m , a )<br />
on the radial straight line with<br />
Note that the critical stress ratio = / always takes a negative value, i.e. 0 . The<br />
coordinates<br />
and<br />
( )<br />
a<br />
( )<br />
m<br />
C T<br />
correspond to the peak point <strong>of</strong> the anisomorphic CFL envelope for a<br />
given value <strong>of</strong> life N f . They designate the alternating and mean stresses during constant amplitude<br />
fatigue <strong>loading</strong> at the critical stress ratio , and the values at a given value <strong>of</strong> life N f can be<br />
calculated as<br />
where<br />
37<br />
(22)<br />
( ) 1 ( )<br />
a = ( 1-<br />
) max<br />
(23)<br />
2<br />
( ) 1 ( )<br />
m = ( 1+<br />
) max<br />
(24)<br />
2<br />
( )<br />
max is the maximum fatigue stress associated with a constant value <strong>of</strong> life f<br />
fatigue <strong>loading</strong> at the critical stress ratio , and it conforms with the following relation:<br />
( ) ( ) ( )<br />
max m a<br />
N <strong>under</strong> T-C<br />
= + <br />
(25)<br />
The nested equi-life envelopes <strong>of</strong> the anisomorphic CFL diagram depend on the value <strong>of</strong> life, and<br />
they are different in shape. Mathematically, the CFL envelopes are described by means <strong>of</strong> the following<br />
piecewise-defined function [25-27]:<br />
k<br />
( )<br />
2 T<br />
<br />
-<br />
<br />
m <br />
<br />
- m<br />
( )<br />
,<br />
( )<br />
( ) m m <br />
T<br />
a - <br />
a T<br />
-m<br />
<br />
- = ( ) k<br />
( )<br />
2 C<br />
<br />
<br />
a<br />
<br />
-<br />
m -<br />
m<br />
( )<br />
, ( ) <br />
C mm C -m<br />
<br />
where T (> 0) and C (< 0) are the tensile and compressive strengths <strong>of</strong> a given <strong>composite</strong>,<br />
respectively.<br />
The scalar quantity in Eq. (5) is defined as<br />
T<br />
(26)<br />
( )<br />
max = (27)
38<br />
Fifth International Conference on <strong>Fatigue</strong> <strong>of</strong> Composites<br />
It is important to note that is not a constant but a variable. In fact, is the fatigue strength ratio<br />
[9] for cyclic <strong>loading</strong> at the critical stress ratio , and it takes a value in the range [0, 1]. The fatigue<br />
strength ratio is described as a monotonic continuous function <strong>of</strong> N f ; i.e.<br />
2 Nf= f( )<br />
(28)<br />
The function given by Eq. (7) defines the normalized S-N curve for fatigue <strong>loading</strong> at the critical<br />
stress ratio, which is obvious from the definition <strong>of</strong> given by Eq. (6). The normalized S-N curve<br />
defined by Eq. (7) is an essential prerequisite for constructing the anisomorphic CFL diagram, and thus<br />
it is called the (normalized) reference S-N curve for a given <strong>composite</strong> laminate. The reference S-N<br />
-1<br />
curve can be identified by fitting the function = f (2 N ) to the experimental normalized plot <strong>of</strong><br />
max / T versus f<br />
<br />
f<br />
N for fatigue <strong>loading</strong> at the critical stress ratio R = . To this end, we can<br />
conveniently use a function <strong>of</strong> the following form:<br />
2N<br />
1 1<br />
=<br />
K<br />
1-<br />
( ) -(<br />
L)<br />
f n b<br />
<br />
where the angular brackets denote the singular function defined as x max0, x<br />
<br />
a<br />
= , ( L)<br />
(29)<br />
is a<br />
normalized fatigue limit, and it is determined, as in the other constants K , n , a and b , by fitting<br />
Eq. (8) to the reference fatigue data for the critical stress ratio.<br />
The exponents T k and k C in the formulas play a role to adjust the rate <strong>of</strong> change in the shape <strong>of</strong><br />
CFL curves from a straight line to a parabola for the right and left CFL curves, respectively. This<br />
function <strong>of</strong> the anisomorphic CFL diagram, which was added in [27] allows us to describe the CFL<br />
envelopes that remain almost linear over a range <strong>of</strong> fatigue life. Incidentally, Eq. (5) can be reduced to<br />
the formulas that define the original anisomorphic CFL diagram if the adjusting function is made <strong>of</strong>f by<br />
taking as k = k = 1.<br />
If k = k = 0 , then Eq. (5) predicts the inclined Goodman diagram [18].<br />
T C<br />
T C<br />
4.2 Comparison with experimental CFL diagrams<br />
Applicability <strong>of</strong> the original form <strong>of</strong> the anisomorphic CFL diagram ( k = k = 1)<br />
is first discussed.<br />
T C<br />
The anisomorphic CFL diagram for the woven CFRP laminate at RT is shown in Fig. 11 by dashed lines,<br />
together with the experimental CFL data indicated by symbols. The material constants involved by the<br />
approximate function [i.e. Eq. (8)] that represents the reference fatigue data at the critical stress ratio<br />
were determined as listed in Table 2. The coordinates <strong>of</strong> the experimental CFL data in the -plane<br />
m a<br />
were calculated using the maximum fatigue stresses for the selected values <strong>of</strong> life f N = 101 , 10 2 , 10 3 ,<br />
10 4 , 10 5 , and 10 6 ; those maximum fatigue stresses were evaluated using the approximate curves fitted to<br />
fatigue data that are shown in dashed line in Fig. 5. The solid line in Fig. 11 is obtained by connecting<br />
peak peak<br />
the maximum stress point ( , ) = ((1/ 2)(1 + ) , (1/ 2)(1 - ) ) on the radial line<br />
m a<br />
T T<br />
associated with the critical stress ratio and two points ( C,<br />
0) and ( T , 0) on the m -axis.
M Kawai, Y Matuda, etc. / Constant <strong>Fatigue</strong> Life Diagrams for a Woven CFRP Laminate at Room and High Temperatures<br />
a , MPa<br />
1000<br />
500<br />
Experimental<br />
RT 10 Hz<br />
◆ N f =10 1<br />
△ N f =10 2<br />
■ N f =10 3<br />
◇ N f =10 4<br />
▲ N f =10 5<br />
□ N f =10 6<br />
R = 10<br />
R = -1<br />
= -0.55<br />
R = 0.1<br />
0<br />
-1000 -500 0 500 1000<br />
m , MPa<br />
Fig. 11. Anisomorphic CFL diagram at room temperature.<br />
Woven CFRP laminate<br />
[(±45)/(0/90)] 3s<br />
Predicted<br />
R = 0.5<br />
Table 2. Material constants involved by the approximate functions for the reference S-N curves at different temperatures<br />
Temperature 2 K n a b ( L)<br />
RT 7.0×10 -3 8 1.35 0.3 0.29<br />
100 o C 2.0×10 -2 7.8 1.5 0.4 0.25<br />
150 o C 0.1 1.5 1 4 0.265<br />
From Fig. 11, it is seen that the anisomorphic CFL diagram agrees well with the experimental CFL<br />
diagram in the tested range <strong>of</strong> fatigue life. Therefore, this observation proves that the anisomorphic<br />
CDL diagram approach can be applied to the woven CFRP laminate at RT as well as to the non-woven<br />
CFRP laminates at RT [25, 26]. The experimental results obtained from this study elucidate that the CFL<br />
diagram for the woven CFRP laminate at RT is asymmetric about the alternating stress axis, and the<br />
peaks <strong>of</strong> the CFL envelopes for different constant values <strong>of</strong> life appear <strong>under</strong> fatigue <strong>loading</strong> at a stress<br />
ratio close to the critical stress ratio =- 0.55 . These features in the woven CFRP laminate are similar<br />
to those for the non-woven CFRP laminates that were observed in the previous study [25, 26].<br />
The S-N relationships predicted using the anisomorphic CFL diagram are compared with the<br />
experimental results. Figs. 12(a) and (b) show comparisons between the predicted and experimental S-N<br />
relationships for different stress ratios at room temperature; in these figures, predictions are indicated in<br />
solid lines. Except for slightly conservative predictions <strong>of</strong> fatigue lives for R = 0.5, the predicted S-N<br />
curves agree well with the observed S-N relationships. Note that the calculations for R = 0.1, 10, 0.5,<br />
and -1 give pure predictions using the anisomorphic CFL diagram, since the fatigue data for these stress<br />
ratios are not used for the construction <strong>of</strong> the anisomorphic CFL diagram. Therefore, we can evaluate<br />
the predictive accuracy <strong>of</strong> the anisomorphic CFL diagram approach by comparing the predictions with<br />
the fatigue data for these stress ratios.<br />
<br />
39
40<br />
max , MPa<br />
| min |, MPa<br />
Fifth International Conference on <strong>Fatigue</strong> <strong>of</strong> Composites<br />
1000<br />
800<br />
600<br />
400<br />
200<br />
0<br />
600<br />
500<br />
400<br />
300<br />
200<br />
100<br />
0<br />
10 0<br />
10 0<br />
Woven CFRP laminate [(±45)/(0/90)] 3s<br />
Experimental<br />
RT 10 Hz<br />
○ R = 0.1<br />
▲ R = 0.5<br />
10 1<br />
10 2<br />
10 3<br />
2N f<br />
(a) R = 0.1, 0.5<br />
10 4<br />
Predicted<br />
10 5<br />
Woven CFRP laminate [(±45)/(0/90)] 3s<br />
Experimental<br />
RT 10 Hz<br />
□ R = 10<br />
▼ R = -1<br />
10 1<br />
10 2<br />
10 3<br />
2N f<br />
(b) R = -1, 10<br />
10 4<br />
10 5<br />
10 6<br />
Predicted<br />
Fig. 12. Comparison between the predicted and experimental S-N relationships at room temperature.<br />
The anisomorphic CFL diagram for fatigue <strong>loading</strong> at 100 o C was also compared with the<br />
experimental results. From the comparisons, it was found that the asymmetric and nonlinear CFL<br />
diagram for the woven CFRP laminate at 100 o C can adequately be predicted by the anisomorphic CFL<br />
diagram approach.<br />
The test results reveal that as far as the range <strong>of</strong> temperature from RT to a certain temperature<br />
between 100 o C and 150 o C is concerned, the woven CFRP laminate tested in this study exhibits<br />
monotonic reduction in static and fatigue strength with temperature and no significant collapse in<br />
compressive fatigue strength. In that temperature range, the anisomorphic CFL diagram approach allows<br />
adequately predicting the CFL diagram for any temperature and S-N relationships for any stress ratios.<br />
5. Conclusions<br />
The CFL diagrams for a woven fabric carbon/epoxy quasi-isotropic [(±45)/(0/90)]3S laminate at<br />
10 6<br />
10 7<br />
10 7
M Kawai, Y Matuda, etc. / Constant <strong>Fatigue</strong> Life Diagrams for a Woven CFRP Laminate at Room and High Temperatures<br />
different temperatures, i.e. RT, 100 and 150 o C, were identified. For each test temperature, the CFL<br />
diagram was predicted using the anisomorphic CFL diagram approach, and the predicted CFL diagram<br />
was compared with the experimental CFL diagram. The S-N relationships for different stress ratios were<br />
also predicted using the anisomorphic CFL diagram approach and the accuracy <strong>of</strong> prediction was<br />
evaluated by comparing with the experimental S-N relationships. The results obtained can be<br />
summarized as follows:<br />
(1) The CFL diagram for the woven CFRP laminate at RT is nonlinear and asymmetric about the<br />
alternating stress axis. The CFL envelope gradually changes in shape from a straight line to a<br />
nonlinear curve as the constant value <strong>of</strong> life increases. The peaks <strong>of</strong> nested CFL envelopes<br />
correspond to fatigue <strong>loading</strong> at the critical stress ratio. The appearance <strong>of</strong> the peaks <strong>of</strong> CFL<br />
envelopes at the critical stress ratio indicates that fatigue deterioration in the woven CFRP laminate<br />
occurs most significantly <strong>under</strong> fatigue <strong>loading</strong> at the critical stress ratio. All these features are in<br />
line with those observed for non-woven CFRP laminates at RT [26].<br />
(2) Similar features are exhibited by the CFL diagrams that were identified by fatigue testing at high<br />
temperatures: 100 o C and 150 o C.<br />
(3) The experimental CFL diagram shrinks as temperature increases since the tensile and compressive<br />
strengths decrease with increasing temperature. The CFL diagrams at different temperatures are<br />
thus nested.<br />
(4) The absolute value <strong>of</strong> the critical stress ratio decreases with increasing test temperature. This<br />
results in the CFL diagram inclining toward the right segment <strong>of</strong> positive mean stress.<br />
(5) The anisomorphic CFL diagram can successfully be employed to predict the experimental CFL<br />
diagrams for the woven CFRP laminate at the three test temperatures (RT, 100 and 150 o C), except<br />
the case for R = 10 at 150 o C. The S-N relationships predicted by the anisomorphic CFL diagram<br />
approach agree well with the experimental results for those cases accordingly.<br />
(6) The disagreement between the predicted and experimental results for R = 10 at 150 o C may be<br />
ascribed to a significant reduction in the compressive fatigue strength <strong>of</strong> the woven CFRP laminate.<br />
In contrast, the tensile fatigue strength is reduced moderately even at 150 o C, and thus no serious<br />
deterioration in the accuracy <strong>of</strong> prediction <strong>of</strong> life occurs for tension-dominated fatigue <strong>loading</strong>.<br />
(7) The relative fatigue strength <strong>of</strong> the woven CFRP laminate <strong>under</strong> T-T <strong>loading</strong> is reduced by<br />
increasing temperature from RT to 100 o C, regardless <strong>of</strong> the value <strong>of</strong> stress ratio. In contrast, the<br />
relative fatigue strength for T-T <strong>loading</strong> at R = 0.1 at 150 o C tends to slightly exceed the level for R<br />
= 0.1 at 100 o C. Therefore, the fatigue strength <strong>of</strong> the woven CFRP laminate exhibits the normal<br />
temperature dependence in the range from RT to a certain temperature between 100 o C and 150 o C.<br />
No significant collapse in compressive fatigue strength is likely to occur in the temperature range.<br />
Therefore, it is considered that the anisomorphic CFL diagram approach can be applied to the<br />
woven CFRP laminate for adequately predicting the CFL diagram and the S-N relationships for<br />
any stress ratios at any temperature in that range.<br />
41
42<br />
Acknowledgement<br />
Fifth International Conference on <strong>Fatigue</strong> <strong>of</strong> Composites<br />
This study was supported in part by the Ministry <strong>of</strong> Education, Culture, Sports, Science and<br />
Technology <strong>of</strong> Japan <strong>under</strong> a Grant-in-Aid for Scientific Research (No. 20360050).<br />
References<br />
[1] Hertzberg, R.W., Deformation and Fracture Mechanics <strong>of</strong> Engineering Materials, (1989), p. 467, Wiley.<br />
[2] Sendeckyj, G.P., Life prediction for resin-matrix <strong>composite</strong> materials, (Reifsnider, K.L., editor), <strong>Fatigue</strong> <strong>of</strong> Composite Materials, (1990),<br />
pp. 431-483, Elsevier Science Publishers.<br />
[3] Harris, B., Ed., <strong>Fatigue</strong> in Composites, (2003), Woodhead Publishing Limited, Cambridge UK.<br />
[4] Ellyin, F. and EL-Kadi, H., A fatigue failure criterion for fiber reinforced <strong>composite</strong> laminae, Composite Structures, 15, (1990), 61-74.<br />
[5] Kawai, M., Damage mechanics model for <strong>of</strong>f-axis fatigue behavior <strong>of</strong> unidirectional carbon fiber-reinforced <strong>composite</strong>s at room and high<br />
temperatures, in Massard, T. and Vautrin, A., Proc. <strong>of</strong> 12th Int. Conf. on Composite Materials (ICCM12), Paris, France, July 5-9, (1999), p.<br />
322.<br />
[6] Kawai, M., Yajima, S., Hachinohe, A. and Takano, Y., Off-axis fatigue behavior <strong>of</strong> unidirectional carbon fiber-reinforced <strong>composite</strong>s at<br />
room and high temperatures, Journal <strong>of</strong> Composite Materials, 35(7), (2001), 545-576.<br />
[7] Kawai, M., Yajima, S., Hachinohe, A. and Kawase, Y., High-temperature <strong>of</strong>f-axis fatigue <strong>behaviour</strong> <strong>of</strong> unidirectional carbon<br />
fiber-reinforced <strong>composite</strong>s with different resin matrices, Composites Science and Technology, 61, (2001), 1285-1302.<br />
[8] Kawai, M. and Suda, H., Effects <strong>of</strong> non-negative mean stress on the <strong>of</strong>f-axis fatigue behavior <strong>of</strong> unidirectional carbon/epoxy <strong>composite</strong>s at<br />
room temperature, Journal <strong>of</strong> Composite Materials, 38 (10), (2004), 833-854.<br />
[9] Kawai, M., A phenomenological model for <strong>of</strong>f-axis fatigue behavior <strong>of</strong> unidirectional polymer matrix <strong>composite</strong>s <strong>under</strong> different stress<br />
ratios, Composites, Part A, Vol. 35, No. 7-8, (2004), 955-963.<br />
[10] Azzi, V.D. and Tsai, S.W., Anisotropic strength <strong>of</strong> <strong>composite</strong>s, Experimental Mechanics, 5, (1965), 283-288.<br />
[11] Caprino, G. and D‟Amore, A. Flexural fatigue <strong>behaviour</strong> <strong>of</strong> random continuous-fibre-reinforced thermoplastic <strong>composite</strong>s, Composites<br />
Science and Technology, Vol. 58, (1998), pp. 957-965.<br />
[12] Caprino, G. and Giorleo, G., <strong>Fatigue</strong> lifetime <strong>of</strong> glass fabric/epoxy <strong>composite</strong>s, Composites Part A, Vol. 30, (1999), pp. 299-304.<br />
[13] D‟Amore, A., Caprino, G., Stupak, P., Zhou, J. and Nicolais, L., Effect <strong>of</strong> stress ratio on the flexural fatigue <strong>behaviour</strong> <strong>of</strong> continuous<br />
strand mat reinforced plastics, Science and Engineering <strong>of</strong> Composite Materials, Vol. 5, No. 1, (1996), pp. 1-8.<br />
[14] Goodman, J. Mechanics Applied to Engineering, 1899, Longman Green, Harlow, UK.<br />
[15] Smith, R.N., Watson, P., Topper, T.H., A stress strain function for the fatigue <strong>of</strong> metals, Journal <strong>of</strong> Materials, JMLSA, 1970, 5(4);<br />
767-778.<br />
[16] Walker, K., The effect <strong>of</strong> stress ratio during crack propagation for 2024-T3 and 7075-T6 aluminum, In: Effects <strong>of</strong> environment and<br />
complex load history on fatigue life. ASTM STP 462, 1970, pp.1-14.<br />
[17] Harris, B., Reiter, H., Adam, T., Dickson, R.F., Fernando, G., <strong>Fatigue</strong> <strong>behaviour</strong> <strong>of</strong> carbon fibre reinforced plastics, Composites, Vol. 21,<br />
No. 3, (1990), pp. 232-242.<br />
[18] Adam, T., Gathercole, N., Reiter, H., Harris, B., <strong>Fatigue</strong> life prediction for carbon fibre <strong>composite</strong>s, Advanced Composites Letter, Vol. 1,<br />
(1992), pp. 23-26.<br />
[19] Gathercole, N., Reiter, H., Adam, T., Harris, B., Life prediction for fatigue <strong>of</strong> T800/5245 carbon-fibre <strong>composite</strong>s: I. constant-amplitude<br />
<strong>loading</strong>, <strong>Fatigue</strong>, Vol. 16, (1994), pp. 523-532.<br />
[20] Harris, B., Gathercole, N., Lee, J.A., Reiter, H., Adam, T., Life-prediction for constant-stress fatigue in carbon-fibre <strong>composite</strong>s, Phil.<br />
Trans. R. Soc. London, Vol. A355, (1997), pp. 1259-1294.<br />
[21] Beheshty, M.H., Harris, B., Adam, T., An empirical fatigue-life model for high-performance fibre <strong>composite</strong>s with and without impact<br />
damage, Composites Part A, Vol. 30, (1999), pp. 971-987.<br />
[22] Ramani, S.V. and Williams, D.P., Notched and unnotched fatigue behavior <strong>of</strong> angle-ply graphite/epoxy <strong>composite</strong>s, (Reifsnider, K.L. and<br />
Lauraitis, K.N., editors), <strong>Fatigue</strong> <strong>of</strong> Filamentary Composite Materials, ASTM STP 636, (1977), pp. 27-46.<br />
[23] Boller, K.H., <strong>Fatigue</strong> properties <strong>of</strong> fibrous glass-reinforced plastics laminates subjected to various conditions. Modern Plastics, Vol. 34,<br />
(1957), pp.163-186, 293.<br />
[24] Boller, K.H., <strong>Fatigue</strong> characteristics <strong>of</strong> RP laminates subjected to axial <strong>loading</strong>. Modern Plastics, Vol. 41, (1964), pp.145-150, 188.<br />
[25] Kawai, M., A method for identifying asymmetric dissimilar constant fatigue life diagrams <strong>of</strong> CFRP laminates, Proceedings <strong>of</strong> the Fifth<br />
Asian-Australasian Conference on Composite Materials (ACCM-5), Hong Kong, November 27-30, 2006.<br />
[26] Kawai, M. and Koizumi, K., Nonlinear constant fatigue life diagrams for carbon/epoxy laminates at room temperature, Composites Part A,<br />
Vol. 38, (2007), pp. 2342-53.
M Kawai, Y Matuda, etc. / Constant <strong>Fatigue</strong> Life Diagrams for a Woven CFRP Laminate at Room and High Temperatures<br />
[27] Kawai, M. and Murata, T., A three-segment anisomorphic constant life diagram for the fatigue <strong>of</strong> symmetric angle-ply carbon/epoxy<br />
laminates at room temperature, Composites Part A, 2010.<br />
[28] JIS K7073, Testing method for tensile properties <strong>of</strong> carbon fiber-reinforced plastics, Japanese Industrial Standard, Japanese Standards<br />
Association, 1988.<br />
[29] JIS K7083, Testing method for constant-load amplitude tension-tension fatigue <strong>of</strong> carbon fibre reinforced plastics, Japanese Industrial<br />
Standard, Japanese Industrial Association, 1993.<br />
[30] JIS K7076, A compression examination method in a respect <strong>of</strong> CFRP, Japanese Industrial Standard, Japanese Industrial Association, 1991.<br />
[31] Haberle, J.G. and Matthews, F.L., An improved technique for compression testing <strong>of</strong> unidirectional fibre-reinforced plastics; development<br />
and results, Composites Part A, Vol. 25, No. 5, (1994), pp. 358-371.<br />
[32] Kawai, M., Morishita, M., Fuzi, K., Sakurai, T. and Kemmochi, K., Effects <strong>of</strong> matrix ductility and progressive damage on fatigue strengths<br />
<strong>of</strong> unnotched and notched carbon fiber plain woven roving fabric laminates, Composites Part A Vol. 27A, (1996), pp. 493-502.<br />
43
Abstract<br />
Effect <strong>of</strong> stress ratio on fatigue transverse cracking<br />
in a CFRP laminate<br />
K Ogi a, *, R Kitahara a , M Takahashi a , S Yashiro b<br />
a School <strong>of</strong> Science and Engineering, Ehime University, 3, Bunkyo-cho, Matsuyama, Ehime 790-8577, Japan<br />
b Faculty <strong>of</strong> Engineering, Shizuoka University, 3-5-1, Johoku, Naka-ku, Hamamatsu 432-8561, Japan<br />
This paper presents the effect <strong>of</strong> stress ratio R on the transverse cracking behavior through theoretical consideration<br />
and experiment results. Firstly, the three subcritical crack growth (SCG) models were formulated in association with the<br />
Weibull's probabilistic failure concept for transverse cracking in a cross-ply laminate. The transverse crack density was<br />
expressed as a function <strong>of</strong> R , the maximum stress in the transverse ply and the number <strong>of</strong> cycles. Next, cyclic fatigue<br />
tests were performed for various R to analyze the applicability <strong>of</strong> the three models. Thirdly, the new crack growth law,<br />
that covers the whole range <strong>of</strong> R including R = 1,<br />
was proposed. Finally, constant fatigue life diagrams are simulated,<br />
based on the new Paris law.<br />
Keywords: Transverse cracking; Slow crack growth; CFRP<br />
1. Introduction<br />
Since carbon fiber reinforced plastic (CFRP) laminates have been employed in a variety <strong>of</strong> industrial<br />
fields as structural components, long-term structural reliability has become increasingly important.<br />
Transverse cracking is the first microscopic damage appeared in CFRP laminates during fatigue <strong>loading</strong>.<br />
This damage leads to reduction <strong>of</strong> modulus and residual strength <strong>of</strong> the laminates. Furthermore,<br />
delamination is initiated from the tips <strong>of</strong> transverse cracks for high-cycle fatigue <strong>loading</strong>. Therefore, it is<br />
important to quantitatively predict transverse cracking behavior <strong>under</strong> fatigue <strong>loading</strong>.<br />
A lot <strong>of</strong> work has been conducted on modeling <strong>of</strong> fatigue <strong>of</strong> <strong>composite</strong>s. A review on modeling <strong>of</strong><br />
fatigue in <strong>composite</strong>s was reported by Kaminski [1]. In contrast, the models for transverse cracking<br />
behavior, <strong>under</strong> static <strong>loading</strong> as well as fatigue <strong>loading</strong>, are reviewed by Berthelot [2]. In order to<br />
predict the stable growth <strong>of</strong> transverse cracks <strong>under</strong> fatigue <strong>loading</strong>, a subcritical crack growth (SCG)<br />
model is employed. Ogin and coworkers [3, 4] proposed a fracture mechanics model for fatigue<br />
transverse crack propagation, based on the Paris law. In their model, the stress intensity factor for a<br />
transverse crack depends on the thickness and average applied stress <strong>of</strong> the transverse ply. In addition,<br />
they assumed that the crack propagation rate, as well as the stress intensity factor, is independent <strong>of</strong><br />
crack length. The authors have recently developed probabilistic SCG models for predicting transverse<br />
crack evolution <strong>under</strong> static [5] and cyclic <strong>loading</strong> [6, 7] for cross-ply laminates with thick transverse<br />
* Corresponding author.<br />
E-mail addresses: kogi@eng.ehime-u.ac.jp
plies.<br />
K Ogi, R Kitahara, etc. / Effect <strong>of</strong> stress ratio on fatigue transverse cracking in a CFRP laminate<br />
The SCG models proposed for general materials to date are classified into two models. In the first<br />
model (Model I), the crack propagation rate d a/ dN<br />
is given by the Paris law using the stress intensity<br />
factor range I K . In the second model (Model II), the crack velocity d a/ dt<br />
is given by the power law<br />
using the stress intensity factor K I . Here, the effect <strong>of</strong> stress ratio R (the ratio <strong>of</strong> minimum stress<br />
min to maximum stress max ) on transverse cracking behavior <strong>under</strong> cyclic <strong>loading</strong> is considered. In<br />
Model I, d a/ dN<br />
decreases with increasing R while d a/ dt<br />
increases with an increase in R in<br />
Model II. As a result, the effect <strong>of</strong> the stress ratio on the crack propagation rate is quite different<br />
between the two models.<br />
For CFRP laminates, Hojo et al. [8, 9] proposed the third model (Model III). They demonstrated that<br />
Model I is dominant as the resin becomes tougher in the case <strong>of</strong> Mode I delamination <strong>of</strong> CFRP<br />
laminates. Then, they introduced the equivalent stress intensity factor range eq K as a controlling<br />
parameter for varying stress ratio R . Their model <strong>of</strong>fers a solution to the effect <strong>of</strong> R on fatigue<br />
delamination, however, the effect <strong>of</strong> R on fatigue transverse cracking has not been clarified yet.<br />
In fact, the comparison among the above three models has been made by the authors [10]. Moreover,<br />
they proposed a modified Paris law that covers the whole range <strong>of</strong> R , by introducing the modified<br />
equivalent stress intensity factor range. They assumed that the crack propagation exponent n is a<br />
linear function <strong>of</strong> R . This assumption enables good agreement with experiment result.<br />
This paper presents the effect <strong>of</strong> R on the transverse cracking behavior through theoretical<br />
consideration and experimental results. Firstly, the above three SCG models were formulated in<br />
association with the Weibull's probabilistic failure concept for transverse cracking in a cross-ply<br />
laminate. The transverse crack density was expressed as a function <strong>of</strong> R , the maximum stress in the<br />
transverse ply 2,max and the number <strong>of</strong> cycles N . Next, cyclic fatigue tests were performed <strong>under</strong><br />
various R to discuss the applicability <strong>of</strong> the three models. Thirdly, the new crack growth law (Model<br />
IV), that covers the whole range <strong>of</strong> R , was proposed. The SCG law in Model IV was obtained by<br />
adding the effect <strong>of</strong> R to Model II. Finally, constant fatigue life diagrams, based on Model IV.<br />
2. SCG-based transverse cracking model<br />
as<br />
In Model I, the crack propagation rate d a/ dN<br />
is given using the stress intensity factor range I K <br />
nI<br />
K I = AI<br />
<br />
IC<br />
da<br />
dN<br />
K <br />
where a denote the crack length, N the number <strong>of</strong> cycles, I A a material constant, I<br />
45<br />
(1)<br />
n a crack<br />
propagation exponent and K IC the mode I fracture toughness. In Model II, the crack velocity d a/ dt<br />
is given using the stress intensity factor K I as
46<br />
where II A and II<br />
Fifth International Conference on <strong>Fatigue</strong> <strong>of</strong> Composites<br />
=<br />
KI<br />
II <br />
IC<br />
nII<br />
<br />
<br />
da<br />
A<br />
dt<br />
K <br />
n denote a material constant and a crack propagation exponent, respectively. In<br />
Model III, the Paris law is expressed as<br />
nIII<br />
Keq <br />
= AIII<br />
<br />
IC<br />
da<br />
dN<br />
K <br />
where III A denotes a material constant and n III a crack propagation exponent. It is proven in the<br />
previous work [10] that the crack propagation exponent is identical among the three models. Thus,<br />
hereafter, the crack propagation exponent is simply denoted by n . In addition, we assumed that n is a<br />
linear function <strong>of</strong> R [10].<br />
First, Model I is considered. The stress intensity factor range is given by<br />
( )<br />
K = Y - a<br />
(4)<br />
I max min<br />
where Y represents a constant that depends on the geometry <strong>of</strong> the crack. Integrating Eq. (1) using Eq.<br />
(4), we have<br />
where 0 a and f<br />
n-2 n-2<br />
n<br />
- - n-2 Y <br />
2 2<br />
n n<br />
0 - f = I ( 1-<br />
) max f<br />
2 KIC<br />
a a A R N<br />
<br />
a are respectively referred to as the initial crack length and the crack length at the<br />
number <strong>of</strong> cycles to failure N f . These crack lengths are related to the fracture toughness and the static<br />
(or inert) strength S i . Then, we obtain<br />
with<br />
N<br />
n-2<br />
1 <br />
S <br />
i <br />
f = 1<br />
2 - <br />
hI( R) max max<br />
<br />
n-2 Y <br />
hI R AI R<br />
2 K<br />
( ) = ( 1-<br />
)<br />
2<br />
IC <br />
Through the manipulation <strong>of</strong> equations similar to the above, the number <strong>of</strong> cycles to failure for<br />
Models I, II and III is expressed in a unified form as<br />
with<br />
Here, ( )<br />
n-2<br />
1 <br />
S <br />
i <br />
f 2 <br />
hi( R) max max<br />
is the equivalent period defined as<br />
e R<br />
n<br />
( )<br />
N = - 1 i = I, II, III<br />
<br />
n-2 Y <br />
hII R = AII e R<br />
2 KIC <br />
( ) ( )<br />
n-2 Y <br />
hIII R AIII R<br />
2 K<br />
( ) = ( 1-<br />
)<br />
2<br />
IC <br />
2<br />
( 1-<br />
) n<br />
(2)<br />
(3)<br />
(5)<br />
(6)<br />
(7)<br />
(8)<br />
(9a)<br />
(9b)
K Ogi, R Kitahara, etc. / Effect <strong>of</strong> stress ratio on fatigue transverse cracking in a CFRP laminate<br />
( )<br />
n n<br />
( t) 21+<br />
R 1-R<br />
<br />
d sin d<br />
0 0 <br />
(10)<br />
e R = t = + <br />
2 2 2 <br />
max <br />
where is the period <strong>of</strong> cyclic stress. The equivalent period equals the period for R = 1<br />
The probabilistic expression <strong>of</strong> transverse crack density for each model is then given by [5-7]<br />
m<br />
m<br />
<br />
= 1- exp - Ve 1+ h 2,max N i = I, II, III<br />
S <br />
S <br />
<br />
2 n 2 2,max<br />
( i <br />
- ) ( )<br />
where S represents the saturated transverse crack density, e V the volume <strong>of</strong> a unit element, 2,max<br />
the maximum stress in the transverse ply, and m and S the shape and scale parameters associated<br />
with the Weibull distribution <strong>of</strong> the transverse strength. The maximum stress in the transverse ply<br />
includes residual thermal stress [5-7, 10].<br />
Equation (11) is rewritten as<br />
where ( I, II,III )<br />
plotted against<br />
i<br />
<br />
y = = + h N<br />
1<br />
m<br />
S 1 S 1<br />
ln ln ln 1<br />
2,maxVeS- n-2<br />
<br />
2 ( 2,max )<br />
h i= is replaced by h . After the experiment data on the left side <strong>of</strong> Eq. (12) are<br />
x= N for the various maximum stresses, the values <strong>of</strong> n and h are provided<br />
2<br />
2,max<br />
through curve fitting <strong>of</strong> these plots to the equation ( ) <br />
3. Experiment<br />
y = ln 1 + h x / ( n - 2) .<br />
The material used in the experiment was a [0 / 90 6 / 0 ] cross-ply laminate <strong>of</strong> carbon/epoxy<br />
(T700S/#2521R, Toray). Coupon specimens with end tabs were fabricated for cyclic fatigue tests. The<br />
specimens are 210 mm long, 0.76 mm thick, and 8.5mm wide. The dimensions <strong>of</strong> the specimen are<br />
presented in Table 1, where W denotes the width, and 2b 1 and 2b 2 the thicknesses <strong>of</strong> the<br />
longitudinal and transverse plies. The gage length for transverse crack density was 60 mm. Both edges<br />
<strong>of</strong> the specimens were polished for counting the number <strong>of</strong> transverse cracks within the gage length.<br />
First, the static tensile tests at low (<br />
47<br />
(11)<br />
(12)<br />
4<br />
6 10 -<br />
mm/min) and standard (0.5 mm/min ) <strong>loading</strong> rates were<br />
conducted to determine the saturated crack density S , and the shape and scale parameters m and S .<br />
The cyclic fatigue tests were then performed at room temperature, at the stress ratio R <strong>of</strong> 0, 0.2, 0.4,<br />
0.6 and 1, and at the frequency <strong>of</strong> 10 Hz. Three or four specimens were tested for each value <strong>of</strong> R . The<br />
ratio <strong>of</strong> maximum applied stress 0 to static strength B , denoted by s 0 B<br />
( = / ) , was chosen to be<br />
0.60. The measured material properties are listed in Table 1. The residual thermal stress in the transverse<br />
ply<br />
[10].<br />
T<br />
2 is computed based on the lamination theory. Other properties are presented in the literature
48<br />
4. Results and discussion<br />
Fifth International Conference on <strong>Fatigue</strong> <strong>of</strong> Composites<br />
Table 1. Material properties and geometrical parameters <strong>of</strong> the specimen [10].<br />
W ( mm)<br />
8.5<br />
1<br />
( )<br />
2b mm<br />
0.19<br />
2<br />
( )<br />
2b mm<br />
0.57<br />
m 5.03<br />
S (MPa) 186.4<br />
B (MPa)<br />
562<br />
K IC ( MPa m ) 1.4<br />
I III IV (m)<br />
A A A = = 7<br />
5.85 10 -<br />
<br />
II (m/s) A<br />
4.1 Comparison among the models<br />
n<br />
R = 0.0<br />
19.1<br />
R = 0.2<br />
23.8<br />
R = 0.4<br />
28.4<br />
R = 0.6<br />
33.0<br />
R = 1.0<br />
5<br />
4.57 10 -<br />
<br />
42.3<br />
S (mm -1 ) 1.40<br />
V e (mm 3 ) 3.47<br />
T<br />
2 (MPa) 24.4<br />
Figure 1 presents the effect <strong>of</strong> stress ratio on transverse crack density in the fatigue tests. The average<br />
values are plotted in the figure for readability. It is clear that the transverse crack density becomes larger<br />
with decreasing stress ratio. This implies that transverse cracking behavior obeys the SCG law <strong>of</strong> Model<br />
I rather than Model II. However, Model I is inapplicable to the case <strong>of</strong> R = 1.<br />
Figure 2 depicts the experiment results <strong>of</strong> n and h against R , obtained by curve-fitting using Eq. (12).<br />
The value <strong>of</strong> h decreases with R whilst n increases linearly with R . Figure 3 (a) presents the<br />
value <strong>of</strong> h against R in each model. The value <strong>of</strong> in Model III is a fitting parameter [8, 9] empirically<br />
determined.<br />
Model III gives the best predictions except for the case <strong>of</strong> R = 1.<br />
More detail discussion is give in the<br />
literature [10].
K Ogi, R Kitahara, etc. / Effect <strong>of</strong> stress ratio on fatigue transverse cracking in a CFRP laminate<br />
n<br />
Transverse crack density (/mm)<br />
1.4<br />
1.2<br />
1<br />
0.8<br />
0.6<br />
0.4<br />
0.2<br />
50<br />
45<br />
40<br />
35<br />
30<br />
25<br />
20<br />
0<br />
10 1<br />
R = 0.0<br />
R =0.2<br />
R = 0.4<br />
R = 0.6<br />
R = 1.0<br />
10 2<br />
10 3<br />
Number <strong>of</strong> cycles<br />
10 4<br />
Fig. 1. Transverse crack density in fatigue tests.<br />
n<br />
15<br />
0 0.2 0.4 0.6 0.8 1<br />
R<br />
Fig. 2. The values <strong>of</strong> n and h against stress ratio.<br />
Next, we propose a new model (Model IV), which is applicable to the whole range <strong>of</strong> R . The crack<br />
propagation rate is assumed to be the following empirical formulation as<br />
da<br />
K <br />
= -<br />
dN<br />
K <br />
n<br />
h<br />
p ( )<br />
AIV <br />
I<br />
<br />
IC<br />
exp k R<br />
where k and p are material constants. Based on Model IV, the transverse crack density is expressed<br />
as<br />
with<br />
10 -5<br />
10 -6<br />
10 -7<br />
10 -8<br />
m<br />
m<br />
<br />
2 2 2,max <br />
= 1- exp - Ve ( 1+<br />
h n<br />
IV 2,max N - ) <br />
S <br />
S <br />
<br />
10 5<br />
h<br />
49<br />
(13)<br />
(14)
50<br />
Fifth International Conference on <strong>Fatigue</strong> <strong>of</strong> Composites<br />
n-2 Y <br />
hIV R AIV e R k R<br />
2 KIC <br />
p<br />
( ) = ( ) exp(<br />
- )<br />
Equation (15) is rewritten, using the value for R = 0 , denoted by h 0 , as<br />
( )<br />
( R)<br />
( 0)<br />
2<br />
p ( )<br />
IV<br />
e<br />
e<br />
0<br />
Putting R = 1 into Eq. (16), we obtain the value <strong>of</strong> k as<br />
h/h 0<br />
h/h 0<br />
10 2<br />
10 0<br />
10 -2<br />
10 -4<br />
10 -6<br />
10 -8<br />
10 -10<br />
10 -12<br />
10 -14<br />
1<br />
0.8<br />
0.6<br />
0.4<br />
0.2<br />
(15)<br />
<br />
h R = exp - k R h<br />
(16)<br />
( 1)<br />
( 0)<br />
h k = =<br />
e 0<br />
ln 7.00<br />
e h <br />
1 <br />
Experiment<br />
h I<br />
h II<br />
h III (= 0.9)<br />
0 0.2 0.4 0.6 0.8 1<br />
R<br />
(a) Models I, II and III<br />
Experiment<br />
h III ( = 0.9)<br />
h IV (p = 1.9)<br />
0<br />
0 0.2 0.4 0.6 0.8 1<br />
R<br />
(b) Models I, II and IV<br />
Fig. 3. Comparison <strong>of</strong> the value <strong>of</strong> hi/ h .0 against stress ratio among the models and experiment results.<br />
(17)
where 1<br />
K Ogi, R Kitahara, etc. / Effect <strong>of</strong> stress ratio on fatigue transverse cracking in a CFRP laminate<br />
Transverse crack density, (/mm)<br />
1.6<br />
1.4<br />
1.2<br />
1<br />
0.8<br />
0.6<br />
0.4<br />
0.2<br />
0<br />
10 1<br />
R = 0.0 measured<br />
R = 0.2 measured<br />
R = 0.4 measured<br />
R = 0.6 measured<br />
R = 1.0 measured<br />
R = 0.0 calculated<br />
R = 0.2 calculated<br />
R = 0.4 calculated<br />
R = 0.6 calculated<br />
R = 1.0 calculated<br />
10 2<br />
10 3<br />
Number <strong>of</strong> cycles, N<br />
Fig. 4. Comparison <strong>of</strong> transverse crack density between the experiment results and the predictions calculated by using Model IV.<br />
h denotes h ( ) . The value <strong>of</strong> p is estimated through the curve-fitting. Figure 3 (b) presents<br />
IV 1<br />
the value <strong>of</strong> h against stress ratio in Models III and IV. It is demonstrated that the results for k = 1.9<br />
gives the good agreement with the experiment result over the whole range <strong>of</strong> R . As a result, it can be<br />
said that Model IV is the most successful among the four models. Figure 4 plots the transverse crack<br />
density predicted using Model IV. The agreement between the predictions and the experiment results is<br />
fairly good although the model overestimates at the small number <strong>of</strong> cycles.<br />
4.2 Constant fatigue life diagrams<br />
When the transverse crack density is expressed as a function <strong>of</strong> stress ratio R , the number <strong>of</strong> cycles<br />
N , and the maximum stress 2, max , constant fatigue life diagrams or fatigue limit diagrams are derived.<br />
The mean stress 2,m and stress amplitude 2,a in the transverse ply are then given by<br />
where<br />
10 4<br />
1+ R * 1-R<br />
*<br />
2,m = 2,max ( R, Nf , ) , 2,a = 2,max ( R, Nf<br />
, )<br />
(18)<br />
2 2<br />
*<br />
2, max denotes 2, max that satisfies Eq. (14). Figure 5 depicts the constant fatigue life diagrams<br />
for transverse crack density. The experimental data are in reasonably good agreement with the<br />
predictions. It should be noted that the mean stress for R = 1,<br />
represented by the x-intercept, is not<br />
constant, but is shifted to the left with increasing the fatigue life. This is because the static fatigue<br />
strength depends on fatigue life and failure probability or transverse crack density. In addition, the<br />
diagrams exhibit nonlinearity, unlike the modified Goodman's diagram. The diagram becomes<br />
approximately linear only for short fatigue life.<br />
5 Conclusions<br />
This paper presents the effect <strong>of</strong> stress ratio R on the transverse cracking behavior in a CFRP<br />
cross-ply laminate. The transverse crack density was expressed as a function <strong>of</strong> R , the maximum stress<br />
10 5<br />
51
52<br />
Fifth International Conference on <strong>Fatigue</strong> <strong>of</strong> Composites<br />
in the transverse ply and the number <strong>of</strong> cycles based on the probabilistic SCG model. Model III is the<br />
most successful among the conventional three models. However, the three conventional models cannot<br />
predict the behavior for the case <strong>of</strong> static fatigue <strong>loading</strong> ( R = 1).<br />
In contrast, the newly developed<br />
model, Model IV, that covers the case <strong>of</strong> R = 1 gives the best predictions over the whole range <strong>of</strong> R .<br />
In addition, Model IV enables us to obtain the constant fatigue life diagrams for transverse cracking.<br />
2,a (MPa)<br />
2,a (MPa)<br />
70<br />
60<br />
50<br />
40<br />
30<br />
20<br />
10<br />
198<br />
595<br />
1150<br />
4200<br />
N f = 10<br />
N f = 10 3<br />
N f = 10 5<br />
Experiment<br />
0<br />
0 50 100 150<br />
(MPa)<br />
2,m<br />
70<br />
60<br />
50<br />
40<br />
30<br />
20<br />
10<br />
1490<br />
N f = 10<br />
N f = 10 3<br />
N f = 10 5<br />
(a)<br />
3720<br />
Experiment<br />
9600<br />
0<br />
0 50 100 150<br />
(MPa)<br />
2,m<br />
(b)<br />
Fig. 5 Constant fatigue life diagrams for a variety <strong>of</strong> fatigue lives at transverse crack density ratio / S <strong>of</strong> (a) 0.4 and (b) 0.6. The figures<br />
besides the plots represent the fatigue life in the experiment.<br />
References<br />
[1] Kaminski M. On probabilistic fatigue models for <strong>composite</strong> materials. International Journal <strong>of</strong> <strong>Fatigue</strong> 2002; 24: 477-495.
K Ogi, R Kitahara, etc. / Effect <strong>of</strong> stress ratio on fatigue transverse cracking in a CFRP laminate<br />
[2] Berthelot JM. Transverse cracking and delamination in cross-ply glass-fiber and carbon-fiber reinforced plastic laminates: Static and<br />
fatigue <strong>loading</strong>. Applied Mechanics Reviews 2003; 56: 111-147.<br />
[3] Ogin SL, Smith PA, Beaumont PWR. A stress intensity factor approach to the fatigue growth <strong>of</strong> transverse ply cracks. Composites Science<br />
and Technology 1985; 24: 47-59.<br />
[4] Boniface L, Ogin SL. Application <strong>of</strong> the Paris equation to the fatigue growth <strong>of</strong> transverse ply cracks. Journal <strong>of</strong> Composite Materials<br />
1989; 23: 735-754.<br />
[5] Ogi, K., Yashiro, S., Takahashi, M. and Ogihara, S., A probabilistic static fatigue model for transverse cracking in CFRP cross-ply<br />
laminates, Composites Science and Technology, 2009, 69 (3-4), 469~476.<br />
[6] Ogi, K., Ogihara, S. and Yashiro, S., A probabilistic SCG model for transverse cracking in CFRP cross-ply laminates <strong>under</strong> cyclic <strong>loading</strong>,<br />
Advanced Composite Materials, 19 (2010), 1-17.<br />
[7] Ogi, K., Yashiro, S. and Niimi, K., A probabilistic approach for transverse crack evolution in a <strong>composite</strong> laminate <strong>under</strong> variable<br />
amplitude cyclic <strong>loading</strong>," Composites Part A, Vol. 41 (2010), 383-390.<br />
[8] Hojo, M., Tanaka, K., Gustafson, C.-G., Hayashi, R., Effect <strong>of</strong> stress ration on near-threshold propagation <strong>of</strong> delamination fatigue cracks<br />
in unidirectional CFRP, Composites Science and Technology, 1987, 29, 273~292.<br />
[9] Hojo, M., Ochiai, S., Gustafson, C.-G. and Tanaka, K., Effect <strong>of</strong> matrix resin on delamination fatigue crack growth in CFRP laminates,<br />
Engineering Fracture Mechanics, 46 (1994), 35~47.<br />
[10] K. Ogi, M. Takahashi, Subcritical crack growth models for predicting effects <strong>of</strong> stress ratio on fatigue transverse cracking in a CFRP<br />
laminate, submitted to International Journal <strong>of</strong> <strong>Fatigue</strong>.<br />
53
<strong>Fatigue</strong> damage characterisation for wind turbine blade GFRPs<br />
using computed tomography<br />
J Lambert *, A R Chambers, I Sinclair, S M Spearing<br />
(Engineering Materials, School <strong>of</strong> Engineering Sciences, University <strong>of</strong> Southampton, Highfield Campus, Southampton, Hampshire, SO17 1BJ)<br />
Abstract<br />
The aim <strong>of</strong> the research was to investigate microdamage mechanisms with a view to informing micromechanical<br />
models. The material was first characterised using computed tomography (CT). This enabled a detailed 3-dimensional<br />
view <strong>of</strong> microstructure. Coupons were then fatigue tested at R=-1 to 40% <strong>of</strong> the material tensile UTS. Some tests were<br />
conducted to failure to obtain S-N data and to establish failure modes. Other tests interrupted at various fractions <strong>of</strong> the<br />
predicted coupon lifetime were subjected to CT scanning to gain an insight into the fatigue damage mechanisms present.<br />
The pre-test material characterisation scanning revealed details <strong>of</strong> the material microstructure, including fibre tows and<br />
voids. The interrupted tests identified the presence <strong>of</strong> transverse matrix microcracking. This appeared to originate<br />
predominantly from the free edges <strong>of</strong> the specimen, and in some cases extended into the specimen bulk in the form <strong>of</strong><br />
delaminations. Fewer transverse microcracks were found towards the centre <strong>of</strong> the specimen width. The absence <strong>of</strong> any<br />
fibre breaks or evidence <strong>of</strong> microbuckling was also noteworthy, further suggesting that the main compressive damage<br />
mechanisms for the material were matrix cracking and delamination.<br />
1 Introduction<br />
This recent emergence <strong>of</strong> longer wind turbine blades to increase efficiency has resulted in an absence<br />
<strong>of</strong> long-term in-service data. With expected lifetimes <strong>of</strong> around 20 years, the long-term integrity <strong>of</strong> the<br />
blade material has thus become an important area <strong>of</strong> research. More accurate fatigue models are thus<br />
required to use material in a structurally efficient and fatigue tolerant fashion. In order to establish a<br />
physically-based fatigue model based on microdamage evolution, it is first critical to <strong>under</strong>stand the<br />
micromechanisms themselves. Three main types <strong>of</strong> damage occur within <strong>composite</strong>s; fibre damage,<br />
interfacial damage, and matrix damage. Fibre based damage encompasses fibre breaks and, in<br />
compression, fibre failure by microbuckling or kink band formation. Interfacial damage includes<br />
fibre/matrix debonding and fibre pullout, while matrix damage mechanisms are matrix cracking and<br />
delamination. Difficulties arise with the coupling <strong>of</strong> two or more different mechanisms, for instance<br />
delaminations caused by matrix cracking in neighbouring plies.[1] Another example <strong>of</strong> damage<br />
interaction relevant to tension-compression testing is the presence <strong>of</strong> fibre/matrix debonding causing<br />
either microbuckling [2] or transverse matrix cracking.[3] The affect <strong>of</strong> material microstructure is also a<br />
key consideration. Material layup, fibre volume fraction, voids and their location are <strong>of</strong> critical<br />
importance to fatigue performance. Structural and geometrical considerations must also be made, as<br />
* Corresponding author.<br />
E-mail addresses: j.w.lambert@soton.ac.uk
J Lambert, A R Chambers, etc. / <strong>Fatigue</strong> damage characterisation for wind turbine blade GFRPs using computed tomography<br />
features such as ply drops, holes, joints and free edges all act as load concentrators. As a result,<br />
extensive fatigue databases for different materials and <strong>loading</strong> conditions have been compiled in recent<br />
years.<br />
The recent thesis <strong>of</strong> Nijssen [4] gives a detailed analysis <strong>of</strong> fatigue life prediction methods both for<br />
constant amplitude and variable amplitude testing. The paper includes discussions <strong>of</strong> scatter sources and<br />
fatigue limits in <strong>composite</strong>s. Damage accumulation was modeled in two ways and a comparison was<br />
made: these were the Miner‟s Sum method, and a strength-based method, which calculated the effect <strong>of</strong><br />
each load cycle on the material strength. Mandell, who prior to 1992 conducted much relevant work<br />
concerning fatigue performance <strong>of</strong> a variety <strong>of</strong> <strong>composite</strong> materials, has since published a large body <strong>of</strong><br />
work almost exclusively on testing, feature characterisation and life prediction methods for fibreglass<br />
wind turbine blade materials. His original work in the field included a large fatigue test matrix for<br />
unidirectional and triaxially [0,±45] reinforced glass fibre <strong>composite</strong>s, their characteristic S-N curves,<br />
and their failure modes. [5] More recent works include Mandell et al., 2002 [6]; a detailed review <strong>of</strong> the<br />
work performed by the Montana State University (MSU) Composite Materials <strong>Fatigue</strong> Program from<br />
1997 to 2001. Extensive testing at coupon and substructure level is reported, including material studies<br />
with detailed experimental method definition, spectrum and very high cycle fatigue testing, and strain<br />
rate effects. Further recent collaborative work has been focused on analytical lifing methods and CLD<br />
refinement. [7]-[9] These approaches however require a large experimental effort to generate the data<br />
required for fitting parameters, and also lack an appreciation <strong>of</strong> the <strong>under</strong>lying mechanisms occurring.<br />
Correspondingly, a great number <strong>of</strong> micromechanical models for <strong>composite</strong>s exist, however these are<br />
<strong>of</strong>ten limited to a specific <strong>loading</strong> condition or material lay-up and geometry.<br />
Notable models include Ogin et al.,[10] who related transverse crack spacing to stiffness degradation<br />
for a cross-ply GFRP. Dimant [11][12] developed a model linking matrix cracking and delamination.<br />
The compliance change resulting from the propagation <strong>of</strong> each <strong>of</strong> the two mechanisms was modelled<br />
with the outputs being a modified modulus E, and a value for the strain energy release rate G.<br />
Experimental values for G were obtained by performing fracture mechanics tests, and it was found that<br />
the onset <strong>of</strong> delamination cracking could be reliably predicted. The model is attractive as it uses two<br />
different mechanisms to predict the critical strain energy release rate required for delamination cracking.<br />
The critical element model, developed by Reifsnider and Stinchcomb, is an important representation <strong>of</strong><br />
<strong>composite</strong> fatigue damage [13]. It could be argued however that despite the introduction <strong>of</strong><br />
micromechanic metrics, in the form <strong>of</strong> critical and subcritical elements, the model is primarily residual<br />
stiffness based and lacks a true mechanism based formulation approach.<br />
One <strong>of</strong> the fundamental considerations in the development <strong>of</strong> a micromechanical model is the means<br />
by which the mechanisms are observed. The capture <strong>of</strong> the damage was in this project, achieved by<br />
using micro-scale Computed Tomography (µCT). µCT implies an x-ray source spot size in the range <strong>of</strong><br />
5-100μm, giving comparable spatial resolution. µCT machines are becoming more common in<br />
engineering laboratories due to their “benchtop” dimensions, continuing advances in the resolution<br />
attainable, and the increasing ease associated with handling <strong>of</strong> large amounts <strong>of</strong> data. Despite this there<br />
is still very limited µCT work in the field <strong>of</strong> <strong>composite</strong> damage characterisation. A notable paper is that<br />
55
56<br />
Fifth International Conference on <strong>Fatigue</strong> <strong>of</strong> Composites<br />
<strong>of</strong> Schilling,[14] who used CT to examine internal damage in a number <strong>of</strong> different <strong>composite</strong> specimen<br />
types. Two studies were performed for glass/epoxy <strong>composite</strong>s, one attempting to identify voids, and the<br />
other matrix cracking and delaminations. Spherical voids in the order <strong>of</strong> 0.25-0.5 mm were observed<br />
from a scan <strong>of</strong> unidirectional s-glass/epoxy specimen, using a pixel size <strong>of</strong> 26 μm. In the other<br />
glass/epoxy study, large (>25 μm) matrix cracks and delaminations were observed. The specimen<br />
geometry did however contain a centre hole, facilitating the locating <strong>of</strong> the damage, and the specimen<br />
had been destructively prepared.<br />
2. Experimental Procedure<br />
2.1 Mechanical testing<br />
The coupons were glass-fibre/epoxy with 6 stitched triaxial plies each containing 0 o , +45 o and -45 o<br />
layers; representative <strong>of</strong> wind turbine blade material. The rectangular coupons measured 120x25x7 mm<br />
with a 40 mm gauge. The tab material was woven +/-45 o glass/epoxy 2 mm thick and was adhesively<br />
bonded to the coupons. The mechanical testing was performed using an Instron 8872 servo-hydraulic<br />
test machine with a +/- 100 kN dynamic range. Static testing was performed to give an ultimate tensile<br />
strength (UTS) figure. The fatigue testing was then conducted to a stress level equal to 40% <strong>of</strong> this UTS<br />
value. As it was fully reversed (R=-1), the applied stress also extended into compression to -40% <strong>of</strong> the<br />
tensile UTS. Load controlled testing was used as it provided more relevant S-N data and was in<br />
agreement with the majority <strong>of</strong> the literature. Testing was conducted at a frequency <strong>of</strong> 2 Hz and a fan<br />
was used to cool the specimen surfaces, as autogenous heating was a concern due to the relatively thick<br />
coupon dimension. A clip-type extensometer with a 20mm gauge section was attached throughout<br />
fatigue testing, connected to a datalogger recording the dynamic strain readings at a sample rate <strong>of</strong> 50<br />
Hz. Some <strong>of</strong> the tests were run to failure, while others were interrupted to <strong>under</strong>go CT investigation into<br />
the damage mechanisms. Failure was defined by a >6mm crosshead deflection from the unloaded,<br />
gripped state in either tension or compression.<br />
2.2 Computed Tomography<br />
The CT was performed using an XTek Benchtop 160i µCT scanner. CT prior to testing <strong>of</strong> the coupons<br />
was conducted in order to characterise the microstructure, in particular the voids, so that quantitative<br />
void analysis could be conducted. For the coupon size and density it was found that a voltage <strong>of</strong> ~85 kV<br />
and a beam current <strong>of</strong> ~95 μA gave the best results. This allowed sufficient penetration <strong>of</strong> the specimens<br />
whilst still maintaining a high contrast. The resolution for a scan <strong>of</strong> the entire specimen cross section<br />
was found to be 25 μm.<br />
Higher resolution scanning <strong>of</strong> destructively prepared “matchstick” specimens was also performed.<br />
The coupons were cut into 20 mm long specimens with a 3x3 mm cross section. This enabled a much<br />
higher magnification in the CT scanner, which in turn permitted resolutions <strong>of</strong> up to 6µm to be achieved.<br />
A voltage <strong>of</strong> 73 kV and a current <strong>of</strong> 123 µA was used for scanning these smaller specimens.
J Lambert, A R Chambers, etc. / <strong>Fatigue</strong> damage characterisation for wind turbine blade GFRPs using computed tomography<br />
Fig. 1. µCT setup <strong>of</strong> a complete test specimen.<br />
The XTek system uses two main scan types, “slow” and “fast”. During a slow scan, the specimen<br />
stage stops rotating while each radiograph is taken, whereas with a fast scan the specimen is rotated<br />
continuously. It was found that fast scans, taking 1910 different projection during the 360 o rotation,<br />
<strong>of</strong>fered the most efficient option. Scans took 1 hour and 7 minutes to perform. The reconstruction was<br />
performed using the Metris CT Pro s<strong>of</strong>tware, and the reconstructions were visualised using VGStudio<br />
Max.<br />
3 Results<br />
3.1 Mechanical test results<br />
The static test results yielded an average failure stress <strong>of</strong> 440 MPa with a standard deviation <strong>of</strong> 27<br />
MPa. The fatigue tests that were conducted to failure gave the following results. All tests were<br />
performed at 352 MPa alternating stress, corresponding to -/+ 40% UTS.<br />
Fig. 2. <strong>Fatigue</strong> test results in the form <strong>of</strong> a single load level S-N plot, including the failure mode.<br />
Two different failure mechanisms were observed as shown in Fig.3. The compressive failures, Fig<br />
3.(a) were characterised by multiple large-scale delaminations along the whole gauge length between<br />
many, if not all the plies (discussed further in section 3.3).<br />
57
58<br />
Fifth International Conference on <strong>Fatigue</strong> <strong>of</strong> Composites<br />
Fig. 3. (a) Example <strong>of</strong> compressive failure showing delaminations and global buckling. (b) Example <strong>of</strong> tensile failure in the tabs showing multiple<br />
fibre breaks.<br />
The tensile failures, shown in Fig 3.(b) were all found to be within the tabbed region, at the point<br />
along the coupon length where the specimen entered the machine‟s grips. The average life <strong>of</strong> the<br />
specimens that failed in compression was 62,638, while the tensile failure coupons sustained on average<br />
25,402. The scatter in results, and limited number <strong>of</strong> tests performed implied, however, that this<br />
difference in average life could not be used to reliably predict failure type.<br />
3.2 Computed Tomography results<br />
The CT imaging provided useful insight into the material <strong>behaviour</strong> in both the untested and tested<br />
specimen scans. Fig 3. shows the three planes <strong>of</strong> view for the CT reconstruction. The scan was <strong>of</strong> the<br />
entire specimen cross section, thus allowing a voxel resolution <strong>of</strong> 25µm.<br />
Fig. 4. Orientation <strong>of</strong> CT reconstruction planes, showing micrographs <strong>of</strong> a slice from each <strong>of</strong> the three planes.<br />
For orientation, the 25mm scale bar on the upper left hand image is the specimen width. The lower<br />
left hand image is taken parallel to the fibre direction, in a resin rich region between fibre plies. The<br />
randomly orientated fibres and large voids present in the matrix can be seen. The middle set <strong>of</strong> images<br />
shows the through-thickness plane <strong>of</strong> view with the corresponding micrograph slice. The different ply<br />
orientations are visible, the 0 o plies discernable as they are parallel to the page thus lack the tow gaps
J Lambert, A R Chambers, etc. / <strong>Fatigue</strong> damage characterisation for wind turbine blade GFRPs using computed tomography<br />
visible in the +/-45 o plies. The right hand images show the cross-sectional view <strong>of</strong> the specimen. The<br />
tow gaps in all the plies are visible. The large matrix voids present in the resin rich regions can be seen,<br />
as well as smaller voids between the fibre tows.<br />
The interrupted-test scans were conducted in order to gain an insight into damage evolution. It was<br />
hoped that full-cross section scans could be used, so that the specimens could continue to be fatigue<br />
tested after scanning. The 25µm voxel size associated with the intact specimen scans was however<br />
unable to resolve any ongoing damage, therefore cutting down <strong>of</strong> the specimens to the 3x3mm cross<br />
section was required. This enabled a resolution <strong>of</strong> up to 6µm, and was able to resolve matrix<br />
microcracking and partial delamination.<br />
Shown in Fig 5 is the scan from a specimen that sustained 77,505 fatigue cycles before the test was<br />
stopped for CT analysis. The figure shows the entire scanned region, measuring 3x3x5 mm. This<br />
corresponded to half the original coupon thickness, hence the three “front” triaxial plies are visible. The<br />
specimen was taken from the corner <strong>of</strong> coupon, so the two surfaces in the image were free surfaces<br />
during the test. Transverse matrix cracks, highlighted in red by using their greyscale histogram range,<br />
can be seen, the longest <strong>of</strong> which propagates from the free edge. The voids that interact with the cracks<br />
have been highlighted using the same method in blue.<br />
Fig. 5. 3D reconstructed view <strong>of</strong> a tested 3x3.8mm cross-section “matchstick” specimen 5 mm in length containing a transverse matrix crack.<br />
Fig 6(a) shows the same view <strong>of</strong> the same specimen, but now cutting the reconstructed CT image<br />
further through the thickness, as shown by the lower value in the scale bar. The matrix has also been<br />
removed by hiding the corresponding greyscale values, to aid the visualisation <strong>of</strong> the crack in three<br />
dimensions. The previously transverse fatigue crack has, at this depth, changed direction to propagate at<br />
45º; in line with the first fibre layer orientation. The crack can be seen extending through voids in<br />
between 45º tows. A second transverse crack in the upper left hand region can also be seen. Fig 6(b) cuts<br />
further into the specimen bulk, this time at the interface between +45º and the -45º layers. The crack<br />
continued to extend along the edge <strong>of</strong> a 45º tow, interacting with the only void at this depth, but also<br />
59
60<br />
Fifth International Conference on <strong>Fatigue</strong> <strong>of</strong> Composites<br />
formed a partial delamination, shown by the red region extending from the specimen edge.<br />
Fig. 6. (a) 3D reconstructed view taken 0.2mm from the front face <strong>of</strong> the specimen. (b) 3D reconstructed view taken 0.6mm from the front face <strong>of</strong><br />
the specimen.<br />
The other three “corner” specimens from this coupon also revealed transverse matrix cracking<br />
extending from the specimen free edge across the outer resin rich region. One <strong>of</strong> these, from the<br />
opposite side width-wise, also showed a partial delamination between the +45/-45 interface, again<br />
extending from a crack in the outer resin rich region. The specimens from the centre <strong>of</strong> the coupon were<br />
also scanned but revealed no transverse matrix cracking near the surface, however, longitudinal matrix<br />
cracking between 0º fibre tows was observed. A key finding was the absence <strong>of</strong> any fibre breaks within<br />
any <strong>of</strong> the scans, despite the 8µm resolution <strong>of</strong> 15µm diameter fibres.<br />
Further transverse matrix cracking was found in a specimen that sustained 46,500 cycles prior to<br />
scanning. Again this appeared to be confined to a region near the coupon surface and originated from<br />
the free edge <strong>of</strong> the specimen. It must be noted that at the point when the test was stopped it was<br />
unknown whether these coupons would ultimately fail in compression or tension. However considering<br />
the failure modes it seems that the mechanism was relevant to the compressive failure mode, as<br />
discussed in the next section.<br />
3.3 Failure Modes<br />
The two very different modes <strong>of</strong> failure (tensile failure within the tabs and compressive), provide key<br />
area <strong>of</strong> discussion. The strain data, corresponding to the longitudinal stiffness degradation in the gauge<br />
section, was similar throughout the test for both types <strong>of</strong> failure. This suggests similar mechanisms<br />
occurring within each, and the cause for the marked difference in final failure remains unknown. Shown<br />
in Fig 7. is the cross-sectional CT image <strong>of</strong> a specimen which sustained 59,697 cycles and failed in<br />
compression.
J Lambert, A R Chambers, etc. / <strong>Fatigue</strong> damage characterisation for wind turbine blade GFRPs using computed tomography<br />
Figure 7. Cross sectional view <strong>of</strong> a coupon that had failed in compression after 59697 cycles, showing multiple delaminations.<br />
Delaminations can be seen extending across the specimen width between the +45º and -45º layers in<br />
each ply. An additional delamination between the two central plies at their 0º/0º is also present. The<br />
+45º/-45º interface represents the highest interfacial shear stress within the specimen, causing it to be<br />
the most likely site for delamation.[15] These delaminations corroborate the importance <strong>of</strong> the partial<br />
+45º/-45º delamination found in the interrupted test as seen in Fig 6(b). A sequence for damage<br />
evolution for compressive failure can thus be hypothesised:<br />
(1) Transverse matrix cracks propagate from the corners <strong>of</strong> the specimen cross section across the outer<br />
resin rich region.<br />
(2) Some critical cracks propagate into the bulk <strong>of</strong> the specimen through the outer 45º fibre layers.<br />
(3) The cracks cause delaminations at the +45º/-45º interface, which then in turn propagate inwards<br />
from the edges <strong>of</strong> the coupon.<br />
(4) When the outer plies have delaminated, the increased stresses in the remaining plies causes further<br />
delamination between the +45º/-45º interfaces in the following plies.<br />
(5) The delamination rate continues to accelerate as the stress on the remaining plies increases, until<br />
compressive failure occurs with the onset <strong>of</strong> delamination between all the plies.<br />
4 Conclusions<br />
(1) µCT is an efficient and method for examining <strong>composite</strong> microstructure, capable <strong>of</strong> resolving<br />
fibres, voids and ply detail in 3-dimensions.<br />
(2) The fully reversed fatigue testing yielded two distinct failure modes. 5 out <strong>of</strong> 12 specimens failed<br />
in compression, while 7 out <strong>of</strong> 12 failed in tension within the tabbed region.<br />
(3) The compressive failures were governed by multiple delaminations between +45º/-45º fibre layers.<br />
The tensile failures within the tabbed region were characterised by fibre breaks extending<br />
transverse to the <strong>loading</strong> direction throughout the specimen cross section.<br />
(4) Scans <strong>of</strong> interrupted tests revealed transverse matrix cracking. The cracking originated<br />
predominantly from free edges and at the surface. Smaller scale transverse and longitudinal<br />
cracking was found in the bulk <strong>of</strong> the specimen.<br />
(5) No fibre breaks or fibre microbuckling were found in any <strong>of</strong> the interrupted-test CT scans.<br />
61
62<br />
Fifth International Conference on <strong>Fatigue</strong> <strong>of</strong> Composites<br />
(6) A fatigue damage sequence for compressive failure was hypothesised, involving first the formation<br />
<strong>of</strong> transverse matrix cracks from the free edges. These propagate to form delaminations between<br />
the outer +45º/-45º interface, which in turn propagate inwards resulting in ply failure. The loss <strong>of</strong><br />
the outer plies result in increasing rapid delamination failures <strong>of</strong> the inner +45º/-45ºinterfaces.<br />
Acknowledgement<br />
The authors would wish to extend thanks to the Engineering and Physical Sciences Research Council<br />
(EPSRC) for financial support <strong>of</strong> the project.<br />
References<br />
[1] SA Salpekar, TK O‟Brien. Analysis <strong>of</strong> matrix cracking and local delamination in (0/ θ/- θ)s graphite epoxy laminates <strong>under</strong> tensile load.<br />
ASTM Journal <strong>of</strong> Composites Technology and Research 15 (2), 95–100. (1993)<br />
[2] PT Curtis The <strong>Fatigue</strong> Behaviour <strong>of</strong> Fibrous Composite Materials. Journal <strong>of</strong> Strain Analysis, Vol 24, No 4/198. (1989)<br />
[3] EK Gamstedt, BA SjoÈgren. Micromechanisms in tension-compression fatigue <strong>of</strong> <strong>composite</strong> laminates containing transverse plies.<br />
Composites Science and Technology 59. 167-178 (1999)<br />
[4] RPL Nijssen. <strong>Fatigue</strong> Life Prediction and Strength Degradation <strong>of</strong> Wind Turbine Rotor Blade Composites. SAND2006-7810P. Unlimited<br />
Release. 2007<br />
[5] JF Mandell, RM. Reed, DD Samborsky. <strong>Fatigue</strong> <strong>of</strong> Fiberglass Wind Turbine Blade Materials. CONTRACTOR REPORT SAND92–7005.<br />
Unlimited Release UC–261. Printed August EN ISO 527: Plastics. Determination <strong>of</strong> tensile properties (1994).<br />
[6] JF Mandall, DD Samborsky, DS Cairns. <strong>Fatigue</strong> <strong>of</strong> <strong>composite</strong> materials and substructures for wind turbine blades. SANDIA REPORT<br />
SAND2002-0771. Unlimited Release. Printed March 2002<br />
[7] HJ Sutherland and JF Mandell. Optimized Constant-Life Diagram for the Analysis <strong>of</strong> Fiberglass Composites Used in Wind Turbine Blades.<br />
Journal <strong>of</strong> Solar Energy Engineering. NOVEMBER 2005, Vol. 127 / 563<br />
[8] HJ Sutherland and JF Mandell. Updated Goodman Diagrams for Fiberglass Composite Materials Using the DOE/MSU <strong>Fatigue</strong> Database.<br />
Sandia National Laboratories (2004)<br />
[9] HJ Sutherland and JF Mandell. The Effect <strong>of</strong> Mean Stress on Damage Predictions for Spectral Loading <strong>of</strong> Fibreglass Composite Coupons.<br />
Wind Energ. 8:93–108 (DOI:10.1002/we.125) (2005)<br />
[10] SL Ogin, PA Smith and PWR Beaumont. Matrix cracking and stiffness reduction during the fatigue <strong>of</strong> a (0/90)s GFRP laminate.<br />
Composites Sci Tech. 22(1), 23-31. 1985<br />
[11] RA Dimant. Damage mechanics <strong>of</strong> <strong>composite</strong> laminates. Cambridge University Engineering Department PhD Thesis. 1994<br />
[12] RA Dimant, HR Shercliff and PWR Beaumont. Evaluation <strong>of</strong> a damage-mechanics approach to the modeling <strong>of</strong> notched strength KFRP<br />
and GRP. Composites Sci Tech 62, 255-263. 2002<br />
[13] KL Reifsnider and WW Stinchcomb. 'Composite Materials: <strong>Fatigue</strong> and Fracture' (Ed. H,T. Hahn), ASTM STP 907, American Society for<br />
Testing and Materials, pp. 298-303. Philadelphia, (1986)<br />
[14] PJ Schilling, BhanuPrakash R. Karedla, AK. Tatiparthi, A Melody. Verges, PD Herrington. X-ray computed microtomography <strong>of</strong> internal<br />
damage in fiber reinforced polymer matrix <strong>composite</strong>s. Composites Science and Technology 65 2071-2078 (2005)<br />
[15] TK O‟Brien. Characterization <strong>of</strong> delamination onset and growth in a <strong>composite</strong> laminate. NASA Langley Research Center (1981)
Cyclic interlaminar crack growth in unidirectional and braided<br />
<strong>composite</strong>s<br />
S Stelzer a, *, G Pinter a , M Wolfahrt b,d , A J Brunner c , J Noisternig d<br />
Abstract<br />
a Institute <strong>of</strong> Materials Science and Testing <strong>of</strong> Plastics, University <strong>of</strong> Leoben, Franz-Josef-Strasse 18, A-8700 Leoben, Austria<br />
b Polymer Competence Center Leoben, Roseggerstrasse 12, A-8700 Leoben, Austria<br />
c EMPA, Swiss Federal Laboratories for Materials Science and Technology, CH-8600 Dübendorf, Switzerland<br />
d FACC AG, Fischerstrasse 9, A-4910 Ried im Innkreis, Austria<br />
Since there is still no standard test method for the investigation <strong>of</strong> the fatigue delamination propagation behavior <strong>of</strong><br />
fiber reinforced <strong>composite</strong>s, this paper aims at examining some <strong>of</strong> the parameters that can influence this kind <strong>of</strong><br />
measurements. Therefore unidirectionally reinforced <strong>composite</strong>s were tested <strong>under</strong> displacement control and double<br />
cantilever beam specimens were used to realize mode I tensile opening loads in the material. A comparison <strong>of</strong> the effect<br />
<strong>of</strong> different parameters on this type <strong>of</strong> measurements was carried out including machine parameters (frequency, control<br />
mode, type <strong>of</strong> machine) and specimen parameters (initial crack length, thickness, material). The comparison <strong>of</strong> the results<br />
with the results from a second laboratory yielded promising results. Furthermore the damage tolerance <strong>of</strong> braided<br />
<strong>composite</strong>s with different braid architectures (i.e. braiding angle) was studied.<br />
Keywords: Braid; fracture mechanics; fatigue crack growth; crack branching; fractography<br />
1 Introduction<br />
High performance fiber <strong>composite</strong>s feature outstanding specific properties and therefore have an<br />
indisputable potential for applications in design <strong>of</strong> lightweight structures. Nevertheless their application<br />
is limited especially because <strong>of</strong> their susceptibility to delamination. Delaminations can grow to a critical<br />
size <strong>under</strong> cyclic <strong>loading</strong> conditions, even at loads below the static strength <strong>of</strong> the material and can thus<br />
trigger the failure <strong>of</strong> the structure. To be able to avoid such a failure key data to describe the initiation<br />
and growth <strong>of</strong> delaminations for design purposes have to be created and approaches for the<br />
enhancement <strong>of</strong> the material performance have to be found.<br />
In ASTM D 6115 a standard test method for the mode I fatigue delamination growth onset <strong>of</strong><br />
unidirectional fiber reinforced (UD)-polymer matrix <strong>composite</strong>s was introduced [1]. But for estimating<br />
the behavior <strong>of</strong> existing delaminations <strong>under</strong> fatigue loads or for comparing different laminates with<br />
respect to their delamination propagation <strong>under</strong> fatigue loads and for design purposes, this is not<br />
sufficient. Therefore it is an aim to establish a test method for the characterization <strong>of</strong> the delamination<br />
growth <strong>under</strong> mode I fatigue loads. In order to allow its application in an industrial environment short<br />
test durations below 24 hours are desired. To be able to receive threshold values however, the test<br />
duration has to be increased significantly. For this reason the determination <strong>of</strong> the threshold value<br />
* Corresponding author. phone: +43 3842 402 2103; fax: +43 3842 402 2102<br />
E-mail addresses: steffen.stelzer@unileoben.ac.at
64<br />
Fifth International Conference on <strong>Fatigue</strong> <strong>of</strong> Composites<br />
should not be the main goal, but an option <strong>of</strong> a test procedure [2].<br />
Due to the possibility to automatically manufacture large structures with complex shape and high<br />
production rates, braided <strong>composite</strong>s produced with liquid resin infusion technology are increasingly<br />
considered for structural commercial aircraft components. Furthermore by using braided structures the<br />
impact and delamination resistance can be improved [3,4]. Biaxial braids consist <strong>of</strong> two yarns located at<br />
an angle <strong>of</strong> ±θ to the longitudinal direction along the mandrel axis. By adding fibers in the longitudinal<br />
direction a triaxial braid can be achieved [5]. Since the braid geometry has an influence on the<br />
mechanical properties <strong>of</strong> a part it is imperative to evaluate the differences in the performance <strong>of</strong><br />
different braid geometries. In a previous study the effect <strong>of</strong> different braid geometries on the mechanical<br />
properties <strong>of</strong> specimens loaded in tension, without holes, and compression, with and without holes,<br />
applying standardized test methods, were examined [6]. So far there are no reported fundamental<br />
fracture tests for braided <strong>composite</strong>s [7].<br />
The overall objective <strong>of</strong> the present work was to create a test protocol for mode I delamination testing<br />
<strong>of</strong> UD-laminates which is applicable in an industrial test environment (short test duration, automated<br />
data acquisition and analysis) and to study the damage tolerance <strong>of</strong> braids by fatigue crack growth tests<br />
and classical CAI tests.<br />
2 Experimental<br />
2.1 Materials and test specimens<br />
The tests were carried out in two laboratories which will be further referred to as laboratories A and B.<br />
For the UD-laminates used at laboratory A prepreg type materials were used. A 180 o C-cureable<br />
interleaf-type toughened epoxy resin system, Rigidite 5276-1 (R5276), supplied by BASF AG<br />
(Ludwigshafen, Germany) and a 380 o C-processable thermoplastic poly(ether-ether-ketone) (PEEK)<br />
matrix supplied by ICI (Östringen, Germany) were utilized. The epoxy resin was reinforced with carbon<br />
fibers <strong>of</strong> the type Celion G30-500 from BASF Structural Materials (Charlotte, USA) and the PEEK<br />
matrix with carbon fibers <strong>of</strong> the type AS4 from Hercules Inc. (Magna, USA). The two types <strong>of</strong> carbon<br />
fibers were similar in terms <strong>of</strong> fiber diameter, modulus and ultimate fiber strength and strain. In order to<br />
initiate interlaminar crack growth, a Teflon film with a thickness <strong>of</strong> 20 µm was placed at the laminate<br />
mid thickness at one end <strong>of</strong> the specimen. The epoxy resin was cured in an autoclave using vacuum bag<br />
technique and the PEEK laminates were produced using a diaphragm forming process. Double<br />
cantilever beam (DCB) specimens, 145 mm long and 20 mm wide, were machined from the laminates<br />
with a diamond saw so that the fibers were oriented along the specimen length. The specimens had a<br />
thickness (2h) <strong>of</strong> 4 mm [8].<br />
The UD-specimens tested at laboratory B were made <strong>of</strong> a 180 o C-cureable highly toughened epoxy<br />
resin system, Cycom 5276-1 (C5276), reinforced with carbon fibers <strong>of</strong> the type G40-800. The material<br />
was supplied by Cytec Engineered Materials (Anaheim, USA). A polymer film with a thickness below<br />
13 µm and a length <strong>of</strong> 50 mm, as required by ISO 15024 [9], was used to create a crack at specimen<br />
mid-thickness. The DCB specimens had a width <strong>of</strong> 20 mm, a length <strong>of</strong> 150 mm and a thickness <strong>of</strong> 3.5
S Stelzer, G Pinter, etc. / Cyclic interlaminar crack growth in unidirectional and braided <strong>composite</strong>s<br />
mm. The unidirectionally reinforced epoxy resins tested at laboratories A and B had similar mechanical<br />
properties.<br />
In laboratory A the procedure was additionally applied to braided <strong>composite</strong>s. A high-tenacity,<br />
standard modulus carbon fiber from Toho Tenax Europe GmbH (Wuppertal, D) was used for all braided<br />
preforms which were formed over a cylindrical mandrel. Afterwards the braids were removed from the<br />
mandrel, slit along the 0 o fiber direction, flattened and placed in a mold. To obtain the final thickness (4<br />
mm) <strong>of</strong> the test panels, the biaxial preforms consisted <strong>of</strong> 8 layers, while the triaxial preforms were made<br />
<strong>of</strong> 6 layers. Laminates with 300 mm in width and 500 mm in length were infused with the epoxy resin<br />
RTM 6 from Hexcel Composites (Dagneux, F) using Vacuum-Assisted Resin Transfer Molding<br />
(VARTM). All test panels were inspected ultrasonically and found to be free <strong>of</strong> voids and micro cracks.<br />
DCB specimens in the dimension <strong>of</strong> 250 x 25 mm were cut out from the laminate plates for the fracture<br />
tests using a cutting machine with a diamond-coated cutting blade. To be able to examine the influence<br />
<strong>of</strong> the crack growth direction on the delamination behavior, the specimens were cut out in 0 o<br />
(longitudinal) and 90 o (transversal) direction. A Teflon film was placed at laminate mid-thickness as<br />
starter crack at one edge <strong>of</strong> the specimens. For the compression after impact tests specimens with a<br />
length <strong>of</strong> 150 mm and a width <strong>of</strong> 100 mm were cut out <strong>of</strong> the test panels. The specimens with triaxial<br />
braid geometry were cut out in longitudinal and transversal direction like the specimens for the<br />
delamination testing. The biaxial samples, however, were only cut out in longitudinal direction.<br />
2.2 Test methods<br />
At laboratory A the fatigue crack growth measurements <strong>under</strong> mode I <strong>loading</strong> conditions were carried<br />
out on a servo-hydraulic test machine (MTS 858, MTS Systems Corporation, Berlin, Germany) and on<br />
an electro-dynamic test machine (ElectroForce 3200, Bose Corporation, Eden Prairie, USA) using the<br />
DCB specimens. The servo-hydraulic test machine had a 15 kN load cell calibrated in a load range from<br />
0 to 400 N. The electro-dynamic test machine had a load cell with a load capacity <strong>of</strong> 450 N. An R-ratio<br />
<strong>of</strong> 0.1 was used in all the measurements and the tests were carried out <strong>under</strong> displacement control. To be<br />
able to start the measurements at high crack growth rates just below GIC a quasi-static mode I test for<br />
pre-cracking was carried out as a GIC-test at a testing velocity <strong>of</strong> 3 mm/min. The displacement value at<br />
which pre-cracking was stopped, was then taken as the δ max value for fatigue <strong>loading</strong> (Figure 1).<br />
Furthermore potential influences <strong>of</strong> resin-rich areas at the end <strong>of</strong> the Teflon foil were avoided by<br />
performing this quasi-static test. The initial crack length for the cyclic test, a0, equals the crack length<br />
reached after the quasi-static test. The cyclic test was started at 5 or 10 Hz using the pre-cracked<br />
specimens and continued until a crack growth rate <strong>of</strong> about 10 -6 mm/cycle was reached. The crack<br />
length was obtained via visual observation <strong>of</strong> the crack through a traveling microscope (magnification<br />
40x). The tests were carried out in a laboratory environment <strong>of</strong> 23 o C and 50% relative humidity.<br />
The tests at laboratory B were performed on a servo-hydraulic test machine (Instron type 1273,<br />
Instron, High Wycombe, United Kingdom) with a 1 kN load cell calibrated in the load range from 0 to<br />
100 N. The tests were performed <strong>under</strong> displacement control with a frequency <strong>of</strong> 3 Hz and an R-ratio <strong>of</strong><br />
0.1. No quasi-static mode I pre-cracking was done since the polymer film <strong>of</strong> the specimens used in<br />
65
66<br />
Fifth International Conference on <strong>Fatigue</strong> <strong>of</strong> Composites<br />
laboratory B was sufficiently thin. Hence the initial crack length for cyclic testing, a0, equaled the length<br />
<strong>of</strong> the polymer film insert. The delamination lengths were monitored with a traveling microscope and<br />
the tests were done in a climate controlled laboratory (+23 o C, 50% relative humidity).<br />
Fig. 1. Force over displacement curve <strong>of</strong> a quasi-static pretest to determine δmax.<br />
At both laboratories the strain energy release rates were calculated using the modified compliance<br />
calibration (MCC) [10] and additional crack lengths were computed from the compliance data recorded<br />
during the measurements by using the calibration equation <strong>of</strong> the MCC method. By plotting da/dN over<br />
GImax in a double logarithmic scale a so called Paris plot was achieved [11, 12]. GImax was used instead<br />
<strong>of</strong> ∆GI in order to avoid an influence <strong>of</strong> facial interference on the results <strong>of</strong> the measurements [13]. All<br />
the calculations were made using an Excel-VBA-Macro provided by laboratory A.<br />
Compression after impact tests on braided <strong>composite</strong>s were carried out at laboratory A using an<br />
universal test machine (Z250, Zwick GmbH & Co. AG, Ulm, Germany) after the specimens were<br />
subjected to impacts at defined ranges <strong>of</strong> impact energies with a falling weight impact tester (Fractovis<br />
Plus S.p.A, CEAST, Pianezza, Italy). The residual compressive strengths <strong>of</strong> the specimens were<br />
assessed [14].<br />
3 Results and discussion<br />
3.1 Fracture testing<br />
In Figure 2 a comparison <strong>of</strong> two types <strong>of</strong> crack length determination is depicted. On the one hand the<br />
crack lengths were measured optically by using a traveling microscope. On the other hand the crack<br />
lengths were computed from compliance data which was recorded by the test machine automatically. It<br />
is shown that the two calculation methods give crack growth curves with the same significance.<br />
Therefore in the following diagrams only compliance calibration is applied for the calculation <strong>of</strong> the<br />
crack growth curves in order to avoid over<strong>loading</strong> <strong>of</strong> the diagrams.
S Stelzer, G Pinter, etc. / Cyclic interlaminar crack growth in unidirectional and braided <strong>composite</strong>s<br />
Fig. 2. Effect <strong>of</strong> crack length determination (optical vs. compliance calibration) on interlaminar fatigue crack growth.<br />
According to the literature [2, 7, 15, 16] a scatter <strong>of</strong> the data <strong>of</strong> up to one decade <strong>of</strong> the crack growth<br />
rate can be expected, when an interlaminar crack growth curve is recorded. Figure 3 shows the amount<br />
<strong>of</strong> scatter that was received without varying any test parameters at laboratory A.<br />
Fig. 3. Reproducibility <strong>of</strong> interlaminar fatigue crack growth tests.<br />
The length <strong>of</strong> the starter crack has an influence on the crack opening displacement, on the compliance<br />
<strong>of</strong> the specimen and on the amount <strong>of</strong> fiber bridging occurring during the test [17]. Considering this it is<br />
very important to examine the influence <strong>of</strong> the length <strong>of</strong> the starter crack on the results <strong>of</strong> t he<br />
measurements. In Figure 4 the fatigue crack growth curves for starter cracks with 30 and 50 mm can be<br />
found. To receive longer starter crack lengths, the quasi-static mode I test was carried on until the<br />
desired crack length was reached. During the measurements it was found that an increase <strong>of</strong> the length<br />
<strong>of</strong> the starter crack made it necessary to decrease the test frequencies, because a higher piston stroke<br />
was required. Hence the test frequency for the specimens with a starter crack length <strong>of</strong> 50 mm was<br />
67
68<br />
Fifth International Conference on <strong>Fatigue</strong> <strong>of</strong> Composites<br />
limited to 5 Hz. Additional problems with the 50 mm starter crack occurred at crack growth rates below<br />
10 -4 mm/cycle. The forces fell below a level that made it difficult to record them at the 15 kN<br />
servo-hydraulic test machine. This led to a big scatter in the recorded forces.<br />
Fig. 4. Effect <strong>of</strong> the length <strong>of</strong> the starter crack on interlaminar fatigue crack growth.<br />
An increase <strong>of</strong> the test frequency can, on the one hand, have a negative influence on the results <strong>of</strong> the<br />
measurements by leading to hysteretic heating <strong>of</strong> the specimen. On the other hand an increase <strong>of</strong> the test<br />
frequency, such as from 5 to 10 Hz, leads to a drastic reduction in the testing time and therefore reduces<br />
costs. In earlier tests on another type <strong>of</strong> CF-epoxy, 10 Hz did not result in hysteretic heating <strong>of</strong> the<br />
sample [2]. In Figure 5 it is shown that there was no significant influence <strong>of</strong> the test frequency on the<br />
results <strong>of</strong> the measurements, when the frequency was raised from 5 to 10 Hz.<br />
Figure 6 shows the influence <strong>of</strong> the thickness <strong>of</strong> the specimens on the results <strong>of</strong> the measurements.<br />
Through doubling the thickness <strong>of</strong> the specimen the bending stiffness is increased eight-fold. This leads<br />
to smaller crack opening displacements and makes it difficult to read the crack lengths with the<br />
traveling microscope. It is assumed that these circumstances led to the bigger amount <strong>of</strong> scatter when<br />
testing the thicker specimens. On the other hand the smaller crack opening displacements made it<br />
possible to test at higher frequencies. Thus test frequencies <strong>of</strong> 10 Hz were used for the thicker<br />
specimens. Nevertheless these effects need to be examined in more detail and exclude the use <strong>of</strong><br />
specimens with a thickness <strong>of</strong> 8 mm for the characterization <strong>of</strong> the interlaminar fatigue crack growth<br />
behavior for now.<br />
In Figure 7 the results <strong>of</strong> the measurements <strong>under</strong> displacement control are compared to the results<br />
achieved from testing in load control. Therefore all other test parameters were kept constant. It can be<br />
seen that the two test control modes yielded similar results. Testing in displacement control had the<br />
following advantages compared to testing in load control:<br />
(1) Fast crack growth occurred at the beginning <strong>of</strong> the measurements.
S Stelzer, G Pinter, etc. / Cyclic interlaminar crack growth in unidirectional and braided <strong>composite</strong>s<br />
(2) There was no need to be present all the time and the tests could be left alone over night or even for<br />
a couple <strong>of</strong> days. Crack lengths could be computed from the compliance data recorded<br />
continuously by the test machine.<br />
(3) The detection <strong>of</strong> the threshold was just a matter <strong>of</strong> testing time (given that no fiber bridging<br />
occurred and that the plastic zones remained small).<br />
Because the reproducibility <strong>of</strong> the results <strong>of</strong> standardized tests is enormously important, it was<br />
examined whether this test method can be carried out on other test machines. The results <strong>of</strong> this<br />
intra-laboratory comparison <strong>of</strong> the tests carried out on different types <strong>of</strong> test machines can be seen in<br />
Figure 8. Both machines yielded similar results, although the electro-dynamic test machine had some<br />
problems with the tuning. The low load capacity <strong>of</strong> the machine made it necessary to regularly adjust<br />
the tuning <strong>of</strong> the machine due to the change <strong>of</strong> specimen compliance during crack growth.<br />
Fig. 5. Effect <strong>of</strong> frequency on interlaminar fatigue crack growth.<br />
Fig. 6. Effect <strong>of</strong> specimen thickness (2h) on interlaminar fatigue crack growth.<br />
69
70<br />
Fifth International Conference on <strong>Fatigue</strong> <strong>of</strong> Composites<br />
Fig. 7. Effect <strong>of</strong> control mode (displacement control and load control) on interlaminar fatigue crack growth.<br />
Fig. 8. Effect <strong>of</strong> machine type (servo-hydraulic and electro-dynamic) on interlaminar fatigue crack growth.<br />
The results <strong>of</strong> an ongoing inter-laboratory comparison <strong>of</strong> this type <strong>of</strong> measurements in the framework<br />
<strong>of</strong> the European Structural Integrity Society, Technical Committee 4 (ESIS TC4) are not yet available.<br />
First results <strong>of</strong> tests on similar materials at Empa (s. Figure 9), however, indicate, that an<br />
inter-laboratory comparability <strong>of</strong> this type <strong>of</strong> measurements is given.<br />
This kind <strong>of</strong> measurements worked very well with other materials too, as can be seen in Figure 10,<br />
Figure 11 and Figure 13. Figure 10 shows the interlaminar fatigue crack growth behavior <strong>of</strong> UD-PEEK.<br />
In Figure 11 the fatigue crack growth behavior <strong>of</strong> a biaxial braid is depicted in the log da/dN versus log<br />
GImax-diagram. This figure shows some scatter in the values <strong>of</strong> GImax, which can be ascribed to two<br />
mechanisms. On the one hand, the crack growth is stopped at fibers not oriented in growth direction and<br />
the crack is deflected from its nominal growth plane (crack deflection). On the other hand a second<br />
crack plane is created (crack branching). In Figure 12 these mechanisms are shown in a picture taken
S Stelzer, G Pinter, etc. / Cyclic interlaminar crack growth in unidirectional and braided <strong>composite</strong>s<br />
during the measurements on the biaxial braids. It has to be mentioned, that the results shown here were<br />
calculated based on formulas that require the ideal case <strong>of</strong> one single and even crack plane. Hence, the<br />
results are not fully valid. Nevertheless they were reproducible and could be well used for the<br />
comparison <strong>of</strong> the two different braid architectures.<br />
Fig. 9. Comparison <strong>of</strong> the results from laboratory A with results from laboratory B.<br />
Fig. 10. Interlaminar fatigue crack growth behavior <strong>of</strong> UD-PEEK laminates.<br />
In Figure 13 the fatigue crack growth behavior <strong>of</strong> the triaxial braids is illustrated both for the<br />
longitudinal and transversal test direction. The triaxial braids tested in longitudinal direction showed a<br />
smaller influence <strong>of</strong> both crack deflection and crack branching on the fatigue crack growth data (less<br />
scatter) than those tested in transversal direction. The difference between the two different test<br />
directions was within the scatter <strong>of</strong> the data. Compared to the biaxial braids, the triaxial braids showed<br />
no significant difference in the mode I fatigue crack growth behavior.<br />
71
72<br />
Fifth International Conference on <strong>Fatigue</strong> <strong>of</strong> Composites<br />
Fig. 11. Interlaminar fatigue crack growth behavior <strong>of</strong> biaxial braids.<br />
Fig. 12. Crack deflection and crack branching in the biaxial braid.<br />
Fig. 13. Interlaminar fatigue crack growth behavior <strong>of</strong> triaxial braids.
S Stelzer, G Pinter, etc. / Cyclic interlaminar crack growth in unidirectional and braided <strong>composite</strong>s<br />
3.2 Compression after impact testing<br />
In Figure 14 the residual strength <strong>of</strong> the braided <strong>composite</strong>s is plotted as a function <strong>of</strong> the impact<br />
energy. Similar results were obtained for the triaxial braids tested in transversal direction and the biaxial<br />
braids which were tested in longitudinal direction. The values <strong>of</strong> the triaxial braids which were tested in<br />
the longitudinal direction, however, were found to be at a significantly higher level than the triaxial ones<br />
tested in transversal direction. Hence the addition <strong>of</strong> 0 o yarns leads to an increase <strong>of</strong> the compressive<br />
strength after impact values when specimens are loaded in longitudinal direction.<br />
4 Conclusion<br />
Fig. 14. Effect <strong>of</strong> braid architecture on the residual compressive strength <strong>of</strong> braided <strong>composite</strong>s.<br />
The procedure for the characterization <strong>of</strong> the interlaminar crack growth in fiber reinforced <strong>composite</strong>s<br />
proved to be an appropriate way to measure the growth <strong>of</strong> delaminations. The fatigue crack growth<br />
behavior <strong>of</strong> unidirectionally reinforced polymer laminates with matrices made <strong>of</strong> either<br />
polyetheretherketone (PEEK) or epoxy resin could be well compared. The machine parameters<br />
frequency, control mode and type <strong>of</strong> machine showed no significant influences on the results <strong>of</strong> the<br />
measurements on UD-reinforced epoxy resins. When varying the specimen parameters initial crack<br />
length and thickness, however, the results indicate the need for guidelines concerning these parameters<br />
to be able to receive reproducible results. An inter-laboratory comparison <strong>of</strong> the results <strong>of</strong> this kind <strong>of</strong><br />
measurements provided promising results. Round robin measurements were initialized to prove these<br />
findings and will be carried out by members <strong>of</strong> the ESIS TC4. [2, 18]. The interlaminar crack growth<br />
behavior <strong>of</strong> UD-PEEK samples could be measured reproducible and the PEEK samples proved to be<br />
much tougher than the epoxy resin samples.<br />
Furthermore an experimental investigation <strong>of</strong> the interlaminar crack growth in braided <strong>composite</strong>s<br />
<strong>under</strong> fatigue <strong>loading</strong> conditions showed that crack branching occurs, which increases the dissipation <strong>of</strong><br />
fracture energy in the specimen. All the braided samples showed stick slip effects, leading to crack<br />
73
74<br />
Fifth International Conference on <strong>Fatigue</strong> <strong>of</strong> Composites<br />
growth curves with a greater amount <strong>of</strong> scatter compared to the unidirectional reinforced laminates. This<br />
can be ascribed to the delamination crack interacting with the braid structure, especially with transverse<br />
fibers [19]. Nevertheless no significant difference in the fatigue delamination behavior <strong>of</strong> biaxial and<br />
triaxial braided <strong>composite</strong>s could be found. Compression after impact measurements were made to<br />
study damage tolerance <strong>of</strong> the braided <strong>composite</strong>s. It was found that the fiber orientation has a great<br />
influence on the compression after impact behavior.<br />
In all cases the mode I fatigue delamination propagation measurements <strong>under</strong> displacement control<br />
provided very reproducible results and seem to be a promising tool to characterize the delamination<br />
behavior <strong>of</strong> polymer laminates <strong>under</strong> mode I fatigue <strong>loading</strong> conditions.<br />
Acknowledgement<br />
The research work <strong>of</strong> this paper was performed at the Polymer Competence Center Leoben GmbH<br />
(PCCL, Austria) within the framework <strong>of</strong> the Kplus-program <strong>of</strong> the Austrian Ministry <strong>of</strong> Traffic,<br />
Innovation and Technology with contributions by the Montanuniversität Leoben (Institute <strong>of</strong> Materials<br />
Science and Testing <strong>of</strong> Plastics) and FACC AG (Ried im Innkreis, A). The PCCL is funded by the<br />
Austrian Government and the State Governments <strong>of</strong> Styria and Upper Austria. The authors would like to<br />
thank Mr. M. Stuart and Cytec (New Jersey, USA) for supplying UD-specimens for the measurements at<br />
Empa and Toho Tenax Europe GmbH (Wuppertal, D) for providing the carbon fibers for the braids. Test<br />
set-up, test performance and data acquisition by Mr. D. Völki at Empa is also acknowledged.<br />
References<br />
[1] ASTM E 647–00, Standard test method for measurement <strong>of</strong> fatigue crack growth rates, West Conshohocken, USA: American Society for<br />
Testing and Materials International (2008).<br />
[2] A.J. Brunner, N. Murphy, G. Pinter, Development <strong>of</strong> a standardized procedure for the characterization <strong>of</strong> interlaminar delamination<br />
propagation in advanced <strong>composite</strong>s <strong>under</strong> fatigue mode I <strong>loading</strong>, Engineering Fracture Mechanics 76 (2009) 2678-2689.<br />
[3] J.E. Masters, P.G. Ifju, A phenomenological study <strong>of</strong> triaxially braided textile <strong>composite</strong>s loaded in tension, Composites Science and<br />
Technology, 56 (1996) 347-358.<br />
[4] L.V. Smith, , S.R. Swanson, Strength design with 2-D triaxial braid textile <strong>composite</strong>s, Composites Science and Technology, 56 (1996)<br />
359-365.<br />
[5] C. Ayranci, J. Carey, 2D braided <strong>composite</strong>s: A review for stiffness critical applications, Composite Strucures, 85 (2008) 43-58.<br />
[6] M. Wolfahrt., G. Pinter, S. Zaremba, T. von Reden, C. Ebel, Effect <strong>of</strong> preform architecture on the mechanical and fatigue behavior <strong>of</strong><br />
braided <strong>composite</strong>s for generating design allowables. in „Proceedings <strong>of</strong> SAMPE Europe. Paris, France‟, Vol. 30 (2009) 277-282.<br />
[7] J. Chen, E. Ravey, S. Hallett, M. Wisnom, M. Grassi, Prediction <strong>of</strong> delamination in braided <strong>composite</strong> T-piece specimens, Composite<br />
Science and Technology 69 (2009) 2363-2367<br />
[8] M.-K. Cvitkovich, Polymer matrix effects on interlaminar crack growth in advanced <strong>composite</strong>s <strong>under</strong> monotonic and fatigue mixed-mode<br />
I/II <strong>loading</strong> conditions, PhD Thesis, University <strong>of</strong> Leoben, Austria (1995) 56-57.<br />
[9] ISO 15024, Fibre-reinforced plastic <strong>composite</strong>s – Determination <strong>of</strong> mode I interlaminar fracture toughness, GIC, for unidirectionally<br />
reinforced materials (2001).<br />
[10] K. Kageyama, M. Hojo, Proc. 5th Japan-US Conference on Composite Materials (1990) 227-234<br />
[11] P.C. Paris, F. Erdogan, A critical analysis <strong>of</strong> crack propagation laws, Journal <strong>of</strong> Basic Engineering 85 (1963) 528-534<br />
[12] D.J. Wilkins, J.R. Eisenmann, R.A. Camin, W.S. Margolis, R.A. Benson, Characterizing delamination growth in graphite-epoxy, in K.L.<br />
Reifsnider (Ed.) Damage in Composite Materials, ASTM Publications, Philadelphia, USA, 1982, pp. 168-183.<br />
[13] R.H. Martin, G.B. Murri, Characterization <strong>of</strong> mode I and mode II delamination growth and thresholds in graphite/peek <strong>composite</strong>s, NASA<br />
technical memorandum 100577 (1988) 1-52.<br />
[14] AITM 1-0010: Determination <strong>of</strong> compression strength after impact, Blagnac, France (2003).
S Stelzer, G Pinter, etc. / Cyclic interlaminar crack growth in unidirectional and braided <strong>composite</strong>s<br />
[15] R.H. Martin, G.B. Murri, Characterization <strong>of</strong> Mode I and Mode II delamination growth and thresholds in AS4/PEEK <strong>composite</strong>s, in S.P.<br />
Garbo (Ed.) Composite Materials: Testing and Design, Vol.9, ASTM Publications, Philadelphia, USA, 1990, pp. 251-270.<br />
[16] A. Argüelles, J. Vina, A.F. Canteli, M.A. Castrillo, J. Bonhomme, Interlaminar crack initiation and growth rate in a carbon-fibre epoxy<br />
<strong>composite</strong> <strong>under</strong> mode-I fatigue <strong>loading</strong>, Composite Science and Technology 68 (2008) 2325-2331<br />
[17] M. Hojo, S. Ochiai, T. Aoki, H. Ito, New simple and practical test method for interlaminar fatigue threshold in cfrp laminates, 2nd<br />
ECCM-Composites, Testing & Standardization, (1994a) 553-561<br />
[18] A.J. Brunner, I. Paris, G. Pinter, <strong>Fatigue</strong> Propagation Test Development for Polymer-Matrix Fibre-Reinforced Laminates, in „Proceedings<br />
<strong>of</strong> 12th International Conference on Fracture Ottawa, Canada‟, (2009).<br />
[19] N. Alif, L.A. Carlsson, L. Boogh, The effect <strong>of</strong> weave pattern and crack propagation direction on mode I delamination resistance <strong>of</strong> woven<br />
glass and carbon <strong>composite</strong>s, Composites Part B: Engineering 29B (1998) 603-611<br />
75
Abstract<br />
Effect <strong>of</strong> Water Uptake on the <strong>Fatigue</strong> Behavior <strong>of</strong> a<br />
Quasi-Isotropic Woven Fabric Carbon/Epoxy Laminate<br />
at Different Stress Ratios<br />
M Kawai a, *, Y Yagihashi a , H Hoshi b , Y Iwahori b<br />
1 Department <strong>of</strong> Engineering Mechanics and Energy, University <strong>of</strong> Tsukuba, Tsukuba, Ibaraki 305-8573, Japan<br />
2 Japan Aerospace Exploration Agency, Mitaka, Tokyo 181-0015, Japan<br />
The effect <strong>of</strong> absorbed moisture on the fatigue strength <strong>of</strong> a plain weave roving fabric carbon/epoxy quasi-isotropic<br />
laminate <strong>under</strong> constant amplitude <strong>loading</strong> at different stress ratios has been examined. First, constant amplitude fatigue<br />
tests are performed at room and high temperatures, respectively, on the specimens immersed in hot water until saturation<br />
as well as on the specimens kept in a dry place. The results indicate that the fatigue lives <strong>of</strong> wet specimens are shorter<br />
than those <strong>of</strong> dry specimens, regardless <strong>of</strong> stress ratio as well as test temperature. The reduction in fatigue strength due to<br />
water absorption at room temperature is about eleven percent, regardless <strong>of</strong> stress ratio. A similar reduction in fatigue<br />
strength <strong>of</strong> wet specimens occurs at high temperature. Then, the full shapes <strong>of</strong> the constant fatigue life (CFL) diagrams<br />
for the woven CFRP laminate in dry and wet environments are identified using the fatigue test data obtained at different<br />
stress ratios and at different test temperatures. The results show that the experimental CFL diagrams are asymmetric and<br />
nonlinear, and the shape <strong>of</strong> CFL envelope gradually changes. Finally, those CFL diagrams are predicted using the<br />
anisomorphic CFL diagram approach for <strong>composite</strong>s that was developed in an earlier study. Comparison with<br />
experimental results demonstrates that the theoretical method allows successfully predicting the CFL diagram for the<br />
woven CFRP laminate not only in a dry environment but also in a wet environment, regardless <strong>of</strong> test temperature.<br />
Keywords: CFRP; Woven fabric; <strong>Fatigue</strong>; Moisture; Temperature; S-N Relationship; Constant <strong>Fatigue</strong> Life Diagram<br />
1. Introduction<br />
Key application areas that benefit from the high specific stiffness and strength <strong>of</strong> carbon<br />
fiber-reinforced plastics (CFRPs) are rapidly growing, not only in the aerospace sector but also in wind<br />
energy [1], <strong>of</strong>fshore [2] and high performance vehicle [3] sectors. A larger-sized wind turbine is required<br />
to enhance efficiency. The diameter <strong>of</strong> a wind turbine rotor that allow generating more than 5 MW <strong>of</strong><br />
power, for example, exceeds the length <strong>of</strong> 100 m [1]. As the length <strong>of</strong> wind turbine blades increases, a<br />
lighter and stiffer material is needed. In deepwater <strong>of</strong>fshore applications, a target water depth <strong>of</strong> oil and<br />
gas drilling is increasing to exceed 3000 m [4]. When they are made <strong>of</strong> steel, the riser pipes for the<br />
target deep sea may suffer from their increased weight and decreased axial rigidity. Such a large riser<br />
pipe for deepwater exploration thus requires selecting a material with low weight and high stiffness, in<br />
line with a large wind turbine blade. A strong demand for reducing the emissions <strong>of</strong> carbon dioxide<br />
* Corresponding author.<br />
E-mail addresses: mkawai@kz.tsukuba.ac.jp
Effect <strong>of</strong> Water Uptake on the <strong>Fatigue</strong> Behavior <strong>of</strong> a Quasi-Isotropic Woven Fabric Carbon/Epoxy Laminate at Different R<br />
pushes automotive industries to replace conventional materials with <strong>composite</strong>s and to redesign vehicles<br />
accordingly [3].<br />
For reliable application <strong>of</strong> CFRPs to those structures, it is a prerequisite to establish a method for<br />
accurately evaluating their fatigue lives <strong>under</strong> cyclic <strong>loading</strong>. <strong>Fatigue</strong> load that CFRP structures are<br />
required to withstand differs depending on application. In general, it is characterized by variable<br />
amplitude, mean, frequency and waveform. Above all, careful consideration <strong>of</strong> the mean stress<br />
component <strong>of</strong> cyclic load is the key to accurate evaluation <strong>of</strong> the fatigue lives <strong>of</strong> CFRPs and CFRP<br />
structures. This has been proved by many experimental results for various kinds <strong>of</strong> CFRP laminates that<br />
show the significant influence <strong>of</strong> stress ratio on their fatigue lives: e.g. [5-13]. In the fatigue design <strong>of</strong><br />
<strong>composite</strong> structures, furthermore, it is essential to evaluate the maximum stress level below which the<br />
fatigue life <strong>of</strong> a given <strong>composite</strong> <strong>under</strong> constant amplitude cyclic <strong>loading</strong> becomes longer than a<br />
specified number <strong>of</strong> cycles to failure. This is because a fatigue limit defined as a stress level below<br />
which fatigue life becomes infinite cannot clearly be identified in the S-N curves for most continuous<br />
carbon fiber <strong>composite</strong> laminates, especially for the laminates in which some constituent plies are most<br />
favorably orientated in the direction <strong>of</strong> fatigue load.<br />
The effect <strong>of</strong> mean stress on the fatigue strength <strong>of</strong> a given <strong>composite</strong> laminate for a given value <strong>of</strong><br />
life can conveniently be described using a constant fatigue life (CFL) diagram. In the CFL diagram,<br />
alternating stress amplitude is plotted against mean stress for different numbers <strong>of</strong> cycles to failure.<br />
Harris et al. [5-11] have examined the CFL diagrams for various kinds <strong>of</strong> CFRP laminates, and showed<br />
that the CFL envelopes are nonlinear in shape and asymmetric about the alternating stress axis, and the<br />
peak positions are slightly <strong>of</strong>fset to the right <strong>of</strong> the alternating stress axis. The experimental results<br />
obtained from their systematic studies, along with the fatigue data from the other sources [14-17],<br />
suggest that the maxima <strong>of</strong> the CFL envelopes correspond to fatigue <strong>loading</strong> at a stress ratio almost<br />
equal to the ratio <strong>of</strong> compressive strength to tensile one.<br />
These experimental observations suggest that the linear Goodman diagram [18], which has<br />
successfully been employed in the fatigue analysis <strong>of</strong> metals, is not always valid for CFRP laminates.<br />
For design purposes, therefore, it is required to establish an engineering method for constructing a CFL<br />
diagram that is suitable for CFRP laminates. Adam et al. [7] assumed similar curves for different<br />
constant values <strong>of</strong> fatigue life and proposed an asymmetric parabolic representation <strong>of</strong> CFL diagram for<br />
a <strong>composite</strong>. Harris et al. [6] found a more general representation <strong>of</strong> CFL diagram by means <strong>of</strong> a<br />
bell-shape function. Recently, Kawai et al. [16, 17] have proposed a different method for efficiently<br />
constructing a nonlinear CFL diagram for a given <strong>composite</strong> on the basis <strong>of</strong> the static strengths in<br />
tension and compression and the reference S-N relationship for a particular stress ratio equal to the ratio<br />
<strong>of</strong> compressive strength to tensile one. This method was called anisomorphic CFL diagram approach,<br />
and shown to be valid for different types <strong>of</strong> CFRP laminates at room temperature in a dry environment.<br />
Accurate evaluation <strong>of</strong> the fatigue lives <strong>of</strong> CFRP structures needs consideration <strong>of</strong> the effects <strong>of</strong><br />
temperature and moisture, since hygrothermal environments are <strong>of</strong>ten unfavorable for the properties <strong>of</strong><br />
polymer matrices, especially epoxy resins, in CFRPs [19, 20]. The static and fatigue strengths <strong>of</strong> CFRP<br />
at high temperature are usually lower than those at room temperature; this tendency has been reported<br />
77
78<br />
Fifth International Conference on <strong>Fatigue</strong> <strong>of</strong> Composites<br />
for unidirectional carbon/epoxy laminates [21, 22] and for woven fabric carbon/epoxy laminates [23]. A<br />
similar reduction in static and fatigue strengths due to temperature has also been observed for carbon<br />
fiber-reinforced thermoplastic matrix <strong>composite</strong>s [24]. Regarding the effect <strong>of</strong> moisture mainly<br />
absorbed by the polymer matrices in <strong>composite</strong>s, many experimental studies have revealed that it<br />
reduces the tensile strengths <strong>of</strong> unidirectional carbon/epoxy laminates not only in the transverse<br />
direction [25] but also in the fiber direction [25, 26]. The reduction in tensile strength due to moisture<br />
has also been observed for multidirectional carbon/epoxy laminates <strong>of</strong> different lay-ups [27]. Ray [28]<br />
showed that the interlaminar shear strength <strong>of</strong> a carbon/epoxy laminate is lowered by water absorption.<br />
Patel and Case [29] examined the effect <strong>of</strong> water absorption on the fatigue damage and strength <strong>of</strong><br />
woven fabric carbon/epoxy laminates, and found that fiber/matrix decohesion and interlaminar<br />
delamination develop more markedly in the specimens that absorbed water, and accordingly the<br />
resistance to fatigue is degraded.<br />
These experimental results prove that the fatigue failure <strong>of</strong> a given CFRP laminate in a wet<br />
environment differs from that in a dry environment. Therefore, it is required to establish an engineering<br />
method for accurately evaluating the fatigue lives <strong>of</strong> <strong>composite</strong>s for a variety <strong>of</strong> hygro-thermal <strong>loading</strong><br />
that is characterized by the combination <strong>of</strong> <strong>loading</strong> waveform, absorbed water content and temperature.<br />
If the anisomorphic CFL diagram approach that was developed to predict the fatigue lives <strong>of</strong> <strong>composite</strong>s<br />
for different mechanical <strong>loading</strong> conditions is extended to a model that can consider the effect <strong>of</strong><br />
hygro-thermal environments, it becomes a more useful and powerful tool for engineering fatigue life<br />
analysis <strong>of</strong> <strong>composite</strong>s.<br />
In this study, therefore, the anisomorphic CFL diagram approach to prediction <strong>of</strong> fatigue life <strong>of</strong><br />
<strong>composite</strong>s is further tested for its applicability, respectively, to fatigue <strong>of</strong> a different kind <strong>of</strong> CFRP<br />
laminate (i.e., a woven fabric carbon/epoxy laminate) in dry and wet environments and to fatigue at<br />
different test temperatures. For this purpose, the effects <strong>of</strong> water absorption on the fatigue lives <strong>of</strong> the<br />
woven CFRP laminate at different stress ratios and at different test temperatures are first elucidated.<br />
Constant amplitude fatigue tests at different stress ratios are performed at room and high temperatures,<br />
respectively, on the specimens that were immersed in hot water until saturation as well as on the<br />
specimens that were not exposed to water environment but kept in a dry place. By comparing the S-N<br />
relationships for the dry and wet specimens that are obtained from testing at different temperatures, the<br />
effects <strong>of</strong> water uptake and temperature on the fatigue lives <strong>of</strong> the woven CFRP laminate <strong>under</strong> constant<br />
amplitude <strong>loading</strong> at different stress ratios are elucidated. The effect <strong>of</strong> these factors on the shapes <strong>of</strong> the<br />
CFL diagrams in dry and wet environments is also examined. Finally, the S-N relationships for different<br />
stress ratios at different temperatures in dry and wet environments are predicted using the anisomorphic<br />
CFL diagram approach, and compared with experimental results.<br />
2. Materials and Testing Procedure<br />
2.1 Material and Specimen<br />
The material used in this study was a plain weave roving fabric carbon/epoxy <strong>composite</strong>. The woven
Effect <strong>of</strong> Water Uptake on the <strong>Fatigue</strong> Behavior <strong>of</strong> a Quasi-Isotropic Woven Fabric Carbon/Epoxy Laminate at Different R<br />
fabric carbon/epoxy <strong>composite</strong> was supplied by TORAY in the form <strong>of</strong> prepreg sheets<br />
(QFC133-6E01A). Twelve-ply quasi-isotropic laminates were fabricated from the prepreg tapes with the<br />
stacking sequence <strong>of</strong> [(±45)/(0/90)]3S. The woven CFRP laminates were cured in an autoclave at 350 o F<br />
(176.6 o C). The nominal thickness <strong>of</strong> as-received laminates was about 2.4 mm.<br />
Two kinds <strong>of</strong> coupon specimens with different nominal dimensions were prepared. For static tension<br />
tests and tension-tension (T-T) fatigue tests, the long specimens based on the testing standards JIS<br />
K7073 [30] and JIS K7083 [31] were employed; as shown in Fig. 1(a), the dimensions were gauge<br />
length LG = 100 mm and width W = 20 mm. For static compression tests and compression-compression<br />
(C-C) and tension-compression (T-C) fatigue tests, on the other hand, short specimens were used to<br />
reduce the risk <strong>of</strong> buckling <strong>of</strong> specimens due to compressive load; as shown in Fig. 1(b), the dimensions<br />
were gauge length LG = 10 mm and width W = 10 mm. The nominal dimensions <strong>of</strong> the compressive<br />
specimens were determined on the basis <strong>of</strong> the testing standards JIS K7076 [32] and the report <strong>of</strong><br />
Harberle and Matthews [33] for suitable compression testing on <strong>composite</strong> laminates.<br />
20<br />
10<br />
50 100<br />
50<br />
(a) Gauge length 100 mm (tensile specimen)<br />
45 10 45<br />
(b) Gauge length 10 mm (compressive specimen)<br />
Fig. 1. Specimen geometry (dimension in mm).<br />
A set <strong>of</strong> tensile and compressive specimens were immersed in hot water <strong>of</strong> 71±1 o C until saturation,<br />
and they are referred to as wet specimens. A water bath with a digital temperature control capability and<br />
an automatic water supply function was used for preparing wet specimens. Another set <strong>of</strong> tensile and<br />
compressive specimens were kept in a dry place, and they are called dry specimens.<br />
On both ends <strong>of</strong> dry specimens, rectangular-shaped aluminum alloy tabs were glued with epoxy<br />
adhesive (Araldite) in order to protect their gripped portions. The thickness <strong>of</strong> the end-tabs was 1.0 mm<br />
for tensile specimens and 2.0 mm for compressive specimens. To wet specimens, however, end-tabs<br />
were not attached to avoid drying during their cure process. Since the 0 o layers <strong>of</strong> the laminate used in<br />
this study are protected by the ±45 o layers on the surface, it would not be much hazardous to grip the<br />
ends <strong>of</strong> wet specimens directly.<br />
79
80<br />
2.2 Testing Procedure<br />
Fifth International Conference on <strong>Fatigue</strong> <strong>of</strong> Composites<br />
Constant amplitude fatigue tests were carried out on dry and wet specimens <strong>under</strong> load control at<br />
room temperature (RT~23 o C) and at high temperature (HT = 80 o C). <strong>Fatigue</strong> load was applied to<br />
specimens in a sinusoidal waveform with a constant frequency <strong>of</strong> 10 Hz; the fatigue <strong>loading</strong> condition is<br />
based on the testing standard JIS K7083 [31].<br />
<strong>Fatigue</strong> tests were performed at three different values <strong>of</strong> stress ratio R = 0.1, 10, and , where<br />
= / and it designates the critical stress ratio that is equal to the ratio <strong>of</strong> compressive strength<br />
C T<br />
C (< 0) to tensile one T (> 0). Wet specimens were vaselined except for the gripped portions and<br />
then wrapped in a cling film in order to prevent them from drying during fatigue test. Most specimens<br />
were fatigue tested for up to 10 6 cycles. Prior to fatigue testing, static tension and compression tests<br />
were performed on the dry and wet specimens at room and high temperatures to identify the tensile and<br />
compressive strengths <strong>of</strong> the woven CFRP laminate in the testing environments. The static tests were<br />
carried out at a constant rate <strong>of</strong> 1.0%/min until ultimate failure occurred, following the testing standards<br />
JIS K7073 [30].<br />
Static and fatigue tests were conducted in 100 kN servo hydraulic MTS-810 machine. For raising the<br />
temperature <strong>of</strong> a specimen, a heating chamber with a precise digital control capability was employed.<br />
Each specimen was clamped in the heating chamber by the high temperature hydraulic wedge grips<br />
fitted on the testing machine, and it was heated up to a test temperature in air without applying load and<br />
preconditioned in a test environment for 1 h prior to testing. Variation <strong>of</strong> specimen temperature in time<br />
from the prescribed value was less than 1.0 o C. Humidity in the heating chamber was not controlled.<br />
The longitudinal and lateral strains <strong>of</strong> dry specimens in static tests were monitored with two-element<br />
L-type rosette strain gauges; the gauge length <strong>of</strong> the rosettes was 2.0 mm for tension tests and 1.0 mm<br />
for compression tests. The strain gauges were mounted back to back at the center <strong>of</strong> each specimen.<br />
3. Experimental Results and Discussion<br />
3.1 Water absorption behavior<br />
The moisture absorption behavior <strong>of</strong> the woven CFRP laminate is first observed. A set <strong>of</strong> tensile<br />
and compressive specimens were immersed in hot water <strong>of</strong> 71 o C, and the weight <strong>of</strong> the specimens was<br />
measured periodically. The immersion <strong>of</strong> the specimens in hot water was continued until near saturation<br />
<strong>of</strong> water absorption. The weigh gain M t in percent was calculated using the following equation:<br />
where 0<br />
M<br />
W -W<br />
t 0<br />
t = 100<br />
(1)<br />
W0<br />
W is the initial weight <strong>of</strong> a dry specimen, and W t is the current weight <strong>of</strong> the specimen after<br />
t hours <strong>of</strong> immersion.<br />
Fig. 2 shows the relationships between the weight gain and the square root <strong>of</strong> immersion time for the<br />
long and short specimens <strong>of</strong> the woven CFRP laminate. The solid and dashed lines indicate the<br />
absorption curves that were obtained by fitting the following simplified equation [34, 35] <strong>of</strong> the solution
Effect <strong>of</strong> Water Uptake on the <strong>Fatigue</strong> Behavior <strong>of</strong> a Quasi-Isotropic Woven Fabric Carbon/Epoxy Laminate at Different R<br />
<strong>of</strong> the Fick equation [34] to the experimental data:<br />
M t 4 Dt <br />
= tanh <br />
M <br />
h <br />
<br />
where M is the weight gain at saturation, D is the diffusion coefficient, and h is the thickness <strong>of</strong><br />
specimens. The value <strong>of</strong> the diffusion coefficient was 2.0 x 10 -7 mm 2 /s for the long specimen and 2.5 x<br />
10 -7 mm 2 /s for the short specimen. In Fig. 2, it is seen that the water absorption process <strong>of</strong> the woven<br />
carbon/epoxy laminate is well described by the Fickian diffusion model. The approximate saturation<br />
value <strong>of</strong> water absorption was about M 1.0% , and it took 2500 hours (104 days) to reach the<br />
approximate value <strong>of</strong> saturation. The values <strong>of</strong> diffusion coefficient that were obtained in this study are<br />
close to the value <strong>of</strong> 1.9 x 10 -7 mm 2 /s for the IM7/8551-7 epoxy laminate [36].<br />
3.2 Static strength<br />
Moisture Content by Weight (%)<br />
1.5<br />
1<br />
0.5<br />
Woven CFRP quasi-isotropic<br />
[(±45)/(0/90)] 3s<br />
Water temperature 71⎫C<br />
△ Short specimen<br />
◆ Long specimen<br />
0<br />
0 10 20 30 40 50 60<br />
Square root <strong>of</strong> time (h 1/2 )<br />
Fig. 2. Water absorption curve.<br />
Comparison <strong>of</strong> the tensile strengths for dry and wet specimens at room and high temperatures is<br />
shown in Fig. 3 (a). Similar comparison <strong>of</strong> the compressive strengths is also presented in Fig. 3 (b). In<br />
these figure, the average values <strong>of</strong> two or three samples are compared. The number <strong>of</strong> samples is limited,<br />
but it seems that the possible range <strong>of</strong> scatter <strong>of</strong> the static strengths in tension and compression is very<br />
small. This feature affects us favorably, and allows us to qualitatively discuss the effects <strong>of</strong> temperature<br />
and moisture on the static and fatigue strengths <strong>of</strong> the woven CFRP laminate on the basis <strong>of</strong> the limited<br />
number <strong>of</strong> data.<br />
81<br />
(2)
82<br />
3.2.1 Effect <strong>of</strong> temperature<br />
UCS, MPa<br />
UTS, MPa<br />
1000<br />
800<br />
600<br />
400<br />
200<br />
-600<br />
-500<br />
-400<br />
-300<br />
-200<br />
-100<br />
0<br />
0<br />
Fifth International Conference on <strong>Fatigue</strong> <strong>of</strong> Composites<br />
Woven CFRP quasi-isotropic [(±45)/(0/90)] 3s<br />
841.0<br />
832.0<br />
835.9<br />
790.0<br />
Dry-RT Dry-HT Wet-RT Wet-HT<br />
(a) Tensile strength<br />
Woven CFRP quasi-isotropic [(±45)/(0/90)] 3s<br />
-464.7 -422.0 -435.9 -382.0<br />
Dry-RT Dry-HT Wet-RT Wet-HT<br />
(b) Compressive strength<br />
Fig. 3. Comparison <strong>of</strong> static strengths <strong>under</strong> different hygro-thermal conditions.<br />
The tensile strengths at room temperature (RT) and high temperature (HT) are compared. The ratio <strong>of</strong><br />
dry dry<br />
the tensile strength at HT to the tensile strength at RT was (HT) / (RT) = 0.99 for dry<br />
UTS UTS<br />
wet wet<br />
specimens and (HT) / (RT) = 0.95 for wet specimens. These comparisons suggest that while it<br />
UTS UTS<br />
has no influence on the tensile strength <strong>of</strong> a dry specimen, the increase in temperature has a slightly<br />
unfavorable influence on the tensile strength <strong>of</strong> a wet specimen. A similar comparison <strong>of</strong> compressive<br />
dry dry<br />
wet wet<br />
strengths led to (HT) / (RT) = 0.91 for dry specimens and (HT) / (RT) = 0.88 for wet<br />
UCS UCS<br />
UCS UCS<br />
specimens. The latter observation reveals that the compressive strength <strong>of</strong> the woven CFRP laminate is<br />
reduced by the increase in temperature, regardless <strong>of</strong> moisture content. The ratio <strong>of</strong> tensile strength to
Effect <strong>of</strong> Water Uptake on the <strong>Fatigue</strong> Behavior <strong>of</strong> a Quasi-Isotropic Woven Fabric Carbon/Epoxy Laminate at Different R<br />
dry dry<br />
compressive one, which gives the critical stress ratio, was / = 0.55 (RT) and 0.51 (HT) for<br />
UCS UTS<br />
wet wet<br />
dry specimens, and / = 0.52 (RT) and 0.48 (HT) for wet specimens. Obviously, the<br />
UCS UTS<br />
compressive strength <strong>of</strong> the woven CFRP laminate is lower than the tensile strength, regardless <strong>of</strong><br />
temperature and water absorption.<br />
3.2.2 Effect <strong>of</strong> water absorption<br />
The strengths <strong>of</strong> dry and wet specimens that were obtained from static tests at the same test<br />
temperature are compared to extract the effect <strong>of</strong> water absorption. The ratio <strong>of</strong> the compressive strength<br />
wet dry<br />
<strong>of</strong> wet specimens to the compressive strength <strong>of</strong> dry specimens was (RT) / (RT) = 0.94 at RT<br />
UCS UCS<br />
wet dry<br />
and (HT) / (HT) = 0.91 at HT. Namely, the compressive strength <strong>of</strong> wet specimens at RT was<br />
UCS UCS<br />
about 6% smaller than that <strong>of</strong> dry specimens, and the compressive strength <strong>of</strong> wet specimens at HT was<br />
about 9% smaller. Thus, the water absorption is apt to moderately reduce the compressive strength <strong>of</strong><br />
the woven CFRP laminate, regardless <strong>of</strong> test temperature.<br />
The effect <strong>of</strong> water absorption on the tensile strength at room temperature is considered to be<br />
wet dry<br />
negligible since (RT) / (RT) = 0.99 . In contrast, the ratio at HT became<br />
UTS UTS<br />
wet dry<br />
(HT) / (HT) = 0.95 , thus suggesting that the tensile strength at high temperature is apt to be<br />
UTS UTS<br />
reduced by water absorption. A similar tendency <strong>of</strong> the reduction in tensile and compressive strengths <strong>of</strong><br />
<strong>composite</strong>s due to water absorption has been reported in literature [26, 28, 34]. Incidentally, it is<br />
considered that the reduction in static strength due to water absorption is caused by the reduction in<br />
interlaminar adhesion strength as well as the reduction in the strength <strong>of</strong> matrix according to the<br />
increase in ductility due to water absorption.<br />
3.2 <strong>Fatigue</strong> Strength<br />
The S-N relationships at room temperature are shown in Fig. 4 and Fig. 5 for dry and wet specimens,<br />
respectively. Each figure includes fatigue data for different stress ratios R = 0.1, 10 and , where<br />
=- 0.55 for dry specimens and =- 0.52 for wet specimens. The maximum fatigue stress max is<br />
plotted against the logarithm <strong>of</strong> the number <strong>of</strong> reversals to failure 2N f in the case R = 0.1 and ,<br />
while the absolute value <strong>of</strong> minimum fatigue stress min is plotted in the case R = 10. From these<br />
figures, it can clearly be observed that the S-N relationship for the woven CFRP laminate significantly<br />
depends on the shape <strong>of</strong> load waveform (i.e. stress ratio), regardless <strong>of</strong> the degree <strong>of</strong> water absorption.<br />
83
84<br />
max (| min|), MPa<br />
max (| min|), MPa<br />
1000<br />
800<br />
600<br />
Fifth International Conference on <strong>Fatigue</strong> <strong>of</strong> Composites<br />
UTS<br />
Woven CFRP quasi-isotropic<br />
[(±45)/(0/90)] 3s<br />
400<br />
200<br />
0<br />
100 101 102 103 104 105 106 107 UCS<br />
Experimental<br />
Dry-RT 10 Hz<br />
○ R = 0.1<br />
◆ R = = -0.55<br />
□ R = 10<br />
Fitted<br />
2N f<br />
Fig. 4. S-N relationships for dry specimens at room temperature<br />
1000<br />
800<br />
600<br />
UTS<br />
Woven CFRP quasi-isotropic<br />
[(±45)/(0/90)] 3s<br />
400<br />
200<br />
0<br />
100 101 102 103 104 105 106 107 UCS<br />
Experimental<br />
Wet-RT 10 Hz<br />
○ R = 0.1<br />
◆ R = = -0.52<br />
□ R = 10<br />
Fitted<br />
2N f<br />
Fig. 5. S-N relationships for wet specimens at room temperature<br />
It has been reported that the gradient <strong>of</strong> the S-N relationship becomes largest <strong>under</strong> fatigue <strong>loading</strong> at<br />
the critical stress ratio [16, 17]. Observing the results in Fig. 4 for dry specimens and Fig. 5 for wet<br />
specimens, we can confirm that also for the woven CFRP laminate tested in this study, the gradient <strong>of</strong><br />
the S-N relationship becomes largest <strong>under</strong> fatigue <strong>loading</strong> at the critical stress ratio, regardless <strong>of</strong><br />
moisture content.<br />
Comparisons <strong>of</strong> the S-N relationships for dry and wet specimens are shown in Figs. 6 (a), (b), (c) for<br />
different stress ratios R = 0.1, 10 and , respectively. We can clearly observe that the fatigue lives <strong>of</strong><br />
wet specimens are shorter than those <strong>of</strong> dry specimens, regardless <strong>of</strong> stress ratio. While the number <strong>of</strong><br />
fatigue data is limited, it is suggested that the fatigue strength <strong>of</strong> wet specimens is about 11% lower than<br />
that <strong>of</strong> dry specimens, regardless <strong>of</strong> stress ratio.<br />
The reduction in fatigue strength is affected by the reduction in static strength in general. It was
Effect <strong>of</strong> Water Uptake on the <strong>Fatigue</strong> Behavior <strong>of</strong> a Quasi-Isotropic Woven Fabric Carbon/Epoxy Laminate at Different R<br />
wet dry<br />
observed above that (RT) / (RT) = 0.99 , and thus the difference between the tensile strengths <strong>of</strong><br />
UTS UTS<br />
the dry and wet specimens at room temperature is negligible. This fact reveals that a lower fatigue<br />
strength <strong>of</strong> wet specimens for R = 0.1 and that can be seen in Figs. 6 (a) and (b) was caused by the<br />
wet dry<br />
absorption <strong>of</strong> water. On the other hand, it was observed above that (RT) / (RT) = 0.94 ,<br />
UCS UCS<br />
indicating that the compressive strength is reduced by water absorption. Therefore, it is suggested that<br />
the difference between the S-N relationships for dry and wet specimens fatigue loaded at R = 10 that<br />
was observed in Fig. 6(c) is affected by the reduction in compressive strength due to water absorption.<br />
max, MPa<br />
max, MPa<br />
1000<br />
800<br />
600<br />
400<br />
200<br />
0<br />
100 101 102 103 104 105 106 107 Experimental<br />
RT 10Hz<br />
R = -0.52 (Wet), -0.55 (Dry)<br />
○ Dry<br />
△ Wet<br />
1000<br />
800<br />
600<br />
400<br />
200<br />
UTS<br />
UTS<br />
Experimental<br />
RT 10Hz<br />
R = 0.1<br />
○ Dry<br />
△ Wet<br />
Woven CFRP quasi-isotropic<br />
[(±45)/(0/90)] 3s<br />
(a) R = <br />
2N f<br />
Fitted<br />
Woven CFRP quasi-isotropic<br />
[(±45)/(0/90)] 3s<br />
0<br />
100 101 102 103 104 105 106 107 (b) R = 0.1<br />
2N f<br />
Fitted<br />
85
86<br />
| min|, MPa<br />
600<br />
500<br />
400<br />
300<br />
200<br />
100<br />
3.3 Experimental CFL Diagram<br />
Fifth International Conference on <strong>Fatigue</strong> <strong>of</strong> Composites<br />
UCS<br />
Experimental<br />
RT 10Hz<br />
R = 10<br />
○ Dry<br />
△ Wet<br />
Woven CFRP quasi-isotropic<br />
[(±45)/(0/90)] 3s<br />
0<br />
100 101 102 103 104 105 106 107 (c) R = 10<br />
2N f<br />
Fitted<br />
Fig. 6. Comparison <strong>of</strong> S-N relationships for dry and wet specimens at room temperature.<br />
The effect <strong>of</strong> moisture absorption on the CFL diagram for the woven CFRP laminate is examined.<br />
The experimental CFL diagram can be constructed by plotting alternating stress against mean stress.<br />
Figs. 7 and 8 show the experimental CFL diagrams for dry and wet specimens at RT, respectively. In<br />
these figures, the experimental data points for different constant values <strong>of</strong> life were evaluated using the<br />
S-N curves fitted to the experimental S-N data; they are indicated by dashed lines in Figs. 4 to 6.<br />
Observing the results for dry specimens shown in Fig. 7, we can see that the CFL diagram for the woven<br />
CFRP laminate at room temperature becomes asymmetric about the alternating stress axis. The CFL<br />
envelope changes in shape as the number <strong>of</strong> cycles to failure increases. It is linear in the range <strong>of</strong> a short<br />
life but it turns nonlinear in the range <strong>of</strong> a longer life. The peak <strong>of</strong> the CFL envelope is slightly <strong>of</strong>fset to<br />
the right <strong>of</strong> the alternating stress axis, and it is associated with a stress ratio close to the ratio <strong>of</strong><br />
compressive strength to tensile one, i.e. = -0.55. It is also seen that the maximum alternating stress<br />
is accompanied at the critical stress ratio.<br />
The shape <strong>of</strong> the CFL diagram for wet specimens is similar to that for dry specimens, as can be<br />
observed in Fig. 8. The difference between the CFL diagrams for dry and wet specimens is small, since<br />
the critical stress ratio for wet specimens is = -0.52, and it is close to = -0.55 for dry specimens,<br />
along with a small difference between the absolute values <strong>of</strong> the tensile and compressive strengths.<br />
The experimental findings can be summarized as follows: (1) the CFL diagram for the woven CFRP<br />
laminate is asymmetric about the alternating stress axis, (2) the shape <strong>of</strong> CFL envelope changes in shape<br />
from a straight line to a nonlinear curve as the number <strong>of</strong> cycles to failure increases, (3) the peaks <strong>of</strong><br />
CFL envelopes correspond to fatigue <strong>loading</strong> at the critical stress ratio, and (4) all these features are<br />
common to the fatigue failure in dry and wet environments.
Effect <strong>of</strong> Water Uptake on the <strong>Fatigue</strong> Behavior <strong>of</strong> a Quasi-Isotropic Woven Fabric Carbon/Epoxy Laminate at Different R<br />
a, MPa<br />
a, MPa<br />
900<br />
600<br />
300<br />
900<br />
600<br />
300<br />
Woven CFRP quasi-isotropic<br />
[(±45)/(0/90)] 3s<br />
Experimental<br />
Dry-RT 10Hz<br />
◆ N f = 10 1 △ N f = 10 2<br />
■ N f = 10 3 ◇ N f = 10 4<br />
▲ N f = 10 5 □ N f = 10 6<br />
R = 10<br />
= - 0.55<br />
R = 0.1<br />
0<br />
-900 -600 -300 0 300 600 900<br />
m, MPa<br />
Fig. 7. Anisomorphic constant fatigue life diagram for dry specimen at room temperature<br />
Woven CFRP quasi-isotropic<br />
[(±45)/(0/90)] 3s<br />
Experimental<br />
Wet-RT 10Hz<br />
4. Prediction <strong>of</strong> CFL Diagram<br />
◆ N f = 10 1 △ N f = 10 2<br />
■ N f = 10 3 ◇ N f = 10 4<br />
▲ N f = 10 5 □ N f = 10 6<br />
R = 10<br />
= - 0.52<br />
Predicted<br />
R = 0.1<br />
0<br />
-900 -600 -300 0 300 600 900<br />
m, MPa<br />
Fig. 8. Anisomorphic constant fatigue life diagram for wet specimen at room temperature.<br />
Predicted<br />
If the CFL diagram for a <strong>composite</strong> that is exposed to a hygrothermal environment is identified over<br />
the whole range <strong>of</strong> mean stress C m T<br />
, one can efficiently predict the fatigue life <strong>of</strong> the<br />
<strong>composite</strong> for any constant amplitude fatigue <strong>loading</strong> in the given hygrothermal environment.<br />
Therefore, it is a practical demand to establish such a CFL diagram approach in the form that is suitable<br />
for <strong>composite</strong>s. The experimental results obtained from this study, along with the results from other<br />
sources [6-11, 14-17], have shown not only that the symmetric and linear Goodman diagram is not<br />
always valid for CFRP laminates, but also that modeling a CFL diagram by assuming the equi-life<br />
envelopes <strong>of</strong> similar shape for different constant values <strong>of</strong> life cannot be justified for all <strong>composite</strong><br />
systems considered.<br />
87
88<br />
Fifth International Conference on <strong>Fatigue</strong> <strong>of</strong> Composites<br />
The anisomorphic CFL diagram, which was recently proposed by Kawai et al. [16, 17], takes account<br />
<strong>of</strong> all the fundamental requirements suggested by the experimental results. The anisomorphic CFL<br />
diagram approach was shown to be valid for different types <strong>of</strong> non-woven CFRP laminates in a dry<br />
environment at room temperature. If the anisomorphic CFL diagram approach is applicable to woven<br />
CFRP laminates not only in a dry environment but also in different mechano-hygro-thermal<br />
environments, the potential usefulness <strong>of</strong> this approach for evaluating the fatigue life <strong>of</strong> <strong>composite</strong>s can<br />
be justified further. In order to answer this question, the anisomorphic CFL diagram approach is applied<br />
to the woven CFRP laminate tested in this study for different hygro-thermal environments.<br />
4.1 Anisomorphic CFL Diagram<br />
The anisomorphic CFL diagram [16, 17] is a theoretical CFL diagram that can be constructed for a<br />
given <strong>composite</strong> using only the static strengths in tension and compression and a single reference S-N<br />
relationship for the critical stress ratio . It allows predicting the S-N curves for the <strong>composite</strong> for any<br />
stress ratios in a given environment.<br />
The CFL envelope for a given constant value <strong>of</strong> life is composed <strong>of</strong> two smooth members defined in<br />
the two intervals <strong>of</strong> mean stress that are associated with tension and compression dominated failure<br />
modes, respectively. The two member curves are connected with each other on the radial straight line<br />
with a particular constant value <strong>of</strong> amplitude ratio<br />
= = - + that is<br />
( ) ( )<br />
a / m a / m (1 ) / (1 )<br />
associated with the critical stress ratio . The theoretical CFL curves are described by means <strong>of</strong> a<br />
piecewise nonlinear function that is defined by different formulas depending on the position <strong>of</strong> mean<br />
stress m in the interval [ C, T]<br />
as follows:<br />
( )<br />
2-<br />
<br />
m -<br />
m<br />
( )<br />
,<br />
( )<br />
m m <br />
T<br />
a - a T -m<br />
<br />
- = ( )<br />
( )<br />
2-<br />
<br />
a m -<br />
m<br />
( )<br />
<br />
, ( ) <br />
C mm C<br />
-m<br />
<br />
where C ( 0) and T ( 0) are the compressive and tensile strengths <strong>of</strong> the <strong>composite</strong> considered,<br />
respectively. The key quantities<br />
<strong>of</strong> the maximum fatigue stress<br />
and<br />
( )<br />
a<br />
<strong>loading</strong> at the critical stress ratio = / ;<br />
represent the alternating and mean stress components<br />
( )<br />
m<br />
( )<br />
max , respectively, for a given constant value <strong>of</strong> life f<br />
C T<br />
(3)<br />
N on fatigue<br />
( ) 1 ( )<br />
a = (1 - ) max<br />
(4)<br />
2<br />
( ) 1 ( )<br />
m = (1 + ) max<br />
(5)<br />
2<br />
The variable in Eq. (3) denotes the fatigue strength ratio for <strong>loading</strong> at the critical stress ratio ,<br />
and it is defined as<br />
( )<br />
max = (6)<br />
<br />
T
Effect <strong>of</strong> Water Uptake on the <strong>Fatigue</strong> Behavior <strong>of</strong> a Quasi-Isotropic Woven Fabric Carbon/Epoxy Laminate at Different R<br />
Note that 0 1.<br />
<br />
The reference S-N curve for the critical stress ratio is described in a normalized form by means <strong>of</strong> a<br />
continuous monotonic function <strong>of</strong> the number <strong>of</strong> cycles to failure 2 Nf= f( ) . It is fitted to the<br />
fatigue data for the critical stress ratio. It is useful to assume a particular form <strong>of</strong> the function that is<br />
given by<br />
2N<br />
1 1<br />
=<br />
K<br />
1-<br />
( ) -(<br />
L)<br />
f n b<br />
<br />
where the angular brackets denote the singular function defined as x max0, x<br />
<br />
a<br />
= , ( L)<br />
89<br />
(7)<br />
is a<br />
normalized fatigue limit, and it is determined, as in the other constants K , n , a and b , by fitting<br />
Eq. (7) to the reference fatigue data for the critical stress ratio.<br />
Incidentally, if the exponent in the piecewise-defined function is replaced with a constant value <strong>of</strong><br />
unity, the anisomorphic CFL diagram can be reduced to the following form [37]:<br />
-<br />
a -<br />
( )<br />
a<br />
( )<br />
m m<br />
( )<br />
T<br />
-m<br />
( )<br />
a<br />
( )<br />
m<br />
-m<br />
( )<br />
C -m<br />
<br />
- =<br />
<br />
,<br />
,<br />
( )<br />
m m T<br />
C m<br />
( )<br />
m<br />
which represents the asymmetric Goodman diagram. If the exponent is eliminated, the formulas<br />
for the anisomorphic CFL diagram become<br />
( )<br />
2<br />
<br />
m -<br />
m<br />
( )<br />
,<br />
( )<br />
( ) m m <br />
T<br />
a - a T -m<br />
<br />
- = ( ) <br />
( )<br />
2<br />
a m -<br />
m<br />
( )<br />
<br />
, ( ) C mm C<br />
-m<br />
<br />
which is equivalent to the asymmetric Gerber diagram [37]:<br />
4.2 Comparison with experimental results<br />
The dashed lines in Figs. 7 and 8 indicate the anisomorphic CFL diagrams predicted. The solid line in<br />
each figure by which the anisomorphic CFL diagram is bounded corresponds to static failure = 1.<br />
In these figures, it is seen that for both dry and wet specimens, the experimental CFL data for R = 0.1<br />
and 10 are in good agreements with the predicted CFL envelopes, regardless <strong>of</strong> temperature and<br />
moisture content. Note that the fatigue data for R = 0.1 and 10 were not used for predicting the<br />
anisomorphic CFL diagrams. The fatigue data used in constructing the anisomorphic CFL diagram are<br />
those only for the critical stress ratio. Thus, we can use the fatigue data for R = 0.1 and 10 in order to<br />
verify the theoretical method. Consequently, the good agreements observed for these stress ratios<br />
suggest that the anisomorphic CFL diagram approach has great potential as a preliminary tool for<br />
visualizing the mean stress dependence <strong>of</strong> the fatigue life <strong>of</strong> the woven CFRP laminate in different<br />
hygro-thermal environments.<br />
(8)<br />
(9)
90<br />
Fifth International Conference on <strong>Fatigue</strong> <strong>of</strong> Composites<br />
Using the anisomorphic CFL diagrams, we can predict the S-N relationships for constant amplitude<br />
fatigue <strong>loading</strong> at any stress ratios in the combined temperature and moisture environments. The<br />
predicted S-N curves for dry and wet specimens at room temperature are shown in Fig. 9 and Fig. 10,<br />
respectively, along with the corresponding experimental data. It is clearly seen that the predicted S-N<br />
curves for R = 0.1 and 10 agree well with the experimental results, regardless <strong>of</strong> moisture content,<br />
which is consistent with the good agreements between the predicted and experimental CFL diagrams.<br />
These comparisons thus prove that the anisomorphic CFL diagram approach allows adequately<br />
predicting the fatigue lives <strong>of</strong> the woven CFRP laminate in a wet environment as well as in a dry<br />
environment at room temperature. We obtained good predictions for dry and wet environments also at<br />
80 o C.<br />
max, MPa<br />
max, MPa<br />
1000<br />
800<br />
600<br />
400<br />
200<br />
Experimental<br />
Dry-RT 10 Hz<br />
○ R = 0.1<br />
□ R = 10<br />
Woven CFRP quasi-isotropic<br />
[(±45)/(0/90)] 3s<br />
0<br />
100 101 102 103 104 105 106 107 2N f<br />
Predicted<br />
Fig. 9. Predicted S-N relationships for dry specimens at room temperature.<br />
1000<br />
800<br />
600<br />
400<br />
Woven CFRP quasi-isotropic<br />
[(±45)/(0/90)] 3s<br />
200<br />
0<br />
100 101 102 103 104 105 106 107 Experimental<br />
Wet-RT 10 Hz<br />
○ R = 0.1<br />
□ R = 10<br />
Predicted<br />
2N f<br />
Fig. 10. Predicted S-N relationships for wet specimens at room temperature.
5. Conclusions<br />
Effect <strong>of</strong> Water Uptake on the <strong>Fatigue</strong> Behavior <strong>of</strong> a Quasi-Isotropic Woven Fabric Carbon/Epoxy Laminate at Different R<br />
The effect <strong>of</strong> water absorption on the constant amplitude fatigue strengths <strong>of</strong> a plain-weave roving<br />
fabric carbon/epoxy quasi-isotropic laminate at different stress ratios was examined. Furthermore, the<br />
anisomorphic CFL diagram approach was tested on the woven CFRP laminates that were exposed to<br />
different hygro-thermal environments. The results obtained can be summarized as follows:<br />
(1) At room temperature, the fatigue lives <strong>of</strong> wet specimens tend to become shorter than those <strong>of</strong> dry<br />
specimens, regardless <strong>of</strong> stress ratio. The reduction in fatigue strength due to water absorption was<br />
about 11 percent.<br />
(2) A similar reduction in fatigue strength due to water absorption occurred at high temperature<br />
(80 o C).<br />
(3) The S-N relationship for the woven CFRP laminate significantly depends on stress ratio, regardless<br />
<strong>of</strong> temperature and moisture content.<br />
(4) The slope <strong>of</strong> S-N relationship became largest for fatigue <strong>loading</strong> at the critical stress ratio,<br />
regardless <strong>of</strong> temperature and moisture content. Similar feature was observed in the results for dry<br />
specimens at room temperature.<br />
(5) The experimental CFL diagram for the woven CFRP laminate exhibits asymmetry and nonlinearity,<br />
regardless <strong>of</strong> test temperature and moisture content. The peaks <strong>of</strong> CFL envelopes are accompanied<br />
by fatigue <strong>loading</strong> at the critical stress ratio. The difference between the values <strong>of</strong> critical stress<br />
ratio for dry and wet specimens is small because <strong>of</strong> small difference between the static strengths in<br />
tension and compression. Accordingly, no significant difference in shape was observed between the<br />
CFL diagrams for dry and wet specimens.<br />
(6) The anisomorphic CFL diagrams predicted for different moisture-temperature conditions agree<br />
well with the experimental results. Accordingly, the S-N curves for the woven CFRP laminate that<br />
were predicted using the anisomorphic CFL diagram are in good agreements with the experiment<br />
S-N curves, regardless <strong>of</strong> water content, temperature and stress ratio. The successful agreements<br />
between the predicted and observed results suggest that the anisomorphic CFL diagram approach is<br />
potentially applicable to prediction <strong>of</strong> fatigue life <strong>of</strong> the woven CFRP laminates at different<br />
temperatures not only in a dry environment but also in a wet environment.<br />
Acknowledgement<br />
This study was supported in part by the Ministry <strong>of</strong> Education, Culture, Sports, Science and<br />
Technology <strong>of</strong> Japan <strong>under</strong> a Grant-in-Aid for Scientific Research (No. 20360050).<br />
References<br />
[1] Kensche, C., <strong>Fatigue</strong> <strong>of</strong> <strong>composite</strong>s for wind turbines, International Journal <strong>of</strong> <strong>Fatigue</strong>, Vol. 28, 2006, pp. 1363-1374.<br />
[2] Gustafson, C. and Echtermeyer, A., Long-term properties <strong>of</strong> carbon fibre <strong>composite</strong> tethers, International Journal <strong>of</strong> <strong>Fatigue</strong>, Vol. 28, 2006,<br />
pp. 1353-1362.<br />
[3] Feraboli, P. and Masini, A., Development <strong>of</strong> carbon/epoxy structural components for a high performance vehicle, Composites Part B, Vol.<br />
35, 2004, pp. 323-330.<br />
91
92<br />
Fifth International Conference on <strong>Fatigue</strong> <strong>of</strong> Composites<br />
[4] Watanabe, Y., Ito, N., Suzuki, H., Tamura, K., Optimization <strong>of</strong> a multiple traplock structure <strong>of</strong> CFRP riser pipe for deep sea drilling,<br />
proceedings <strong>of</strong> the 17th International Offshore and Polar Engineering Conference, Lisbon, July 1-6, 2007, pp.864-870, ISOPE.<br />
[5] Harris, B., editor, <strong>Fatigue</strong> in <strong>composite</strong>s. Cambridge, UK: Woodhead Publishing Limited, 2003.<br />
[6] Harris, B., Reiter, H., Adam, T., Dickson, R.F., Fernando, G., <strong>Fatigue</strong> <strong>behaviour</strong> <strong>of</strong> carbon fibre reinforced plastics, Composites<br />
1990;21(3):232-242.<br />
[7] Adam, T., Fernando, G., Dickson, R.F., Reiter, H., Harris, B., <strong>Fatigue</strong> life prediction for hybrid <strong>composite</strong>s, International Journal <strong>of</strong><br />
<strong>Fatigue</strong> 1989;11(4):233-237.<br />
[8] Harris, B., Gathercole, N, Lee JA, Reiter H, Adam T. Life-prediction for constant-stress fatigue in carbon-fibre <strong>composite</strong>s. Philosophical<br />
Transactions Royal Society <strong>of</strong> London 1997;A355:1259-1294.<br />
[9] Adam, T., Gathercole. N., Reiter, H., Harris, B., <strong>Fatigue</strong> life prediction for carbon fibre <strong>composite</strong>s, Advanced Composites Letter<br />
1992;1:23-26.<br />
[10] Gathercole, N., Reiter, H., Adam, T., Harris, B., Life prediction for fatigue <strong>of</strong> T800/5245 carbon-fibre <strong>composite</strong>s: I. constant-amplitude<br />
<strong>loading</strong>, <strong>Fatigue</strong> 1994;16:523-532.<br />
[11] Beheshty, M.H., Harris, B., Adam, T., An empirical fatigue-life model for high-performance fibre <strong>composite</strong>s with and without impact<br />
damage, Composites Part A 1999;30:971-987.<br />
[12] Kawai, M., A phenomenological model for <strong>of</strong>f-axis fatigue behavior <strong>of</strong> unidirectional polymer matrix <strong>composite</strong>s <strong>under</strong> different stress<br />
ratios, Composites Part A, Vol. 35, No. 7-8, pp. 955-963, 2004.<br />
[13] Kawai, M. and Suda, H., Effects <strong>of</strong> non-negative mean stress on the <strong>of</strong>f-axis fatigue behavior <strong>of</strong> unidirectional carbon/epoxy <strong>composite</strong>s at<br />
room temperature, J Compos Mater, 38 (10), (2004), 833-854.<br />
[14] Ramani, S.V. and Williams, D.P., Notched and unnotched fatigue behavior <strong>of</strong> angle-ply graphite/epoxy <strong>composite</strong>s, in Reifsnider KL,<br />
Lauraitis KN, <strong>Fatigue</strong> <strong>of</strong> Filamentary Composite Materials, ASTM STP 636, (1977), 27-46.<br />
[15] Ansell, M.P., Bond, I.P., Bonfield, P.W., Constant life diagrams for wood <strong>composite</strong>s and polymer matrix <strong>composite</strong>s, In: Proc. 9th Int.<br />
National Conf. on Composite Materials (ICCM 9), Madrid, Vol. V, pp. 692-699, 1993.<br />
[16] Kawai, M. A method for identifying asymmetric dissimilar constant fatigue life diagrams <strong>of</strong> CFRP laminates. Key Engineering Materials,<br />
2007;334-335:61-64.<br />
[17] Kawai, M, Koizumi, M. Nonlinear constant fatigue life diagram for carbon/epoxy laminates at room temperature. Composites Part A<br />
2007;38:2342-2353.<br />
[18] Goodman, J., Mechanics applied to engineering, Longman, Harlow, UK (1899).<br />
[19] Zhou, J. and Lucas, J.P., Hygrothermal effects <strong>of</strong> epoxy resin. Part I: the nature <strong>of</strong> water in epoxy, Polymer, Vol. 40, 1999, pp. 5505-5512.<br />
[20] Zhou, J. and Lucas, J.P., Hygrothermal effects <strong>of</strong> epoxy resin. Part II: variations <strong>of</strong> glass transition temperature, Polymer, Vol. 40, 1999,<br />
pp. 5513-5522.<br />
[21] Kawai, M., Yajima, S., Hachinohe, A. and Takano, Y., Off-axis fatigue behavior <strong>of</strong> unidirectional carbon fiber-reinforced <strong>composite</strong>s at<br />
room and high temperatures, J Compos Mater, 35(7), 2001, 545-576.<br />
[22] Kawai, M. and Sagawa, T., Temperature dependence <strong>of</strong> <strong>of</strong>f-axis tensile creep rupture behavior <strong>of</strong> a unidirectional carbon/epoxy laminate,<br />
Compos Part A, 39, 2008, 523-539.<br />
[23] Kawai, M. and Taniguchi, T., Off-axis fatigue behavior <strong>of</strong> plain woven carbon/epoxy <strong>composite</strong>s at room and high temperatures and its<br />
phenomenological modeling, Compos Part A, 37(2), 2006, 243-256.<br />
[24] Jen, M.R., Tseng, Y., Kung, H. and Hung, J.C., <strong>Fatigue</strong> response <strong>of</strong> APC-2 <strong>composite</strong> laminates at elevated temperatures, Composites Part<br />
B, Vol. 39, 2008, pp. 1142-1146.<br />
[25] Kriz, R.D. and Stinchcomb, W.W., Effects <strong>of</strong> moisture residual thermal curing stresses, and mechanical load on the damage development<br />
in quasi-isotropic laminates, In: Damage in Composite Materials, Ed. Reifsnider, K.L., ASTM STP 775, 1982, pp. 63-80, ASTM.<br />
[26] Shen, C. and Springer, G.S., Effects <strong>of</strong> moisture and temperature on the tensile strength <strong>of</strong> <strong>composite</strong> materials, Journal <strong>of</strong> Composite<br />
Materials, Vol. 11, No. 1, 1977, pp. 2-16.<br />
[27] Garg, A.C., Effect <strong>of</strong> moisture and temperature on fracture behavior <strong>of</strong> graphite-epoxy laminates, Engineering Fracture Mechanics, Vol. 29,<br />
No. 2, 1988, pp. 127-149.<br />
[28] Ray, B.C., Temperature effect during humid ageing in interfaces <strong>of</strong> glass and carbon fibers reinforced epoxy <strong>composite</strong>s, Journal <strong>of</strong><br />
Colloid and Interface Science, Vol. 298, 2006, pp. 111-117.<br />
[29] Patel, S.R. and Case, S.W., Durability <strong>of</strong> a graphite/epoxy woven <strong>composite</strong> <strong>under</strong> combined hygrothermal conditions, International<br />
Journal <strong>of</strong> <strong>Fatigue</strong>, Vol. 22, 2000, pp. 809-820.<br />
[30] JIS K7073. Testing method for tensile properties <strong>of</strong> carbon fiber-reinforced plastics. In: Japanese Industrial Standard, Japanese Standards<br />
Association, 1988.<br />
[31] JIS K7083. Testing method for constant-load amplitude tension-tension fatigue <strong>of</strong> carbon fiber-reinforced plastics. In: Japanese Industrial<br />
Standard, Japanese Standards Association, 1993<br />
[32] JIS K7076. Testing method for compressive properties <strong>of</strong> carbon fiber-reinforced plastics. In: Japanese Industrial Standard, Japanese<br />
Standards Association, 1991
Effect <strong>of</strong> Water Uptake on the <strong>Fatigue</strong> Behavior <strong>of</strong> a Quasi-Isotropic Woven Fabric Carbon/Epoxy Laminate at Different R<br />
[33] Haberle, J.G. and Matthews, F.L., An improved technique for compression testing <strong>of</strong> unidirectional fibre-reinforced plastics; development<br />
and results, Composites Part A, Vol. 25, No. 5, (1994), pp. 358-371.<br />
[34] Shen, C.H. and Springer, G.S., Moisture absorption and desorption <strong>of</strong> <strong>composite</strong> materials, Journal <strong>of</strong> Composite Materials, Vol. 10, No. 1,<br />
1976, pp. 2-20.<br />
[35] McKague, Jr EL, Reynolds, JD and Halkias, JE, Moisture diffusion in fiber reinforced plastics, ASME Journal <strong>of</strong> Engineering Materials<br />
and Technology, Vol. 98, 1976, pp. 92-95.<br />
[36] Silverman, E., Wiacek, C.R. and Griese, R.A., Characterization <strong>of</strong> IM7 graphite/thermoplastic polyetheretherketone (PEEK) for spacecraft<br />
structural applications. In: Composite Materials: Testing and Design (Tenth Volume), ASTM STP 1120, Ed. G.C. Grimes, ASTM, 1992,<br />
pp. 118-130.<br />
[37] Kawai, M., Shiratsuchi, T. and Yang, K., A spectrum fatigue life prediction method based on the nonlinear constant fatigue life diagram<br />
for CFRP laminates, Proc the 6th Asia-Australasian Conf Compos Mater (ACCM-6), Kumamoto, Kyushu, Japan, September 23-26, (2008),<br />
153-156.<br />
93
Influence <strong>of</strong> thermal and mechanical cycles on the damping<br />
<strong>behaviour</strong> <strong>of</strong> Mg based-nano<strong>composite</strong><br />
Z Trojanová a, *, A Makowska-Mielczarek b,† , W Riehemann b , P Lukáč a<br />
a Department <strong>of</strong> Metal Physics, Charles University, Prague, Ke Karlovu 5, CZ-121 16 Praha 2, Czech Republic<br />
b Institute <strong>of</strong> Material Sciences and Engineering, Clausthal University <strong>of</strong> Technology, Agricolastr. 6, D-38678 Clausthal-Zellerfeld, Germany<br />
Abstract<br />
Magnesium matrix <strong>composite</strong>s show improved wear resistance, enhanced strength and creep resistance in comparison<br />
with their monolithic counterparts, on the other hand keep low density and good machinability. Internal friction<br />
measurements are a suitable tool to detect changes in the microstructure <strong>of</strong> thermally or mechanically loaded <strong>composite</strong>s.<br />
Samples from pure magnesium reinforced with zirconia nanoparticles were thermally cycled between room temperature<br />
and increasing upper temperature <strong>of</strong> thermal cycle. After thermal cycling amplitude dependence <strong>of</strong> damping measured in<br />
terms <strong>of</strong> the decrement was measured. Very high values <strong>of</strong> the logarithmic decrement are described to the poor binding<br />
between the matrix and ceramic nanoparticles. The influence <strong>of</strong> number <strong>of</strong> cyclic bending to fatigue on the damping<br />
<strong>behaviour</strong> <strong>of</strong> the same nano<strong>composite</strong> was determined at room temperature. The measured decrease <strong>of</strong> the resonant<br />
frequency indicates a loss <strong>of</strong> stiffness during cycling. Crack deflection along an interface is followed by the separation <strong>of</strong><br />
the particle/matrix interface.<br />
Keywords: magnesium nano<strong>composite</strong>; internal friction; thermal cycling; cyclic bending; damage parameter<br />
1. Introduction<br />
New promising magnesium materials may be produced using nanosized ceramic particles as<br />
reinforcement. We may call these materials as nano<strong>composite</strong>s. Mg based nano<strong>composite</strong>s may be<br />
fabricated by mixing and comilling <strong>of</strong> microscaled metal powder with nanoscaled particles followed by<br />
hot consolidations [1,2] or by friction stir processing [3]. These methods <strong>of</strong>fer a good route to<br />
incorporate ceramic particles into the magnesium (and Mg alloys) matrix in order to form bulk<br />
<strong>composite</strong>s. These <strong>composite</strong>s may be attractive in applications because <strong>of</strong> their high strength and<br />
low-density characteristics. In practice, materials with good mechanical properties and with good ability<br />
to suppress mechanical vibrations are needed. One way to reduce the vibrations is to use high-damping<br />
materials. Various methods can be used to determine the damping characteristics. In resonant<br />
experiments where the frequency is the resonant frequency <strong>of</strong> the vibrating sample, the decay <strong>of</strong> free<br />
vibrations <strong>of</strong> the system is measured after excitation. The logarithmic decrement δ which expresses the<br />
reduction in amplitude <strong>of</strong> vibration <strong>of</strong> a freely decaying system during one cycle is defined as<br />
* Corresponding author.<br />
E-mail addresses: ztrojan@met.mff.cuni.cz<br />
† Now: Volkswagen AG, Wolfsburg, Germany<br />
δ = ln (An/An+1) (1)
Z Trojanová, etc. / Influence <strong>of</strong> thermal and mechanical cycles on the damping <strong>behaviour</strong> <strong>of</strong> Mg based-nano<strong>composite</strong><br />
where An and An+1 are the amplitudes <strong>of</strong> <strong>of</strong> the free decaying vibrations after n cycles and (n+1) cycles,<br />
respectively. Measurement <strong>of</strong> the logarithmic decrement at small strains (stresses) is a sensitive method<br />
determining the microstructure <strong>of</strong> the material. Damping as a function <strong>of</strong> temperature and/or frequency<br />
has been used to identify several cinetic processes in materials.<br />
The objective <strong>of</strong> the present paper is to estimate the influence <strong>of</strong> thermal and mechanical cycling on<br />
the damping <strong>behaviour</strong> <strong>of</strong> magnesium/ZrO2 nano<strong>composite</strong>.<br />
2. Experimental Procedure<br />
Experimental material for this study has been prepared using commercially available microcrystalline<br />
Mg powder with a particle diameter <strong>of</strong> about 20 m. ZrO2 nanoparticles with a characteristic size <strong>of</strong><br />
14 nm were prepared by evaporation with the pulsed radiation <strong>of</strong> a 1000 W Nd:YAD laser. The zirconia<br />
nanopowder and Mg micropowder were mixed together in an asymmetrically moved mixer for 8 hours,<br />
than the mixture was milled together for 1 hour, then pre-compressed in a uniaxial press and<br />
subsequently hot-extruded at 450 o C with 650 MPa extruding pressure. During extruding he original<br />
more or less uniaxial grains changed into elongated grains with the long axis in the extrusion direction.<br />
ZrO2 nanoparticles, or their agglomerates are mainly located in the grain boundaries <strong>of</strong> the resultant<br />
material.<br />
Test specimens for internal friction measurements were machined as bending beams 85 mm long with<br />
a thickness <strong>of</strong> 3 mm and 10mm width.<br />
The specimens fixed at one end were excited into resonance by a permanent magnet fixed on the free<br />
side <strong>of</strong> the bending beam and a sinusoidal alternating magnetic field. The resonant frequency was about<br />
130-140 Hz. The damping was measured as the logarithmic decrement <strong>of</strong> the free decay <strong>of</strong> the<br />
vibrating beam. The strain amplitude dependencies <strong>of</strong> the logarithmic decrement, so called internal<br />
friction curves, were measured. The specimens were sequentially annealed at increasing temperatures<br />
up to 550 o C for 0.5 h and after every heat treatment quenched into water <strong>of</strong> ambient temperature.<br />
Annealing at higher temperatures was performed in an argon atmosphere to avoid oxidation. The<br />
internal friction measurements were carried out immediately after quenching at room temperature in<br />
vacuum (about 30 Pa).<br />
Cyclic bending <strong>of</strong> the samples to fatigue was realised by the controlled bending <strong>loading</strong> <strong>of</strong> the<br />
bending beam samples in the similar apparatus as used for the damping measurements automatically<br />
controlling the amplitude and number <strong>of</strong> vibrations. The amplitude was 1x10 -3 . From the time and<br />
frequency, the number <strong>of</strong> cycles was calculated. Immediately after cycling the strain amplitude<br />
dependence <strong>of</strong> the decrement was measured. Because <strong>of</strong> different apparatus settings in comparison with<br />
the previous case the resonant frequency <strong>of</strong> the system was about 60 Hz. The end <strong>of</strong> the fatigue life <strong>of</strong><br />
the sample was manifested by the rapid decrease <strong>of</strong> the resonant frequency. The sample was cycled up<br />
to N=1.03x10 8 cycles where the sample broke.<br />
95
96<br />
3. Results<br />
Fifth International Conference on <strong>Fatigue</strong> <strong>of</strong> Composites<br />
Figure 1 shows an optical micrograph <strong>of</strong> the as prepared nano<strong>composite</strong>. The grain size estimated in<br />
the cross section was about 3 m and in the extrusion direction about 10 m. The distribution <strong>of</strong> the<br />
nanoparticles was not homogenous. The nanoparticles or their agglomerates were located mainly in the<br />
grain boundaries <strong>of</strong> the resultant material. Only several particles was found inside <strong>of</strong> grains.<br />
Fig. 1. The microstructure <strong>of</strong> as-extruded Mg/ZrO2 nano<strong>composite</strong>.<br />
Figure 2 shows the plots <strong>of</strong> the logarithmic decrement against the logarithm <strong>of</strong> the maximum strain<br />
amplitude before and after one thermal cycle between room temperature and increasing uppe r<br />
temperature <strong>of</strong> the thermal cycle.<br />
Decrement <br />
0.030<br />
0.025<br />
0.020<br />
0.015<br />
0.010<br />
0.005<br />
0.000<br />
as rec<br />
100°C<br />
200°C<br />
300°C<br />
400°C<br />
500°C<br />
10 -5 10 -4 10 -3<br />
Amplitude <br />
Fig. 2. Amplitude dependences <strong>of</strong> decrement measured at room temperature after thermal cycling at increasing upper temperature <strong>of</strong> the thermal<br />
cycle.<br />
For many metallic materials, the strain dependence <strong>of</strong> the damping capacity can be divided into a<br />
strain independent and a strain dependent component. In the case <strong>of</strong> the logarithmic decrement, the<br />
experimental finding results may be expressed as:<br />
= 0 + H () (2)<br />
0 is the amplitude independent component, found at low strain amplitudes. The component H depends<br />
on the strain amplitude and it is usually caused by dislocation depinning from weak pinning points in
Z Trojanová, etc. / Influence <strong>of</strong> thermal and mechanical cycles on the damping <strong>behaviour</strong> <strong>of</strong> Mg based-nano<strong>composite</strong><br />
the material. The critical strain cr at which the logarithmic decrement becomes amplitude dependent<br />
may be used to calculate the micro yield stress C according to the equation<br />
C = E cr (3)<br />
where E is the Young‟s modulus. From Figure 2 it can be seen that the applied thermal treatment<br />
influences previously the amplitude independent component 0, while the amplitude dependent<br />
component H varies with the upper temperature <strong>of</strong> the thermal cycle the only slightly.<br />
The logarithmic decrement plotted against number <strong>of</strong> cycles for two strain amplitudes is introduced<br />
in Figure 3. It can be seen that the decrement increases with increasing number <strong>of</strong> cycles for both<br />
amplitudes up to 2.4x10 6 cycles than slightly decreases, up to 2.9x10 7 cycles. Further cycling decreases<br />
the decrement until failure.<br />
()<br />
0.06<br />
0.05<br />
0.04<br />
0.03<br />
0.02<br />
5 x 10 -5<br />
1 x 10 -4<br />
-Mg+3%ZrO 2<br />
103 104 105 106 107 108 109 0.01<br />
number <strong>of</strong> cycles N<br />
Fig. 3. Logarithmic decrement depending on number <strong>of</strong> bending cycles at room temperature estimated for two strain amplitudes.<br />
4. Discussion<br />
4.1. Thermal cycling<br />
The amplitude independent material damping can be caused by different mechanisms (thermoelastic<br />
damping, grain boundary sliding, and point defects). The significant contribution to the damping in<br />
magnesium is dislocation damping. Temperature dependence <strong>of</strong> the amplitude independent component<br />
<strong>of</strong> the logarithmic decrement 0 is introduced in Fig. 4. It is obvious that the values <strong>of</strong> 0 are very high.<br />
Similar damping measurements were realised on a magnesium nano<strong>composite</strong> with alumina particles<br />
prepared with the same method [4]. The damping in the amplitude independent region estimated at the<br />
as received state is substantially lower 0(Mg+3n-Al2O3) = 0.00175 while 0(Mg+3n-ZrO2) = 0.0127.<br />
The high damping in the Mg+3n-ZrO2 nano<strong>composite</strong> is very probably due to weak bonding between<br />
zirconia nanoparticles in comparison with alumina nanoparticles where the bonding is nearly perfect.<br />
Very high damping in the <strong>composite</strong> with the zirconia nanoparticles is caused by an interfacial slip<br />
due to weak bonding between particles and matrix. In this case the frictional energy loss caused by<br />
sliding at the interfaces may become a primary source <strong>of</strong> damping. The damping component due to<br />
interfacial slip <strong>under</strong> the applied stress amplitude 0 can be expressed as [5-7]<br />
97
98<br />
Fifth International Conference on <strong>Fatigue</strong> <strong>of</strong> Composites<br />
2<br />
3<br />
( -<br />
)<br />
= Vp for 0 cr<br />
(4)<br />
2<br />
r 0<br />
2<br />
0<br />
EC<br />
cr<br />
where is the friction coefficient between both components <strong>of</strong> the <strong>composite</strong>, r the radial stress at the<br />
interface corresponding to stress amplitude 0 or strain amplitude 0. The critical interface strain cr<br />
corresponding to the critical interface shear stress cr is the strain at which the slip at the interfaces<br />
begins. EC is the elastic modulus <strong>of</strong> the matrix. Assuming that cr is much lower than 0 one obtains<br />
2<br />
3<br />
r = Vp<br />
(5)<br />
2 <br />
The stress concentration factor k = r/0 has been reported to be 1.1-1.3 [7]. The model does not take<br />
into account possible effects <strong>of</strong> temperature or frequency on damping and therefore, the predictions <strong>of</strong><br />
the model may be taken only as the first approximation. The effect <strong>of</strong> an additional damping due to the<br />
influence <strong>of</strong> particles can be clearly seen in Fig. 6. While the addition <strong>of</strong> alumina particles decreases the<br />
amplitude independent component, the addition <strong>of</strong> zirconia particles it expressively increases. The<br />
measured increase in 0 due to the addition <strong>of</strong> ZrO2 particles to Mg is about 0.008-0.009. Taking for the<br />
friction coefficient a typical value <strong>of</strong> 0.08, the relation (4) predicts a value for an additional damping<br />
owing to interfaces 0i = 0.04. The discrepancy between the predicted and measured value may be<br />
caused by a non-uniform strain state in specimens. They were subjected to bending and hence, strain<br />
reaches its critical value at which the interface sliding starts only in some sections <strong>of</strong> the specimen. High<br />
values <strong>of</strong> 0 obtained for Mg-zirconia nano<strong>composite</strong> is very probably caused also by the grain<br />
boundary sliding supported by diffusion processes. The dislocation contribution may be also not ruled<br />
out.<br />
Decrement 0<br />
0.014<br />
0.012<br />
0.010<br />
0.008<br />
0.006<br />
Temperature (°C)<br />
0<br />
0 100 200 300 400 500 600<br />
Fig. 4. Amplitude independent component depending on upper temperature <strong>of</strong> the thermal cycle.<br />
Decrease <strong>of</strong> the damping occurs after thermal cycling with the upper temperature higher then 250 o C<br />
is obvious from Fig. 4. This decrease indicates some changes in the interface between particles and the<br />
magnesium matrix. Nanoparticles were prepared by the evaporation with the pulsed radiation <strong>of</strong> a laser.<br />
The resulting powder was a mixture <strong>of</strong> crystalline and amorphous particles [8]. The observed decrease<br />
<strong>of</strong> damping is very probably due to partial phase transformation <strong>of</strong> ZrO2 nanoparticles and consequently<br />
better bonding at the interface.[9]. It restricts the interface sliding and energy dissipation. Thermal
Z Trojanová, etc. / Influence <strong>of</strong> thermal and mechanical cycles on the damping <strong>behaviour</strong> <strong>of</strong> Mg based-nano<strong>composite</strong><br />
cycling <strong>of</strong> the nano<strong>composite</strong> generates thermal stresses at the magnesium/zirconia interface due to a<br />
big difference between the thermal expansion coefficient (CTE) <strong>of</strong> the magnesium matrix and zirconia<br />
nanoparticles. These thermal stresses can achieve the yield stress in the matrix and then new<br />
dislocations are generated in the matrix. An increase in the dislocation density near reinforcement can<br />
be calculated as [10]<br />
B f T1 =<br />
b(1 - f ) rf<br />
where b is the magnitude <strong>of</strong> the Burgers vector <strong>of</strong> dislocations, B is a geometrical constant, the<br />
absolute value <strong>of</strong> CTE, f volume fraction <strong>of</strong> the reinforcing phase and rf its minimum size. Newly<br />
created dislocation may increase the amplitude dependent component <strong>of</strong> decrement. This increase <strong>of</strong> H<br />
= - 0 observed after thermal cycling at higher temperatures is obvious from Fig. 5 where the increase<br />
<strong>of</strong> damping is visible.<br />
- 0<br />
0.012<br />
0.010<br />
0.008<br />
0.006<br />
0.004<br />
0.002<br />
0.000<br />
-0.002<br />
400°C<br />
450°C<br />
500°C<br />
10 -5 10 -4 10 -3<br />
Amplitude <br />
Fig. 5. Amplitude dependent component measured after thermal cycling at temperatures 400-500 o C.<br />
decrement 0 x 10 3<br />
20<br />
15<br />
10<br />
5<br />
0<br />
0 200 400 600<br />
temperature (°C)<br />
Mg<br />
Mg+3n-ZrO 2<br />
Mg+3n-Al 2 O 3<br />
Fig. 6. The temperature dependence <strong>of</strong> the amplitude independent component 0 for microcrystalline Mg (Mg), Microcryslalline Mg with 3vol%<br />
<strong>of</strong> zirconia nanoparticles (Mg+3n-ZrO2) and microcrystalline Mg with 3% alumina nanoparticles (Mg+3n-Al2O3).<br />
To summarize the discussion to this point, the high damping <strong>of</strong> the Mg+3n-ZrO2 is due to the<br />
interface friction caused by weak bonding at the interface between magnesium matrix and zirconia<br />
99<br />
(6)
100<br />
Fifth International Conference on <strong>Fatigue</strong> <strong>of</strong> Composites<br />
nanoparticles. Observed decrease <strong>of</strong> the decrement after thermal cycling at temperatures higher then 250<br />
o C may be explained by the changes in the interface. The phase transformation in zirconia nanoparticles<br />
improves the bonding in the interface and restricts the interface sliding. Better bonding after thermal<br />
treatment at higher temperatures has a consequence in thermal stresses in the vicinity <strong>of</strong> the interface<br />
and newly created dislocations in plastified zones.<br />
4.2. Bending cycling<br />
The logarithmic decrement in the strain amplitude independent region at low frequencies yields in the<br />
Granato and Lücke theory [11-13]<br />
B<br />
<br />
36Gb<br />
d 4<br />
0 = (7)<br />
2<br />
where G is the unrelaxed shear modulus, b is the Burgers vector and Bd is the damping force per unit<br />
length <strong>of</strong> dislocation per unit velocity, is the dislocation density and length <strong>of</strong> the shorter dislocation<br />
segments pinned at weak pinning points, which may be foreign atoms or small clusters <strong>of</strong> the point<br />
defects. Observed increase <strong>of</strong> the decrement with the number <strong>of</strong> cycles NC (see Fig. 3) is caused by the<br />
increase <strong>of</strong> the dislocation density. Cycling in the region between 3 x 10 3 and 2.4 x 10 6 cycles leads to<br />
an increase <strong>of</strong> the decrement. The observed increase <strong>of</strong> the decrement indicates an increase <strong>of</strong> the<br />
dislocation density and also an increase in the distance between weak pinning points. Further cycling<br />
leads to the gentile decrease <strong>of</strong> the decrement up to 2.9 x 10 7 cycles. This decrease indicates a decrease<br />
<strong>of</strong> the dislocation density due to interactions between dislocations. Higher dislocation density restricted<br />
the slip length <strong>of</strong> vibrating dislocation segments. The decrement estimated for higher number <strong>of</strong> cycles<br />
then 2.9 x 10 7 decreases with increasing number <strong>of</strong> cycles. This decrease is very probably connected<br />
with the formation <strong>of</strong> crakes. This is in accordance with the development <strong>of</strong> the damage parameter with<br />
the number <strong>of</strong> cycles. The damage <strong>of</strong> the specimen after N cycles, D(N), can be defined as [14]:<br />
Damage D<br />
0.08<br />
0.06<br />
0.04<br />
0.02<br />
0.00<br />
( )<br />
D N<br />
E f<br />
= 1- = 1-<br />
(8)<br />
E f<br />
2<br />
N N<br />
2<br />
o o<br />
103 104 105 106 107 108 109 -0.02<br />
Number <strong>of</strong> cycles N<br />
Fig. 7. Damage parameter plotted against number <strong>of</strong> cycles.
Z Trojanová, etc. / Influence <strong>of</strong> thermal and mechanical cycles on the damping <strong>behaviour</strong> <strong>of</strong> Mg based-nano<strong>composite</strong><br />
where EN is an effective Young‟s modulus <strong>of</strong> the specimen after N cycles and E0 is the Young‟s modulus<br />
for N = 0 and fN and f0 are the resonant frequencies <strong>of</strong> the specimen after N cycles and for N = 0,<br />
respectively. This definition is usual and reasonable [14] because DN = 0 for undamaged specimen,<br />
D(N) increases when cracks start propagating in the specimen and DN = 1 for a broken specimen. Fig. 7<br />
shows the damage D plotted against the cycle number N. A rapid increase <strong>of</strong> D occurred for N 2 x 10 7 .<br />
The measured decrease <strong>of</strong> the resonant frequency at the end <strong>of</strong> fatigue process indicates a stiffness loss<br />
due to the formation <strong>of</strong> cracks. Moreover it indicates that in this case <strong>of</strong> <strong>composite</strong> material cracks do<br />
not lead to recognisable damping contrary to others [15-17].<br />
5. Conclusions<br />
Thermal and mechanical cycling <strong>of</strong> the Mg/ZrO2 nano<strong>composite</strong> invoked irreversible changes in the<br />
microstructure. These changes are detectable using non destructive damping measurements. Internal<br />
friction measurements are the usefull tool for the study <strong>of</strong> fatigue <strong>of</strong> materials.<br />
Acknowledgments<br />
The authors thank the Grant Agency <strong>of</strong> the Czech Republic for financial support <strong>under</strong> grant<br />
106/07/1393. This work also received a support from the Ministry <strong>of</strong> Education, Youth and Sports <strong>of</strong> the<br />
Czech Republic by the project MSM 0021620834.<br />
References<br />
[1] J. Lan, Y. Yang, X.C. Li, Microstructure and microhardness <strong>of</strong> SiC nanoparticles reinforced magnesium <strong>composite</strong>s fabricated by<br />
ultrasonic method, Mater. Sci. Eng. A, 386 (2004) 284–290.<br />
[2] H. Ferkel, B.L. Mordike, Magnesium strengthened by SiC nanoparticles, Mater. Sci. Eng. A 298 (2001) 193–199.<br />
[3] S.F. Hassan, M. Gupta, Development <strong>of</strong> high performance magnesium nano-<strong>composite</strong>s using nano-Al2O3 as reinforcement Mater. Sci.<br />
Eng. A 392 (2005) 163–168.<br />
[4] Z. Trojanová, W. Riehemann, H. Ferkel, P. Lukáč. Internal friction in microcrystalline magnesium reinforced by alumina particles, J.<br />
Alloys Comp. 310 (2000) 396-399.<br />
[5] N.N. Kishore, A. Gosh, B.D. Agarwal, Damping characteristics <strong>of</strong> fiber <strong>composite</strong>s with imperfect bonding, J. Reinforced Plastics and<br />
Composites 1 (1982) 40-64.<br />
[6] D.J. Nelson, J.W. Hanckok, Interfacial slip and damping in fibre reinforced <strong>composite</strong>s, J. Mater. Sci. 13 (1978) 2429-2440.<br />
[7] J. Zhang, R.J. Perez, E.J. Lavernia, Effect <strong>of</strong> SiC and graphite particulates on the damping behavior <strong>of</strong> metal matrix <strong>composite</strong>s, Acta<br />
Metall. Mater. 42 (1994) 395-409.<br />
[8] H. Ferkel, W. Riehemann, Laser-induced solid solution <strong>of</strong> the binary nanoparticle system Al2O3-ZrO2, Nanostructured Mater., 8 (1997)<br />
457-464.<br />
[9] I. Molodetsky, A. Navrotsky, M.J. Paskowitz, V.J. Leppert, S.H. Risbud, Energetics <strong>of</strong> X-ray-amorphous zirconia and the role <strong>of</strong> surface<br />
energy in its formation. J. Non-Crystalline Solids 262, 2000, 106-113.<br />
[10] R.J. Arsenault, N. Shi, Dislocations generation due to differences between the coefficients <strong>of</strong> thermal expansion, Mater. Sci. Eng., 81<br />
(1986) 151-187.<br />
[11] A.V. Granato, K. Lücke, Theory <strong>of</strong> mechanical damping due to dislocations, J. Appl. Phys. 27 (1956) 583-593.<br />
[12] A.V. Granato, K. Lücke, Applicaton <strong>of</strong> dislocation theory to internal friction phenomena at high frequencies, J. Appl. Phys. 27 (1956)<br />
789-805.<br />
[13] A.V. Granato, K. Lücke, Temperature dependence <strong>of</strong> amplitude-dependent dislocation damping, J. Appl. Phys. 52 (1981) 7136-7142.<br />
[14] J. Lemaitre, A Course on Damage Mechanics, Berlin, Springer, 1996.<br />
[15] J. Göken, W. Riehemann, Damping <strong>behaviour</strong> <strong>of</strong> AZ91 magnesium alloy with cracks, Mat. Sci. Eng. A 370 (2004) 417-421.<br />
101
102<br />
Fifth International Conference on <strong>Fatigue</strong> <strong>of</strong> Composites<br />
[16] A. Mielczarek, Z. Trojanová, W. Riehemann, P. Lukáč, Influence <strong>of</strong> mechanical cycling on damping <strong>behaviour</strong> <strong>of</strong> short fibrereinforced<br />
magnesium alloy QE22, Mat. Sci. Eng. A442 (2006) 484-487.<br />
[17] W. Riehemann, Z. Trojanova, A. Mielczarek, <strong>Fatigue</strong> in magnesium alloy AZ91 Alumina fiber <strong>composite</strong> studied by internal friction<br />
measurements, Procedia Engineering 2 (2010) 2151-2160.
Delamination during fatigue testing on carbon fiber fabrics<br />
reinforced PPS laminates<br />
Abstract<br />
J Bassery *, J Renard †<br />
Centre des matériaux P. M. Fourt, Mines-Paris Tech, CNRS UMR 7633, BP 87, F-91003 Evry, Cedex<br />
This paper discusses the static and fatigue <strong>behaviour</strong> and damage development in satin 5 carbon/pps woven fabric<br />
<strong>composite</strong> laminates. First, the orthotropic elastic stiffness matrix <strong>of</strong> 0 o -ply laminate has been determined by a global<br />
mechanical study in static (tensile, bending and compression tests). Then, an elastoviscoplastic model has been clearly<br />
identified to characterize the 45 o oriented sample <strong>behaviour</strong> during static tests (tensile, creep, torsion and<br />
tension-relaxation tests). Finally, fatigue tensile-tensile tests were performed and lead to in-situ observations <strong>of</strong><br />
delamination, by using a high resolution camera. The experimental results show that the stiffness evolution follow two<br />
stages (onset then stabilization) for 0 o ply and angle-ply laminates too. This evolution is correlated with damage<br />
mechanism: transverse crack and delamination. But the maximum stiffness reduction is low and close to the experimental<br />
dispersion. Therefore, in a simplified approach, the onset delamination criterion has been identified on static tests. This<br />
criterion, based on Coulomb friction law, has been identified thanks to Arcan-Mines tests, and also comparison between<br />
2D ½ dimensional finite element model analyzis <strong>of</strong> tensile sample and experimental results. The home made<br />
Arcan-Mines device is an original experimental and initially used to qualify adhesive bonding assemblies. It has been<br />
modified to determine interface strength in carbon fiber fabric reinforced PPS laminates. The main interest <strong>of</strong> this testing<br />
device is to provide <strong>multiaxial</strong> state <strong>of</strong> stress as well as in tension than in shear or compression while always remaining a<br />
homogenous state <strong>of</strong> stress at the interface. The interface strengths (in tension or in shear) are directly used in the onset<br />
delamination criterion and give a good agreement between model predictions and experimental results.<br />
Keywords: carbon fiber fabric reinforced PPS laminate; onset delamination criterion; elastoviscoplastic model; Arcan-Mines test; static tests;<br />
fatigue tests<br />
1. Introduction<br />
The objective <strong>of</strong> this study is to predict initiation <strong>of</strong> delamination in polyphenylenesulfide (PPS)<br />
reinforced carbon fiber fabrics <strong>composite</strong>s laminates during fatigue testing. In transportation<br />
engineering fields such as aeronautics or aerospace, <strong>composite</strong> materials have many applications<br />
because <strong>of</strong> their high strength/weight ratio. Thermosetting resin, even if they present interesting<br />
mechanical properties, are also characterized by undeniable drawbacks such as the necessity to be stored<br />
at low temperatures, some difficulties to control the reticulation process, a very long curing process and<br />
a handmade draping that generates most <strong>of</strong> the non reversible defects during the manufacturing process.<br />
In such a context, high-performance thermoplastic resins represent a promising alternative to solve<br />
thermosetting resins problems. Indeed, thermoplastic matrix <strong>of</strong>fer a number <strong>of</strong> advantages compared to<br />
* E-mail address: josserand.bassery@ensmp.fr<br />
† E-mail address: jacques.renard@ensmp.fr
104<br />
Fifth International Conference on <strong>Fatigue</strong> <strong>of</strong> Composites<br />
conventional thermosetting resins such as epoxies. Thermoplastics exhibit good chemical resistance as<br />
well as an excellent damage and impact resistance and may be used over a wide range <strong>of</strong> temperatures.<br />
They have a very low level <strong>of</strong> moisture uptake which means their mechanical properties are less<br />
degraded <strong>under</strong> hot/wet conditions. Thermoplastic <strong>composite</strong> materials require different manufacturing<br />
and repair techniques. It is possible to get thermoplastic based laminates with complex shapes in few<br />
stages thanks to a therm<strong>of</strong>orming process. In addition, unlike thermosetting resins, thermoplastics may<br />
be re-melted after they are formed providing recycling possibilities. They can also be welded by heating<br />
and pressure process close to their melting point. However, thermoplastic <strong>composite</strong>s are more difficult<br />
to repair than conventional thermosetting <strong>composite</strong>s and high-performance thermpolastics are more<br />
expensive. A wide range <strong>of</strong> thermoplastics are available but in the area <strong>of</strong> high-performance<br />
thermoplastics, PPS <strong>composite</strong>s are probably the most used. Because this material can exhibit a high<br />
crystallinity rate and high glass transition temperature. Crystallinity in high-performance polymers is<br />
important because it has a strong influence on chemical and mechanical properties: the crystalline phase<br />
tends to increase the stiffness and tensile strength while the amorphous phase is more effective in<br />
absorbing impact energy. Further a high glass transition temperature means that the mechanical<br />
properties remain stable <strong>under</strong> a wide range <strong>of</strong> temperature. Nevertheless, before making structural parts<br />
in thermoplastics <strong>composite</strong>s, an accurate knowledge <strong>of</strong> the mechanical <strong>behaviour</strong> is needed as well in<br />
static [1] and in fatigue [2] and tensile tests have to be performed. When during fatigue testing<br />
delamination defined as the debonding between two adjacent layers occurs, very <strong>of</strong>ten that means a<br />
rapid and detrimental failure for the structure. Thus in order to establish a criterion able to predict<br />
delamination onset, fatigue tests at different stress levels and Arcan-Mines [3] tests have been<br />
performed.<br />
2. Delamination onset criterion<br />
Fig. 1. Illustration <strong>of</strong> the material used during this work.<br />
First, we suppose the homogeneity <strong>of</strong> the layers and their linear elastic <strong>behaviour</strong>. In the case <strong>of</strong> a flat<br />
smooth tension sample, the criterion is based on the following assumptions:<br />
-A normal negative strength (compression) delays the delamination onset in shear (modes II and III);<br />
-on the contrary, a positive normal stress accelerates the delamination onset.<br />
-finally a normal negative strength is shear equal zero, cannot provoke the delamination onset.<br />
These remarks are summarized by the law <strong>of</strong> Coulomb [4] describing the friction between two<br />
bodies.<br />
Therefore, the criterion rated c is written like this:
J Bassery, J Renard / Delamination during fatigue testing on carbon fiber fabrics reinforced PPS laminates<br />
+ - -<br />
( ) T ( ) ( )<br />
2 2 2<br />
2 2 2<br />
3 / 1 1 3 / 1 2 2 3 / 2<br />
c = F Y + F + k F S + F + k F S<br />
(1)<br />
(<br />
-<br />
) (<br />
-<br />
)<br />
(<br />
+<br />
2<br />
) 2<br />
T (<br />
2<br />
) 2 (<br />
2<br />
) 2<br />
2 2<br />
2 2<br />
3 0 = 1 + 1 3 / 1 + 2 + 2 3 / 2<br />
If F therefore c F k F S F k F S<br />
If F 0 therefore c = F / Y + F / S + F / S<br />
3 3 1 1 2 2<br />
<br />
With F = n; F = n; F = n; n : normal strength<br />
1 13 2 23 3 33<br />
The scale mark <strong>of</strong> the study is: 1=warp, 2=weft and 3=thickness.<br />
The bending tests on three-points closed bearing show the shear mode II and the shear mode III are<br />
equivalent (see fig.8) so S1=S2=S and k1=k2=k. The parameters YT and S characterizing the interface<br />
strength between different layers have to be identified from literature [5]. In our case, such information<br />
is lacking concerning carbon fiber fabrics reinforced PPS laminates. We proposed an original<br />
experimental set-up, home made Arcan-Mines device, originally used to qualify adhesive bonding<br />
assemblies, and which has been modified to determine interface strength in carbon fibber fabrics<br />
reinforced PPS laminates. The parameter k characterizing the friction capacity between two layers has<br />
to be determined by comparison between observations make during tension tests and finite element<br />
analysis. In order to be independent from the mesh, the stresses needed for the criterion have to be<br />
calculated with a non-local method.<br />
Average method: it consists in averaging the stresses on a domain extending until a certain<br />
critical length rated a0.For each stresses used in the criterion; a critical length has to be known.<br />
But in the rest <strong>of</strong> this paper, only one critical length will be considered for the three out <strong>of</strong> plane<br />
stresses.<br />
a0<br />
( ) 1/ ( )<br />
a = a d<br />
(3)<br />
ij 0 0 ij<br />
0<br />
Gradient method: this one consists in taking into account the first derivative <strong>of</strong> the out <strong>of</strong><br />
plane stresses on a given area rated h.<br />
( y) = + y + h / 2 - y - h / 2<br />
(4)<br />
( ) ( )<br />
ij ij ij ij<br />
Then, the two methods are combined in one.<br />
a0<br />
1<br />
( a ) = ( y) + ( y + h / 2 ) - ( y - h / 2)(<br />
y) dy<br />
(5)<br />
ij 0<br />
ij ij ij<br />
a0<br />
0<br />
Before the numerical simulations, the elastic static <strong>behaviour</strong> <strong>of</strong> the studied material has to be found.<br />
3. Static <strong>behaviour</strong><br />
3.1 Orthotropic elastic stiffness matrix<br />
3.1.1 Definition<br />
The sudied material is a <strong>composite</strong> laminate with seven plies <strong>of</strong> harness satin five fabrics draped at 0 o .<br />
So the material exhibits three plans <strong>of</strong> symmetry, two by two orthogonal meaning that the elastic<br />
<strong>behaviour</strong> is orthotropic. This <strong>behaviour</strong> is described by the stiffness matrix C ij (with i, j = 1, 2, 3) or the<br />
105<br />
(2)
106<br />
Fifth International Conference on <strong>Fatigue</strong> <strong>of</strong> Composites<br />
compliance matrix Sij trough Hooke‟s law. Using Voigt notation, the Hooke‟s law <strong>of</strong> the matrix<br />
<strong>behaviour</strong> is described by:<br />
1 C11 C12 C13 0 0 0 1 1<br />
S11 S12 S13<br />
0 0 0 1<br />
<br />
<br />
<br />
2 <br />
C21 C22 C23 0 0 0<br />
<br />
2 <br />
2 <br />
S21 S22 S23<br />
0 0 0<br />
<br />
2<br />
3 C31 C32 C33<br />
0 0 0 3 3 S31 S32 S33<br />
0 0 0 3<br />
= ou = <br />
4 0 0 0 C44<br />
0 0 4 4 0 0 0 S44<br />
0 0 4 <br />
<br />
5 0 0 0 0 C55<br />
0 <br />
5 <br />
5 0 0 0 0 S55<br />
0 <br />
5<br />
<br />
<br />
<br />
<br />
6 0 0 0 0 0 C <br />
66 <br />
6 <br />
<br />
<br />
<br />
6 0 0 0 0 0 S <br />
<br />
66 <br />
6 <br />
The engineering moduli (Young modulus, Poisson ration, shear modulus) are directly related to the<br />
compliance constants. Hence, the elastic matrix is:<br />
1 1/ E1 -12/ E1 -13/<br />
E1<br />
0 0 0 1<br />
<br />
<br />
2 -21/ E2 1/ E2 -23/<br />
E2<br />
0 0 0<br />
<br />
2<br />
3 -31/ E3 -32/<br />
E3 1/ E3<br />
0 0 0 <br />
3<br />
= <br />
4 0 0 0 1/ G23<br />
0 0 4<br />
0 0 0 0 1/ G 0 <br />
<br />
5 13<br />
5<br />
<br />
<br />
<br />
<br />
<br />
<br />
<br />
6 0 0 0 0 0 1/ G <br />
12 <br />
6<br />
By definition, compliance and rigidity matrix are symmetrical.<br />
That means that: S12=S21, S13=S31 and S23=S32 so an additional relation is obtained:<br />
The compliance elastic matrix becomes:<br />
/ E = / E ; / E ; / E = / E<br />
(8)<br />
21 2 12 1 31 3 23 2 32 3<br />
1 1/ E1 -12/ E1 -13/<br />
E1<br />
0 0 0 1<br />
<br />
<br />
2 -12/ E1 1/ E2 -23/<br />
E2<br />
0 0 0<br />
<br />
2<br />
3 -13/ E1 -23/<br />
E2 1/ E3<br />
0 0 0 <br />
3<br />
= <br />
4 0 0 0 1/ G23<br />
0 0 4<br />
0 0 0 0 1/ G 0 <br />
<br />
5 13<br />
5<br />
<br />
<br />
<br />
<br />
<br />
<br />
<br />
6 0 0 0 0 0 1/ G <br />
12 <br />
6<br />
In order to determine the Young moduli E1and E2, the Poisson ratio ν12 and the shear modulus G12,<br />
tension tests in the warp, weft and in 45 o directions were realized. The E3 modulus was obtained by<br />
making compression test on small disk in the thickness direction. Finally, three-point bending tests<br />
allowed estimating the shear modulus G13 and G23. The others Poisson ratios ν13 and ν23 are estimated<br />
with a simple rule <strong>of</strong> mixture and literature values.<br />
3.1.2 Experimental results<br />
3.1.2.1 Tensile tests<br />
According to standard NF EN 2561, tensile test were performed on 250mm*25mm samples cut in the<br />
warp, weft and 45 o directions. The samples <strong>of</strong> PPS matrix are reinforced with a carbon fiber fabric<br />
draped in 0 o <strong>of</strong> 7 plies in the thickness. On each end <strong>of</strong> the samples, 60mm tabs are made in glass epoxy,<br />
in order to observe failures outside the tensile machine jaws. Furthermore, these samples are dried at<br />
least one day before the test in an oven at 70 o C. The mechanical tests were realized with an Instron<br />
(6)<br />
(7)<br />
(9)
J Bassery, J Renard / Delamination during fatigue testing on carbon fiber fabrics reinforced PPS laminates<br />
tensile testing machine equipped with a 100 KN load cell and two extensometer sensors which allow<br />
measuring the longitudinal and transverse displacements (fig.2). For warp and weft directions, the<br />
experimental curves are plotted with nominal strain εn and stress ζn, the definitions <strong>of</strong> which are: (10)<br />
F<br />
n = and <br />
S<br />
0<br />
l<br />
and Δl the current extension.<br />
n = where F is the current load, S0 the initial cross-section, l0 the initial gage length<br />
l0<br />
Fig.2. Experimental set-up for tensile tests [5].<br />
Tensile test in the warp and weft directions<br />
In the warp and weft directions, the <strong>behaviour</strong> is elastic and not strain rate dependent (fig.3 a and b).<br />
It‟s due that in both cases; the <strong>behaviour</strong> <strong>of</strong> <strong>composite</strong> is controlled by the fibers. The Young moduli<br />
E1and E2 are the slopes <strong>of</strong> these curves. Their respectively mean values are about 60.59 GPa and 63.38<br />
GPa. The Poisson ration ν12 have been also calculated from these experiments and estimated at 0.048.<br />
The values <strong>of</strong> E1 and E2 are very close because <strong>of</strong> the fabric which is balanced.<br />
Stress (MPa)<br />
800<br />
700<br />
600<br />
500<br />
400<br />
300<br />
200<br />
100<br />
Tension test in warp direction<br />
ε'=1e-5/s<br />
ε'=1e-4/s<br />
ε'=1e-3/s<br />
0<br />
0.0000 0.0010 0.0020 0.0030 0.0040 0.0050 0.0060 0.0070 0.0080 0.0090 0.0100 0.0110 0.0120 0.0130 0.0140<br />
Strain (-)<br />
Stress (MPa)<br />
800<br />
700<br />
600<br />
500<br />
400<br />
300<br />
200<br />
100<br />
Tension test in weft direction<br />
0<br />
0.0000 0.0010 0.0020 0.0030 0.0040 0.0050 0.0060 0.0070 0.0080 0.0090 0.0100 0.0110 0.0120 0.0130<br />
(a) (b)<br />
Fig. 3. Tensile test curves in (a) the warp, (b) weft directions.<br />
Tensile in the 45o direction<br />
In the 45 o direction, a non-elastic and strain rate dependent <strong>behaviour</strong> can be observed (fig.4).<br />
Because it‟s the matrix <strong>composite</strong> this controls the <strong>behaviour</strong> <strong>of</strong> the <strong>composite</strong> beyond axis <strong>of</strong> the<br />
solicitation. Here, the plotted curve is obtained with true strain and stress which are respectively<br />
calculated from:<br />
l<br />
Strain (-)<br />
( 0 ) ( ( 0 ) 0 ) ( 0 ) ( )<br />
= l / l = ln l / l = ln l + l / l = ln 1 + l / l = ln 1+<br />
<br />
(10)<br />
true<br />
l<br />
n<br />
0<br />
ε'=1e-5/s<br />
ε'=1e-4/s<br />
ε'=1e-3/s<br />
107
108<br />
Fifth International Conference on <strong>Fatigue</strong> <strong>of</strong> Composites<br />
-1<br />
( ) ( ) ( ) ( )<br />
= F / S = F S l / l = Fl / S l = F( l + l ) / S l = F / S 1 + l / l = (1 + ) (11)<br />
true 0 0 0 0 0 0 0 0 0 n n<br />
G12 is calculated from the slope <strong>of</strong> the previous curve and also with this formula:<br />
( ( ) )<br />
G = F S - <br />
(12)<br />
12 / 2 0 xx yy<br />
Where F is the current load, S0 is the initial cross section and, εxx and εyy are the longitudinal and<br />
transverse strains. The mean value <strong>of</strong> G12 is about 3.99 GPa.<br />
Stress (MPa)<br />
250<br />
200<br />
150<br />
100<br />
50<br />
Tension test in 45° direction<br />
0<br />
0.0000 0.0250 0.0500 0.0750 0.1000 0.1250 0.1500<br />
Strain (-)<br />
Fig. 4. Tensile tests in the 45 o direction at different strain rates.<br />
3.1.2.2 Compression test on small disk in the thickness direction<br />
The compression samples are obtained by core-drilling <strong>under</strong> water and have a diameter equal to 18<br />
mm in order to be at least two times superior to the weave size (here 7 mm). All the samples are greased<br />
to limit friction strengths and placed between two compression plates. The displacement between both<br />
plates is measured by a linear variable differential transformer (LVDT). All the tries were made at<br />
ambient temperature, with a constant cross-beam speed (equal to 0.035mm/min) and below a maximum<br />
ε'=1e-5/s<br />
ε'=1e-4/s<br />
ε'=1e-3/s<br />
ε'=1e-2/s<br />
load <strong>of</strong> 50 KN to avoid any damage on the load cell. The results are the following:<br />
Stress (MPa)<br />
-20<br />
-40<br />
-60<br />
-80<br />
-100<br />
-120<br />
-140<br />
-160<br />
-180<br />
-200<br />
Compression test on small disk sample in the thickness direction<br />
0<br />
0.000 0.025 0.050 0.075 0.100 0.125 0.150<br />
Strain (-)<br />
Sample 1<br />
Sample 2<br />
Sample 3<br />
Sample 4<br />
Sample 5<br />
Sample 6<br />
Sample 9<br />
Sample 8<br />
Sample 10<br />
Fig. 5. Compression test on small disk sample in the thickness direction.<br />
The curves are obtained by using the following formulas:<br />
2 ( )<br />
= 4 F / and = d / e<br />
(13)<br />
nc 0 nc 0<br />
Where F is the current load, 0 is the initial sample diameter, d is the plate displacement measured by<br />
the LVDT and e0 is the initial sample thickness. So here, only nominal stress and strain are considered.
J Bassery, J Renard / Delamination during fatigue testing on carbon fiber fabrics reinforced PPS laminates<br />
The Young modulus E3 is the slope <strong>of</strong> the previous curve (fig.5). In order to stay in static stage, the<br />
imposed cross-beam speed corresponds to a strain rate <strong>of</strong> 10 -4 s -1 . Because <strong>of</strong> the setting up <strong>of</strong><br />
compression plates and the friction strengths, the curves beginning are all biased. Therefore, the elastic<br />
constant will be determined only for stresses included between -40 and -180 MPa, that means where the<br />
<strong>behaviour</strong> is linear. Due to the difficulty to set perfectly the sample in the centre <strong>of</strong> compression plates,<br />
a substantial dispersion <strong>of</strong> the results is obtained. Anyway, the mean value, equal to 2.94 GPa, is close to<br />
the literature one [6]. Its value is small compare to E 1 and E2 but gets the same order <strong>of</strong> magnitude than<br />
the shear modulus G12. So for compression in the thickness direction, it‟s the resin which supports the<br />
load. In conclusion, by hypothesis the Young modulus E3 measured in compression will be equivalent to<br />
the tensile one.<br />
3.1.2.3 Three-point bending tests<br />
According to the standard EN 2563, bending test samples, the dimensions <strong>of</strong> which are 20*10mm<br />
were cut with diamond saw according to the warp and weft directions. The bending assembly used<br />
supports having all radiuses equal to 3mm and worked on tensile testing machine (fig.6). In order to<br />
observe an intralaminar shear failure, the distance between the fixed supports is 5 times the sample<br />
thickness. The deflection was measured by a LVDT setted in the middle <strong>of</strong> both fixed supports and the<br />
strength was recorded by a load cell <strong>of</strong> 25 KN. All the experiments were at room temperature and with a<br />
constant cross-beam speed (equal in 1mm / min).<br />
Fig. 6. Experimental set-up for three-point bending test.<br />
The experimental curves (strength versus deflection) are plotted below:<br />
Strength (N)<br />
Sample 1<br />
Sample 2<br />
Sample 3<br />
Sample 4<br />
Sample 5<br />
-0.45 -0.40 -0.35 -0.30 -0.25 -0.20 -0.15 -0.10 -0.05<br />
0<br />
0.00<br />
Deflection (mm)<br />
Fixed supports<br />
1 750<br />
1 500<br />
1 250<br />
1 000<br />
750<br />
500<br />
250<br />
Strength (N)<br />
Sample 1<br />
Sample 2<br />
Sample 3<br />
Sample 4<br />
Sample 5<br />
Shifted support<br />
LDVT<br />
-0.45 -0.40 -0.35 -0.30 -0.25 -0.20 -0.15 -0.10 -0.05<br />
0<br />
0.00<br />
Deflection (mm)<br />
(a) (b)<br />
Fig. 7. Three-point bending test curves in the (a) warp, (b) weft directions<br />
1 600<br />
1 400<br />
1 200<br />
1 000<br />
800<br />
600<br />
400<br />
200<br />
109
110<br />
Fifth International Conference on <strong>Fatigue</strong> <strong>of</strong> Composites<br />
In both cases, the bending <strong>behaviour</strong> is mainly linear (fig.7). The beginning <strong>of</strong> the try is a little bit<br />
biased because all the clearances <strong>of</strong> the experimental set-up have to be <strong>of</strong>fset. Around 1.5 KN, a<br />
non-linearity appears. It‟s due to the outbreak <strong>of</strong> delamination cracks in the sample (fig.8). So for<br />
staying in the linear part, the slope <strong>of</strong> these curves will calculated from 0.2 and 1 KN. Also, the imposed<br />
cross-beam speed matches with a strain rate equal to 10 -3 s -1 .<br />
The experimental dispersion is not so much important.<br />
Fig. 8. Delamination observed by optical microscopy after a three-point closed bearing bending test (in red, the delamination cracks).<br />
The strength and deflection measured can be linked to the elastic moduli by this equation [7]:<br />
deflection<br />
( ) ( )<br />
= + (14)<br />
3<br />
Fl / 48 EI0 Fl / 4GkS0<br />
Where θdeflection is the deflection in the middle <strong>of</strong> the sample, F the current load, I 0 the initial moment <strong>of</strong><br />
inertia <strong>of</strong> the cross-section, k is a shear correction factor (equal to 5/6), S0 the initial cross-sectional area,<br />
and l the length between the two fixed supports. Besides E is the Young modulus and G the shear<br />
modulus.<br />
The geometrical constants are defined by:<br />
the initial width and the thickness <strong>of</strong> the sample.<br />
3<br />
0 = 0 0 /12 , S0 = b0h0 with b0 and h0 are in that order<br />
I b h<br />
The elastic moduli have to be separated from the experimental results, it means:<br />
( ) deflection<br />
( )<br />
1/ E + 6 h / 5l G = 4 b h / Fl<br />
(15)<br />
2 2 3 3<br />
0 0 0<br />
The ratio θdeflection against F is the inverse <strong>of</strong> the slope <strong>of</strong> the curve introduced above. So in the warp<br />
direction, equation (15) becomes:<br />
And in the weft direction, equation (13) gives:<br />
( ) deflection<br />
( )<br />
1/ E + 6 h / 5l G = 4 b h / Fl<br />
(16)<br />
2 2 3 3<br />
1 0 13 0 0<br />
( ) deflection<br />
( )<br />
1/ E + 6 h / 5l G = 4 b h / Fl<br />
(17)<br />
2 2 3 3<br />
2 0 23 0 0<br />
Thanks to the tensile test, E1 and E2 are known. Hence, the mean values <strong>of</strong> G13 and G23 are 2.17 and<br />
2.12 GPa. Even in shear, the fabric <strong>of</strong> the study seems to be balanced. In the aim to check the accuracy<br />
<strong>of</strong> the correctional shear factor rated k, elastic finite element analyses have been performed. These<br />
results (fig.9 a and b) demonstrated that the mean values <strong>of</strong> G13 and G23 are pertinent.
Strength (N)<br />
Sample 1<br />
Sample 2<br />
Sample 3<br />
Sample 4<br />
Sample 5<br />
J Bassery, J Renard / Delamination during fatigue testing on carbon fiber fabrics reinforced PPS laminates<br />
Simulation<br />
-0.45 -0.40 -0.35 -0.30 -0.25 -0.20 -0.15 -0.10 -0.05<br />
0<br />
0.00<br />
Deflection (mm)<br />
1 800<br />
1 600<br />
1 400<br />
1 200<br />
1 000<br />
800<br />
600<br />
400<br />
200<br />
Strength (N)<br />
Sample 1<br />
Sample 2<br />
Sample 3<br />
Sample 4<br />
Sample 5<br />
Simulation<br />
-0.40 -0.35 -0.30 -0.25 -0.20 -0.15 -0.10 -0.05<br />
0<br />
0.00<br />
Deflection (mm)<br />
(a) (b)<br />
Fig. 9. Comparison between elastic simulations and results <strong>of</strong> three-points closed bearing bending tests in the (a) warp, (b) weft directions.<br />
3.1.2.4 Average orthotropic elastic stiffness matrix<br />
From the average different elastic moduli, the stiffness matrix (expressed in GPa) is equal to:<br />
61.113.431.06000 <br />
<br />
3.43 63.92 1.07 0 0 0<br />
<br />
1.06 1.07 2.97 0 0 0 <br />
R = <br />
0 0 0 3.99 0 0 <br />
0 0 0 0 2.17 0 <br />
<br />
<br />
<br />
0 0 0 0 0 2.16<br />
<br />
This stiffness matrix will be used for finite element analyses.<br />
3.2 Non-linear <strong>behaviour</strong> <strong>of</strong> the 45 o oriented samples<br />
3.2.1 Test on torsion bench on 45 o oriented samples<br />
The tensile tests in the 45 o direction put in evidence a non-linear <strong>behaviour</strong>. To determine the model<br />
<strong>of</strong> hardening (isotropic or kinematic), it is necessary to stress the material, outside its elastic domain,<br />
alternately in tension then in compression by way <strong>of</strong> zero. This experiment can be done on a tensile<br />
testing machine but it‟s a complex realization because <strong>of</strong> the risk <strong>of</strong> buckling <strong>of</strong> the sample. For this<br />
material, it is easiest to introduce a plane shear trough a torsional moment (fig.10a). Therefore, tests on<br />
a driven angle torsion bench (alternately positive then negative) have been accomplished (fig.10b).<br />
(a) (b)<br />
Fig. 10. (a) Angle driven torsion bench and (b) the setting <strong>of</strong> the sample.<br />
1 600<br />
1 400<br />
1 200<br />
1 000<br />
800<br />
600<br />
400<br />
200<br />
111
112<br />
Fifth International Conference on <strong>Fatigue</strong> <strong>of</strong> Composites<br />
From the current torque rated C, the nominal shear stress is given by this equation [8]:<br />
2 ( 0 0)<br />
= C / kb h<br />
(18)<br />
n<br />
Where k is a constant which depends on the ratio b0 against h0 (here, k=0.285), b0 and h0 are<br />
respectively the initial width and thickness <strong>of</strong> the sample.<br />
The result <strong>of</strong> a test at 2 o /s is shown below:<br />
Fig. 11. Torsion test results at 2 o /s.<br />
Beyond an angle <strong>of</strong> 30 o , the <strong>behaviour</strong> is non-linear as well as in tension than in compression. It<br />
corresponds in tension to a yield point equal to 60 MPa which is close to the one find during the tensile<br />
tests. At a shear stress <strong>of</strong> 69 MPa for reaching an angle <strong>of</strong> 50 o , the failure <strong>of</strong> the sample, provoked by<br />
delamination, is observed (fig.12).<br />
Fig. 12. Observation <strong>of</strong> the sample‟s edge after a torsion test by optical microscopy.<br />
This test demonstrates that the ratio between the yield point in tension and the one in compression<br />
remains constant along all the <strong>loading</strong> time (table 1). In conclusion, the hardening model will be an<br />
isotropic one.<br />
Table 1. Table <strong>of</strong> yield points after a torsion test
3.2.2 Creep/ recovery test<br />
J Bassery, J Renard / Delamination during fatigue testing on carbon fiber fabrics reinforced PPS laminates<br />
The tensile tests in the 45 o direction show that the <strong>behaviour</strong> is sensitive to the strain rate. To specify<br />
the flow law which describes the viscosity, creep/recovery tests (fig.13) at different stress levels were<br />
realized.<br />
Fig. 13. Creep test machine and fastening <strong>of</strong> a sample with its strain gauge sensor.<br />
The tests have been made on Mayes creep testing machine equipped with a 20 KN load cell and one<br />
extensometer sensor, for measuring the longitudinal displacement, with an initial gage length equal to<br />
25 mm. The levels <strong>of</strong> load were corresponding to 20,30,40,50,60,70,80 and 90 % <strong>of</strong> the average tensile<br />
strength (fig.15 a). For every test, a stabilization <strong>of</strong> the evolution <strong>of</strong> the longitudinal strain was waited<br />
before switching to a recovery test. Thus, a complete description <strong>of</strong> the primary and secondary creep<br />
stages was made (Fig.14). After load removal, recovery test was stopped as soon as the evolution <strong>of</strong> the<br />
longitudinal strain was observed; in order to record relevant non reversible strains (fig.15 b).<br />
Above 30% <strong>of</strong> the tensile strength (50 MPa), irreversible strains are recorded and the evolution <strong>of</strong><br />
longitudinal strain is non-linear. This limit is similar to the yield point obtained during the tensile test.<br />
So in first approach, the <strong>behaviour</strong> <strong>of</strong> the 45 o oriented sample will be an elastoviscoplatic model (below<br />
the yield point, the viscous part <strong>of</strong> the strain will be disregarded). The law <strong>of</strong> the flow describing the<br />
viscosity will be a Norton one.<br />
Fig. 14. Illustration <strong>of</strong> the different creep stages.<br />
113
114<br />
Fifth International Conference on <strong>Fatigue</strong> <strong>of</strong> Composites<br />
Creep stress (MPa)<br />
150<br />
130<br />
110<br />
90<br />
70<br />
50<br />
30<br />
10<br />
0.11; 65.91<br />
0.13; 50.05<br />
0.00; 32.86<br />
0.25; 81.98<br />
0.52; 99.32<br />
3.50; 115.25<br />
4.32; 131.17<br />
5.47; 143.42<br />
0.0 0.5 1.0 1.5 2.0 2.5 3.0 3.5 4.0 4.5 5.0 5.5 6.0<br />
-10<br />
(a) (b)<br />
Non reversible strain (%)<br />
Fig. 15. (a) Results <strong>of</strong> creep/ recovery tests, (b) evolution <strong>of</strong> non-reversible strains on 45 o oriented samples.<br />
3.2.3 Elastoviscoplastic model for 45 o oriented samples<br />
The experimental study reveals that the mechanical response <strong>of</strong> 45 o oriented samples is non linear and<br />
strain rate dependent (figs.4, 11 and 15). Therefore, the chosen <strong>behaviour</strong> law is an isotropic hardening<br />
associated with a Norton flow rule (fig. 16). The law formulation comes from the thermodynamic theory<br />
<strong>of</strong> solids mechanics. In case <strong>of</strong> small strain, the total strain ε t can decomposed on a reversible part ε e<br />
(elastic) and a non reversible part ε in (inelastic).<br />
The elastic <strong>behaviour</strong> is modelled by the Hooke‟s law.<br />
t e in<br />
= + <br />
(19)<br />
e 1 <br />
= - tr( ) I -<br />
<br />
E E<br />
(20)<br />
where E and ν are respectively the Young modulus and the Poisson ratio.<br />
The isotropic hardening is defined by the relation:<br />
0<br />
bp ( 1 )<br />
R R Hp Q e -<br />
= + + - (21)<br />
where R is the hardening variable, p is the cumulated plastic strain, H is the linear constant, Q and b are<br />
the non linear constants. H, Q and b depend on the material.<br />
And p measures the strain path and its strain rate p <br />
is expressed as:<br />
and p <br />
is given by the Norton flow rule:<br />
in in<br />
<br />
p = 2 / 3 : <br />
<br />
( ) /<br />
where f(ζ) is the Yield function, K and n are the materials parameters.<br />
In this case, the Yield function is defined by the Von Mises criterion:<br />
<br />
n<br />
1/2<br />
(22)<br />
p = f K<br />
(23)<br />
( ) ( )<br />
0<br />
where J depends on the second invariant <strong>of</strong> the stress tensor deviator:<br />
f = J - R<br />
(24)<br />
J ( ) = 3 / 2 s : s<br />
(25)
J Bassery, J Renard / Delamination during fatigue testing on carbon fiber fabrics reinforced PPS laminates<br />
with s the stress tensor deviator.<br />
In conclusion, 6 materials parameters have to be identified.<br />
Fig. 16. Comparison between numerical simulation <strong>of</strong> elastoviscoplastic model and tensile test on 45 o oriented sample.<br />
3.2.4 Identification <strong>of</strong> the elastoviscoplastic model parameters for 45 o oriented samples<br />
In order to evaluate the ratio <strong>of</strong> viscosity in the material, tension-relaxation tensile tests have been<br />
also performed. These tests, which are driven in strain, consist in achieving a succession <strong>of</strong> strain levels<br />
from 0.1% to 15%. The experimental protocol is this one (fig.17a):<br />
a. Increase <strong>of</strong> the deformation, at a constant strain rate, until the wished level (here 1%),<br />
b. Maintaining the deformation until the complete stress relaxation,<br />
c. Un<strong>loading</strong>, at the same strain rate, until the stress reaches zero.<br />
A complete stress relaxation means a stabilisation <strong>of</strong> its value (Fig.17b). So, the higher strain will be,<br />
the more the time at a constant strain level will be long. The tests were realized on the tensile testing<br />
machine described above. Therefore, the viscosity should be erased.<br />
Strain (%)<br />
1.75<br />
1.5<br />
1.25<br />
1<br />
0.75<br />
0.5<br />
0.25<br />
0<br />
a<br />
b<br />
0 1 000 2 000 3 000 4 000 5 000 6 000 7 000 8 000<br />
Temps (s)<br />
c<br />
110<br />
100<br />
90<br />
80<br />
70<br />
60<br />
50<br />
40<br />
30<br />
20<br />
10<br />
0<br />
1 500 2 000 2 500 3 000 3 500<br />
Time (s)<br />
4 000 4 500 5 000 5 500<br />
Fig. 17. (a) Experimental protocol <strong>of</strong> the tension-relaxation tests and (b) illustration <strong>of</strong> complete stress relaxation.<br />
3 tests are conducted with tensile test machine at constant strain rate <strong>of</strong> 10 -4 s -1 (Fig.18) on 45 o<br />
oriented samples. Above a strain <strong>of</strong> 0.6%, the <strong>behaviour</strong> is non-linear and then non reversible strains are<br />
measured. After a strain <strong>of</strong> 5%, the <strong>behaviour</strong> is more rigid. Indeed, the multiplication <strong>of</strong> the damages<br />
(Fig.19) allows the fibbers to be aligned in the straining direction. Around a strain <strong>of</strong> 15%, the sample<br />
breaks in the middle <strong>of</strong> its inside length. The non reversible strains values are close to the ones find in<br />
creep test. As the reproducibility <strong>of</strong> the experiment is correct, the use <strong>of</strong> the mean values, in order to<br />
identify the elastoviscoplastic model, is wise. The green curve represents the mean <strong>behaviour</strong> without<br />
Stress (MPa)<br />
115
116<br />
Fifth International Conference on <strong>Fatigue</strong> <strong>of</strong> Composites<br />
viscosity <strong>of</strong> 45 o oriented samples, so it will serve to identify the hardening parameters (R0, H, Q and b).<br />
The red curve represents the mean <strong>behaviour</strong> with viscosity <strong>of</strong> 45 o oriented samples, thus it will serve to<br />
identify the Norton flow rule parameter (K and n). The curves are plotted with true stress and true strain.<br />
Fig. 18. Experimental results <strong>of</strong> tension-relaxation tests.<br />
Fig. 19. In situ observations <strong>of</strong> the sample edge at strain <strong>of</strong> 5% during a tension-relaxation test on oriented sample at 45 o .<br />
The curves obtained are used as comparison with the stress/strain curve given by the finite element<br />
code Zebulon. By an iterative optimisation loop, all the elastoviscoplatic model parameters are found.<br />
The convergence criterion is the congruence <strong>of</strong> experimental and numerical curves by the least-squares<br />
method (Fig.202a). As a first approach, with the purpose <strong>of</strong> not including the damages in the chosen<br />
model, the numerical are stopped at a strain <strong>of</strong> 5%. In order to check the validity <strong>of</strong> the abovementioned<br />
material coefficients (their values are given in table 2), the complete simulation (Fig.20b) <strong>of</strong> the<br />
tension-relaxation test is run. The global envelope is well represented but the description <strong>of</strong> the<br />
un<strong>loading</strong> part is too much elastic. The model needs to be improved by adding a description <strong>of</strong> the<br />
damages.<br />
Table 2. Elastoviscoplatic model parameters for 45 o oriented samples
J Bassery, J Renard / Delamination during fatigue testing on carbon fiber fabrics reinforced PPS laminates<br />
(a) (b)<br />
Fig. 20. Comparison between experimental and numerical stress/strain curves <strong>of</strong> tension-relaxation tests for 45 o oriented samples: (a)<br />
identification <strong>of</strong> the elastoviscoplastic model parameters, (b) validation <strong>of</strong> the found parameters.<br />
3.3 Arcan-Mines tests<br />
For <strong>composite</strong> material structures, delamination remains a harmful damage mode leading to a rapid<br />
ruin. This phenomenon is bound to the resistance between plies in mode I (tension), II (shear) and III<br />
(see paragraph 2). With the Arcan-Mines experimental set-up [9], the parameters YT and S,<br />
characterizing the interface strength between different layers respectively in mode I and mode II) are<br />
going to be identified.<br />
3.3.1 Experimental protocol<br />
The Arcan-Mines device is able to apply a multi-axial state <strong>of</strong> stress in tensile, compressive and shear<br />
<strong>loading</strong> (fig.21). This set-up is made <strong>of</strong> two half circular disks which are joined together thanks to the<br />
test specimen (fig.22a). Each test specimen is composed <strong>of</strong> a <strong>composite</strong> sample bonded between two<br />
metal substrates (here in steel) by an epoxy adhesive. So this test is able to analyze hybrid bonded<br />
assembly (fig.22b) <strong>behaviour</strong> (steel-epoxy-<strong>composite</strong>-epoxy-steel).<br />
(a) (b)<br />
Fig. 21. Arcan-Mines device supported by a tensile testing machine: (a) global set up, (b) the Arcan-Mines set up.<br />
117
118<br />
Fifth International Conference on <strong>Fatigue</strong> <strong>of</strong> Composites<br />
(a) (b)<br />
Fig. 22. Illustrations <strong>of</strong> Arcan-Mines experimental set-up for <strong>composite</strong> sample: (a) tension and shear configurations; (b) hybrid bonded sample.<br />
Such a test requires an appropriate surface preparation (grinding, sandblasting, chemical attack, and<br />
flame). Tested specimen required special treatment too. Samples have to be honed with a diamond saw<br />
in order to reduce the tested interface and to be sure to localize the breaking area (fig.25). Dimensions<br />
<strong>of</strong> the <strong>composite</strong> sample are 70*10mm.<br />
3.3.2 Experimental results<br />
Fig. 23. Composite sample geometry for Arcan-Mines test.<br />
The tests are realized on a tensile test machine at <strong>loading</strong> rate <strong>of</strong> 7N/s, equipped with a 5 KN load cell<br />
and high resolution extensometers (measurement base <strong>of</strong> 10 mm). To illustrate the reliability <strong>of</strong> this test,<br />
results on woven angle-ply laminate (0 o /+45 o /0 o /+45 o /0 o /-45 o /0 o Mode I Arcan-Mines test on ) are shown (fig.24 and 25).<br />
0°/+45°/0°/+45°/0°/-45°/0° layer <strong>of</strong> c/pps<br />
Stress (MPa)<br />
12<br />
10<br />
8<br />
6<br />
4<br />
2<br />
0<br />
0.000 0.025 0.050 0.075 0.100 0.125 0.150 0.175 0.200 0.225 0.250 0.275 0.300<br />
Longitudinal strain (%)<br />
(a) (b)<br />
Fig. 24. (a) Experimental curve, (b) failure surfaces <strong>of</strong> C/PPS <strong>composite</strong> (mode I, tension).
Stress (MPa)<br />
30<br />
25<br />
20<br />
15<br />
10<br />
5<br />
0<br />
J Bassery, J Renard / Delamination Mode II Arcan-Mines during fatigue test testing on on carbon fiber fabrics reinforced PPS laminates<br />
0°/+45°/0°/+45°/0°/-45°/0° layer <strong>of</strong> c/pps<br />
0.00 0.20 0.40 0.60 0.80 1.00 1.20 1.40 1.60 1.80 2.00 2.20 2.40<br />
Shear strain (%)<br />
(a) (b)<br />
Fig. 25. (a) Experimental curve, (b) failure surfaces <strong>of</strong> C/PPS <strong>composite</strong> (mode II, shear).<br />
In both case, a failure in the middle <strong>of</strong> the sample (so between the 0 o ply and 45 o ply) is observed<br />
(fig.24b and fig.25b). Moreover, one <strong>of</strong> the failure surfaces has a black colour that means there is no<br />
resin on it. This observation can be confirmed by a differential scanning calorimetry. Anyway, the<br />
fiber/matrix adhesion has been broken. Then, the Arcan-Mines test gives the intrinsic values <strong>of</strong> the<br />
resistance between plies for the studied carbon/pps laminate. The <strong>behaviour</strong> <strong>of</strong> the used epoxy has been<br />
characterized by previous Arcan-Mines tests. Thereby, the reduction <strong>of</strong> the tested interface has been<br />
sized, in order that in tension as well as in shear, the adhesive <strong>behaviour</strong> stays in its elastic domain. So<br />
by subtraction, the <strong>composite</strong> <strong>behaviour</strong> is obtained (fig.28). Also, the Young modulus <strong>of</strong> steel is higher<br />
than the adhesive one or the <strong>composite</strong> one (50 times as big), in consequence the hypothesis, that the<br />
extension due to the steel is negligible, is valid.<br />
(a) (b)<br />
Fig. 26. Analytic measurements for Arcan-Mines test in tension and in shear.<br />
119
120<br />
Fifth International Conference on <strong>Fatigue</strong> <strong>of</strong> Composites<br />
For tension (Fig.28a), the strain ε and stress ζ are given by these equations (30 and 31):<br />
With Δltotal is the extension measured by extensometer sensor.<br />
Or l 0<br />
So<br />
And<br />
steel<br />
ltotal = l<strong>composite</strong> + ladhesive + lsteel<br />
(26)<br />
ltotal = l<strong>composite</strong> + ladhesive<br />
(27)<br />
( )<br />
l = 2 e F / E S<br />
(28)<br />
adhesive adhesive adhesive<br />
Where F is the current load, eadhesive the initial thickness <strong>of</strong> the adhesive, S1 the bonded surface and<br />
Eadhesive the adhesive‟s Young modulus.<br />
Therefore<br />
In conclusion,<br />
and<br />
( )<br />
l = l - 2 e F / E S<br />
(29)<br />
<strong>composite</strong> total adhesive adhesive<br />
2<br />
1<br />
= F / S<br />
(30)<br />
<strong>composite</strong><br />
( ( 1)<br />
)<br />
= l - 2 e F / E S / e<br />
(31)<br />
<strong>composite</strong> total adhesive adhesive <strong>composite</strong><br />
S2 is the reduced section and e<strong>composite</strong> the initial thickness <strong>of</strong> the <strong>composite</strong> sample.<br />
For shear (fig.28b), the strain γ and stress η are given by the equations (36 and 37):<br />
l = l + l + l<br />
(32)<br />
total <strong>composite</strong> adhesive steel<br />
With δltotal is the extension measured by extensometer sensor.<br />
Or l 0<br />
So<br />
And<br />
steel<br />
l = l + l<br />
(33)<br />
total <strong>composite</strong> adhesive<br />
( ( 1)<br />
)<br />
l = 2e tan F / G S<br />
(34)<br />
adhesive adhesive adhesive<br />
Where F is the current load, eadhesive the initial thickness <strong>of</strong> the adhesive, S1 the bonded surface and<br />
Gadhesive the adhesive‟s shear modulus.<br />
Therefore<br />
In conclusion,<br />
And<br />
( ( 1)<br />
)<br />
l= l-<br />
2 e *tan F / G S<br />
(35)<br />
<strong>composite</strong> total adhesive adhesive<br />
= F / S<br />
(36)<br />
<strong>composite</strong><br />
( ( ( 1)<br />
) )<br />
2<br />
= l-<br />
2 e *tan F / G S / e<br />
(37)<br />
<strong>composite</strong> total adhesive adhesive <strong>composite</strong><br />
S2 is the reduced section and e<strong>composite</strong> the initial thickness <strong>of</strong> the <strong>composite</strong> sample.<br />
In tension below a stress <strong>of</strong> 10 MPa and in shear below a stress <strong>of</strong> 24MPa, the <strong>behaviour</strong> is linear<br />
(fig.24a and fig.25a). Then in both case, till the failure, the <strong>composite</strong> has a non-linear <strong>behaviour</strong>. In
J Bassery, J Renard / Delamination during fatigue testing on carbon fiber fabrics reinforced PPS laminates<br />
order to determine the origin <strong>of</strong> this non-linearity, acoustic emission instrumentation has been associated<br />
to the Arcan-Mines device. By comparison between tests on only adhesive and ones on <strong>composite</strong>, an<br />
amplitude threshold at 60dB has established that, in both case, this non-linearity is due to delamination.<br />
So the elastic limits obtained by Arcan-Mines tests will correspond to the parameters YT and S<br />
(respectively mode I and mode II) <strong>of</strong> the onset delamination criterion. From 7 tests (on the same<br />
material but on different laminates) for each case (tension or shear), the mean YT is equal to 12.74 MPa<br />
and the mean S is equal to 23.71 MPa. Compare to carbon/epoxy laminates, these values are low. It is,<br />
probably, due a weak fibber/matrix adhesion. In perspective, the Arcan-Mines device will be used to<br />
quantify the fatigue impact on interface strengths on carbon/pps <strong>composite</strong>s.<br />
4. <strong>Fatigue</strong> study<br />
4.1 Experimental set-up<br />
<strong>Fatigue</strong> tension-tension tests were made on hydraulic testing system with a load control mode<br />
(fig.27a). Axial extensometer sensor is used to measure the longitudinal displacement. The test<br />
parameters (fig.27b) are:<br />
- the maximum applied stress ζmax from which woven 0 o -ply laminates have been performed at<br />
50%ζR, 70%ζR and 90%ζR, while woven angle-ply laminates (0 o /+45 o /0 o /+45 o /0 o /-45 o /0 o and<br />
0 o /+20 o /-20 o /0 o /-20 o /+20 o /0 o ) have been performed at 30%ζR, 50%ζR and 70%ζR where ζR is the<br />
average ultimate tensile stress ;<br />
- the minimum to maximum stress ratio R, also called load ratio, in a cycle, was 0.1;<br />
- the frequency f was 1 Hz.<br />
All the tests were made at room temperature. Besides, during testing, a high resolution camera was<br />
used to observe in situ damage initiation on the edge <strong>of</strong> the specimen side and residual stiffness‟s were<br />
measured every N cycles (in general every 5 000 cycles). Therefore, the sample has to be polished<br />
before testing.<br />
(a)<br />
121
122<br />
4.2 Experimental results<br />
4.2.1 Delamination onset<br />
Fifth International Conference on <strong>Fatigue</strong> <strong>of</strong> Composites<br />
(b)<br />
Fig. 27. <strong>Fatigue</strong> experimental set-up [10]: (a) hydraulic machine; (b) fatigue <strong>loading</strong> procedure.<br />
In order to predict the onset <strong>of</strong> delamination <strong>under</strong> fatigue tension-tension <strong>loading</strong>, a relationship<br />
between the ratio <strong>of</strong> the maximum applied stress ζmax for onset delamination over pure tensile <strong>loading</strong><br />
test ζonset, versus the number <strong>of</strong> cycles for delamination onset in mode I Nonset , has to be found (fig.28).<br />
σ max/σ onset<br />
1.20<br />
1.00<br />
0.80<br />
0.60<br />
0.40<br />
0.20<br />
obersavtions <strong>of</strong> delamination onset<br />
no obersavtion <strong>of</strong> delamination onset<br />
0.00<br />
0 100 000 200 000 300 000 400 000 500 000 600 000 700 000 800 000 900 000 1 000 000 1 100 000 1 200 000<br />
Number <strong>of</strong> cycles for delamination onset in mode I observations<br />
Woven 0°-ply laminate in warp direction<br />
Woven 0°-ply laminate in weft direcion<br />
Woven 0°/+45°/0°/+45°/0°/-45°/0° laminate<br />
Woven 0°/+20°/-20°/0°/-20°/+20°/0° laminate<br />
Fig. 28. Stress number <strong>of</strong> cycles curves for onset delamination (mode I, arrow means an infinite limit).<br />
For carbon/epoxy woven fabric <strong>composite</strong> laminates [4], the non-linear relation between ratio <strong>of</strong> ζmax<br />
to ζonset and Nonset can be expressed as:<br />
( K )<br />
K2<br />
-( Nonset<br />
-1)<br />
max / onset 1<br />
<br />
where K1 and K2 are two constant parameters.<br />
= (38)<br />
These parameters are independent <strong>of</strong> the stacking sequence but only depend on the <strong>composite</strong><br />
material. Due to the difficulty <strong>of</strong> precisely identify the delamination onset on satin 5 carbon/PPS woven<br />
fabric <strong>composite</strong> laminates, more experimental results would be needed for a more accurate fitting.
4.2.2 Damage mechanism<br />
J Bassery, J Renard / Delamination during fatigue testing on carbon fiber fabrics reinforced PPS laminates<br />
4.2.2.1 0 o -ply laminates in weft direction<br />
50%ζR sample only develops ply cracking, also called transverse crack (fig.29 a). Contrary 70%ζR<br />
and 90%ζR levels (fig.29 b and c), which exhibit not only transverse cracks but also, respectively<br />
around 60 000 cycles and 200 000 cycles, intralaminar delamination. This damage is due to the bending<br />
forces created by the fabrics (here seven plies <strong>of</strong> harness satin five fabrics at 0 o ).<br />
Before testing 500 000 cycles 1 000 000 cycles<br />
(a) Observations made on sample tested in fatigue at f=1Hz, r=0.1 and ζmax=50%ζr (only transverse cracks)<br />
Before testing 10 000 cycles 60 000 cycles<br />
(b) Observations made on sample tested in fatigue at f=1Hz, r=0.1 and ζmax=70%ζr (transverse cracks and delamination)<br />
Before testing 100 000 cycles 200 000 cycles<br />
(c) Observations made on sample tested in fatigue at f=1Hz, r=0.1 and ζmax=90%ζr (transverse cracks and delamination)<br />
Fig. 29. In-situ optical observations during fatigue tests for different number <strong>of</strong> cycles (0 o laminates tested in weft direction).<br />
4.2.2.2 0 o laminates in weft direction<br />
In this <strong>loading</strong> direction, 50%ζR and 70%ζR levels show only transverse cracks (Fig.30.a and b), in<br />
123
124<br />
Fifth International Conference on <strong>Fatigue</strong> <strong>of</strong> Composites<br />
contrast to 90%ζR which displays also intralaminar delamination around 5 000 cycles (fig.30 c). Then,<br />
these delaminations growth with the number <strong>of</strong> cycles and propagate in the neighbouring yarns.<br />
Before testing 500 000 cycles 1 000 000 cycles<br />
(a) Observations made on sample tested in fatigue at f=1Hz, r=0.1 and ζmax=50%ζr (only transverse crack)<br />
Before testing 500 000 cycles 1 000 000 cycles<br />
(b) Observations made on sample tested in fatigue at f=1Hz, r=0.1 and ζmax=70%ζr (only transverse crack)<br />
Before testing 5 000 cycles 10 000 cycles<br />
(c) Observations made on sample tested in fatigue at f=1Hz, r=0.1 and ζmax=90%ζr (transverse crack and delamination)<br />
Fig. 30. In-situ optical observations during fatigue tests for different number <strong>of</strong> cycles (0 o laminates tested in the weft direction.<br />
4.2.2.3 0 o /+45 o /0 o /+45 o /0 o /-45 o /0 o / laminates<br />
For this sequence, 50%ζR and 70%ζR levels show transverse crack and delamination in mode I,<br />
between 0 o -ply and 45 o ply, respectively around 300 000cycles and 5 000cycles (fig.31 b and c). For<br />
30%ζR, only transverse crack can be observed (fig.31 a).
J Bassery, J Renard / Delamination during fatigue testing on carbon fiber fabrics reinforced PPS laminates<br />
Before testing 300 000 cycles 600 000 cycles<br />
(a) Observations made on sample tested in fatigue at f=1Hz, r=0.1 and ζmax=30%ζr (only transverse crack)<br />
Before testing 250 000 cycles 300 000 cycles<br />
(b) Observations made on sample tested in fatigue at f=1Hz, r=0.1 and ζmax=50%ζr (transverse crack and delamination)<br />
Before testing 5 000 cycles 10 000 cycles<br />
(c) Observations made on sample tested in fatigue at f=1Hz, r=0.1 and ζmax=70%ζr (transverse crack and delamination)<br />
Fig. 31. In-situ optical observations during fatigue testing for different number <strong>of</strong> cycles (0 o /+45 o /0 o /+45 o /0 o /-45 o /0 o laminates).<br />
4.2.2.4 0 o /+20 o /-20 o /0 o /-20 o /+20 o /0 o laminates<br />
For this sequence, 50%ζR and 70%ζR levels show transverse crack and delamination, between 0 o -ply<br />
and 20 o ply, respectively around 1 000 cycles and 50 cycles (fig.32 b and c). For 30%ζR, only transverse<br />
crack can be observed (fig.34 a) and test is still in progress. The delamination in mode II, between<br />
20 o -ply and -20 o -ply, is arduous to observe. A higher magnification is needed.<br />
125
126<br />
Fifth International Conference on <strong>Fatigue</strong> <strong>of</strong> Composites<br />
Before testing 200 000 cycles 400 000 cycles<br />
(a) Observations made on sample tested in fatigue at f=1Hz, r=0.1 and ζmax=30%ζr (only transverse cracks)<br />
Before testing 10 cycles 1 000 cycles<br />
(b) Observations made on sample tested in fatigue at f=1Hz, r=0.1 and ζmax=50%ζr (transverse crack and delamination)<br />
Before testing 10 cycles 50 cycles<br />
(c) Observations made on sample tested in fatigue at f=1Hz, r=0.1 and ζmax=70%ζr (transverse crack and delamination)<br />
Fig. 32. In-situ optical observations during fatigue tests at different cycles (0 o /+20 o /-20 o /0 o /-20 o /0 o /-20 o /+20 o /0 o / laminates).<br />
In conclusion, the observations show that:<br />
- Damage mechanism evolution is first ply cracking then delamination ;<br />
- for different maximum applied stresses, the fatigue damage mechanisms are the same with a faster<br />
evolution with increasing maximum applied stress;<br />
- Further fatigue damage mechanisms are similar when compare to static tension tests.<br />
The results prove that in fatigue below a threshold there is no delamination in mode I (50%ζr for<br />
0 o -ply laminates and 30%ζr for 0 o /+45 o /0 o /+45 o /0 o /-45 o /0 o and 0 o /+20 o /-20 o /0 o /-20 o /+20 o /0 o laminates).<br />
The 0 o /+20 o /-20 o /0 o /-20 o /+20 o /0 o laminates, in regard to the number <strong>of</strong> cycles needed to observe<br />
delamination, is less resistant.
4.2.3 Stiffness degradation<br />
J Bassery, J Renard / Delamination during fatigue testing on carbon fiber fabrics reinforced PPS laminates<br />
Thanks to the fatigue test setting, the stiffness degradation can be investigated (fig.33). Two stages<br />
have been identified: onset and then stabilization. Form all carbon/PPS laminates, the highest stiffness<br />
reduction is around 5%, so close to the experimental dispersion, and its evolution is stabilized around<br />
100 000 cycles. Even though, transverse cracks and delaminations have been observed. In comparison<br />
with carbon/epoxy, the material <strong>of</strong> the study is less sensitive to fatigue. Therefore, the onset<br />
delamination criterion, in a simplified approach, can be only indentified on static tensile tests.<br />
E/E 0<br />
1.05<br />
1.00<br />
0.95<br />
5. Finite element analysis<br />
Woven 0°-ply laminate in warp<br />
direction<br />
Woven 0°-ply laminate in weft<br />
0.90<br />
0.85<br />
direction<br />
Woven 0°/+45°/0°/+45°/0°/-45°/0°<br />
laminate<br />
Woven 0°/+20°/-20°/0°/-20°/+20°/0°<br />
laminate<br />
0 100 000 200 000 300 000 400 000 500 000 600 000 700 000 800 000 900 000 1 000 000<br />
Number <strong>of</strong> cycles<br />
Fig. 33. Stiffness degradation during fatigue tests.<br />
To identify the parameter k for onset delamination criterion (characterizing the friction between two<br />
layers), a 2D ½ finite element simulation <strong>of</strong> the sample submitted to tension has been made. Due to the<br />
symmetries, only a quarter <strong>of</strong> the cross section has been modelled (fig.34). Experimentally, the<br />
delamination appears at free edges <strong>of</strong> the samples. Numerically, free edge interfaces exhibit stress<br />
singularities which are more and more accurate as the refinement <strong>of</strong> the mesh increase. The applied<br />
stress corresponds to the macroscopic applied test, for which in-situ observations <strong>of</strong> delamination in<br />
mode I have been noticed (equal to 70%ζr) on woven 0 o /+45 o / o /+45 o /0 o /-45 o /0 o laminate during static<br />
tensile tests. Each woven ply is considered as homogenous and orthotropic. Therefore, the elastic<br />
<strong>behaviour</strong> <strong>of</strong> one ply results from the orthotropic matrix identified in the paragraph III.<br />
Fig. 34. 2D ½ finite element model.<br />
127
128<br />
Fifth International Conference on <strong>Fatigue</strong> <strong>of</strong> Composites<br />
By a convergence study on the onset delamination criterion for a critical length a0 equal to one ply<br />
thickness in correspondence to experimental in-situ observations, the finest size <strong>of</strong> the mesh (equal to<br />
one ply thickness divided by 50) and the affected area h <strong>of</strong> the gradient method (h=one ply thickness<br />
divided by 10) have been fixed (see fig.35 a and b).<br />
Onset delamination criterion (-)<br />
1.80<br />
1.60<br />
1.40<br />
1.20<br />
1.00<br />
0.80<br />
0.60<br />
0.40<br />
0.20<br />
one ply thickness<br />
2 elements per ply mesh<br />
5 elements per ply mesh<br />
10 elements per ply mesh<br />
25 elements per ply mesh<br />
50 elements per ply mesh<br />
100 elements per ply mesh<br />
0.00<br />
0.00 0.20 0.40 0.60 0.80 1.00 1.20 1.40 1.60 1.80 2.00<br />
Critical length a0 (mm)<br />
Onset delamination criterion (-)<br />
2.25<br />
2.00<br />
1.75<br />
1.50<br />
1.25<br />
1.00<br />
0.75<br />
0.50<br />
0.25<br />
0.00<br />
one ply thickness<br />
h=1 ply<br />
h=1/5 ply<br />
h=1/10 ply<br />
h=1/50 ply<br />
h=1/100 ply<br />
0.0 0.2 0.4 0.6 0.8 1.0 1.2 1.4 1.6 1.8 2.0<br />
Critical length a0 (mm)<br />
(a) (b)<br />
Fig. 35. (a) Evolution <strong>of</strong> the onset delamination for different mesh sizes; (b) Evolution <strong>of</strong> the onset delamination for different affected area h.<br />
Then, from the average stresses, which are obtained by combination <strong>of</strong> magnitude and gradient<br />
methods (see paragraph II), the k parameter is determined to have the onset delamination criterion equal<br />
to one at a critical length equivalent to one ply thickness (fig.36 a). Numerically, the interface 0 o /+45 o is<br />
the most solicited interface. Thus, the onset delamination criterion is applied on this interface. The<br />
obtained k parameter value is 0.425. Compare to carbon/epoxy laminates, this value is higher.<br />
Onset delamination criterion (-)<br />
1.10<br />
1.00<br />
0.90<br />
0.80<br />
0.70<br />
0.60<br />
0.50<br />
0.40<br />
0.30<br />
0.20<br />
0.10<br />
0.00<br />
0.00 1.00 2.00 3.00 4.00 5.00 6.00 7.00 8.00 9.00 10.00 11.00<br />
Critical length a 0 (mm)<br />
(a) (b)<br />
Fig. 36. (a) Onset delamination criterion evolution (0 o / 45 o plies interface with k=0.425, in red the critical length equal to the ply thickness); (b)<br />
In-situ observation <strong>of</strong> delamination for 0 o /+45 o /0 o /+45 o /0 o /-45 o /0 o laminate during tensile test at 70% ζr.<br />
For 0 o /+45 o /0 o /+45 o /0 o /-45 o /0 o laminate, model prediction are in good agreement with experimental<br />
results (Fig.36 b). The validation <strong>of</strong> the parameter k, by comparison between numerical results and<br />
in-situ observations on 0 o /+20/-20 o /0 o /-20 o /+20 o /0 o laminate, is in progress.<br />
6. Discussion<br />
The Arcan-Mines device gives an estimation <strong>of</strong> stress and strain in the <strong>composite</strong> by deducting the<br />
displacements <strong>of</strong> the metal substrates and adhesives. This approach is based on approximations <strong>of</strong>
J Bassery, J Renard / Delamination during fatigue testing on carbon fiber fabrics reinforced PPS laminates<br />
elastic properties and dimensions <strong>of</strong> the adhesive joint. At the end, the obtained interface strengths give<br />
a good prediction <strong>of</strong> the onset delamination. But in perspective, it will be pertinent to simulate the entire<br />
Arcan-Mines device in order to know precisely the stress distribution at the different interfaces <strong>of</strong> the<br />
<strong>composite</strong> [11].<br />
7. Conclusion<br />
This study presents a procedure to evaluate the orthotropic elastic stiffness matrix <strong>of</strong> laminated<br />
<strong>composite</strong>s in static through tensile, bending and compression tests. During tensile tests at different<br />
strain rate on 45 o oriented samples, a non-linear <strong>behaviour</strong> is observed. Thus, a method to identify the<br />
elastoviscoplastic model parameters is clearly described. This <strong>behaviour</strong> law should be coupled with<br />
damage. Consequently, the experimental set-up Arcan-Mines and monitoring procedure, to determine<br />
the onset delamination criterion interface strengths parameters, are described. Finally, a delamination<br />
initiation criterion and its validation for the considered materials are explained. Hence, a tension-tension<br />
fatigue tests campaign points out damage mechanism similar to the static case and a low stiffness<br />
reduction close to the experimental reduction. In a simplified approach, the onset delamination criterion<br />
in fatigue can be considered equal to the static one. Nevertheless, it will be accurate to investigate the<br />
fatigue impact on interface strengths. Only <strong>composite</strong> made <strong>of</strong> polyphenylenesulfide (pps) matrix<br />
reinforced with carbon fibre fabrics are tested.<br />
Acknowledgments<br />
This work is a part <strong>of</strong> the project TOUPIE which aims at using high-performance thermoplastic<br />
<strong>composite</strong>s for structural applications purposes. This project is supported by the DGE (Dotation Globale<br />
d‟Equipement) through the competitiveness cluster MOV‟EO in which several industrials and research<br />
laboratories are cooperating: Aircelle Company, AMPA Society, AXS Ingénierie Society, Université du<br />
Havre, ENSI Caen, INSA Rouen and Ecole des Mines de Paris.<br />
References<br />
[1] B. Vieille, J. Aucher, L. Taleb. Influence <strong>of</strong> temperature on the behavior <strong>of</strong> carbon fiber fabrics reinforced PPS laminates. Materials<br />
Science and Engineering: A Volume 517, Issues 1-2, 20 August 2009, Pages 51-60.<br />
[2] L.A.L. Franco, M.L.A. Grac, F.S. Silva. Fractography analysis and fatigue <strong>of</strong> thermoplastic <strong>composite</strong> laminates at different environmental<br />
conditions. Materials Science and Engineering A 488 (2008) 505–513.<br />
[3] S. Joannès, J. Renard, V. Gantchenko. The role <strong>of</strong> talc particles in a structural adhesive submitted to fatigue <strong>loading</strong>s. International Journal<br />
<strong>of</strong> <strong>Fatigue</strong> 32 (2010) 66–71.<br />
[4] P. Nimdum. «Dimensionnement en fatigue des structures ferroviaires en <strong>composite</strong>s épais ». ENSMP phd thesis manuscript, Mars 2009.<br />
[5] B. Bonnet. «Comportement au choc de matériaux <strong>composite</strong>s pour applications automobiles ». ENSMP phd thesis manuscript, April 2005.<br />
[6] C. Verdeau, A. R. Bunsell. « Effet des conditions d'élaboration sur le comportement mécanique, statique et dynamique de matériaux<br />
<strong>composite</strong>s hautes performances a matrice thermoplastique semicristalline » Proceedings <strong>of</strong>:developments in the science and technology <strong>of</strong><br />
<strong>composite</strong> materials,3rd european conference on <strong>composite</strong> materials,20-23 march 1989,bordeaux.-p.431-440.<br />
[7] J. Renard. « Elaboration, microstructure et comportement des matériaux <strong>composite</strong>s à matrice polymère » Traité MIM – Mécanique et<br />
Ingénierie des Matériaux, série polymères, Editions Hermes, 2005.<br />
[8] S. Timoshenko. « Theory <strong>of</strong> elasticity »- McGraw-Hill Companies; Third edition, 1970<br />
[9] J.Y Cognard, P. Davies, L.Sohier, R.Créac‟hcadec. A study <strong>of</strong> the non-linear <strong>behaviour</strong> <strong>of</strong> adhesively-bonded <strong>composite</strong> assemblies.<br />
Composite Structures,76, 14 August 2006, 34-46<br />
129
130<br />
Fifth International Conference on <strong>Fatigue</strong> <strong>of</strong> Composites<br />
[10] N. Revest, A. Thionnet, J. Renard, L. Boulay, P. Castaing. A continuum damage model for <strong>composite</strong> materials. Proceedings <strong>of</strong> fatigue<br />
design, november 2009, Senlis.<br />
[11] J.Y Cognard, P. Davies, B.Gineste, L.Sohier. Development <strong>of</strong> an improved adhesive test method for <strong>composite</strong> assembly design.<br />
Composites Science and Technology, 64, 11 November 2004, 359-368
Abstract<br />
A residual stiffness – residual strength coupled model for<br />
<strong>composite</strong> laminate <strong>under</strong> fatigue <strong>loading</strong><br />
W Lian *<br />
Shanghai Aircraft Design and Research Institute, Commercial Aircraft Corporation <strong>of</strong> China, 5# Yunjin Road, Shanghai, China<br />
In this paper, the foregone stiffness degradation models and strength degradation models for <strong>composite</strong> <strong>under</strong><br />
fatigue <strong>loading</strong> were reviewed simply. A new residual stiffness model was presented and a residual strength model<br />
coupled with it was established based on the basis that they are all determined by the damage evolvement and<br />
accumulation, then the residual strength can be accurately predicted by monitoring the residual stiffness. The coupled<br />
model was verified by experimental data, results show that the current models can describe the stiffness degradation rule<br />
and strength degradation rule <strong>of</strong> the <strong>composite</strong> multidirectional laminate fairly well and the coupled parameter was found<br />
to be a material constant.<br />
Nomenclature<br />
E(0) modulus <strong>of</strong> the virgin <strong>composite</strong><br />
E(n) residual modulus at the nth cycle<br />
E(N) critical residual modulus when breaking<br />
fi<br />
frequency<br />
n cyclic number<br />
N fatigue life<br />
N* average fatigue life <strong>of</strong> some specimens<br />
r, ri<br />
Ri<br />
relative stress level to static strength<br />
stress ratio<br />
S(0) ultimate static strength<br />
S(n) residual strength at the nth cycle<br />
S(N) critical residual strength when breaking<br />
max peak stress<br />
DE<br />
DS<br />
damage parameter defined by the residual strength<br />
damage parameter defined by the residual stiffness<br />
u, v parameters in the stiffness degradation model<br />
w coupled model parameter<br />
* Corresponding author.<br />
E-mail address: lian.wei@163.com
132<br />
1. Introduction<br />
Fifth International Conference on <strong>Fatigue</strong> <strong>of</strong> Composites<br />
The <strong>composite</strong> has been widely used in aircraft's structure, especially in the main <strong>loading</strong>-bearing<br />
components recently. As a representative aircraft which applied great amount <strong>of</strong> <strong>composite</strong> material,<br />
B787, had made its maiden flight at the end <strong>of</strong> 2009 and will be delivered to customer at the end <strong>of</strong> this<br />
year. In B787, the <strong>composite</strong> was applied in wingbox, empennage and fuselage structure and the<br />
proportion <strong>of</strong> the <strong>composite</strong> weight to the total structure weight is near 50%, which had caused a<br />
revolution in <strong>composite</strong> material application, and it is much more so for Airbus A350XWB as a pursuer.<br />
Generally, in engineering field, people think that there is no fatigue problem for the <strong>composite</strong>, but<br />
this comment must be <strong>under</strong>stood <strong>under</strong> the following conditions:<br />
(1) Low strain allowable: Considering safety and damage tolerance, the allowable strain for the<br />
advanced <strong>composite</strong> material in engineering is very low comparing to its ultimate fracture strain.<br />
(for example 4000 VS 15000 <strong>under</strong> tension and 3000 VS 10000 <strong>under</strong> compression)<br />
(2) Conception based on damage non-propagation: The damage in <strong>composite</strong> (due to impact or<br />
manufacture defects) structure is not allowed to propagate <strong>under</strong> serving load because the damage<br />
evolution or fatigue behavior in <strong>composite</strong> is not exactly mastered by people.<br />
Based on which, such low allowable strain would not induce fatigue damage in <strong>composite</strong> structure.<br />
From the fatigue-life diagram established by Talreja[1], we can find that the present common strain<br />
allowable value is <strong>under</strong> the fatigue limits for advanced <strong>composite</strong>. Surely, the advanced <strong>composite</strong> has<br />
perfect fatigue performance and the rate <strong>of</strong> the stress level for the fatigue limit to its ultimate strength<br />
reaches 60% generally. Totally, the low allowable strain and high fatigue performance result in the<br />
concept that the static mechanism performance covers up fatigue problem for the <strong>composite</strong>.<br />
However, the engineers have been applying themselves to enhance the allowable strain by any<br />
possible way, such as toughening, enhancing the damage tolerance or damage resistance. Boeing‟<br />
engineers try to improve the <strong>composite</strong>‟s allowable strain from about 4000 presently to<br />
6000~8000 for the next generation civil transporter to reduce the structural weight and fuel<br />
consumption, then the fatigue problem would not be avoided any way at such high target strain.<br />
In reality, <strong>composite</strong> fatigue became a researching hotspot since 1970s due to the advance <strong>composite</strong><br />
material‟s fast developing and increasing application. In the past forty years, researchers made great<br />
efforts on fatigue mechanism and behavior, rules <strong>of</strong> damage evolution and accumulation by various<br />
ways. Many models, damage parameters and life prediction methods were presented. However, there is<br />
still no recognized fatigue life prediction method for <strong>composite</strong> by far because the damage mechanism<br />
and fatigue behavior are really complex for the <strong>composite</strong> with multi-directional fiber and multi-phase<br />
micro structure. The most popular methods <strong>of</strong> characterizing the <strong>composite</strong>‟s fatigue properties and<br />
predicting life are phenomenological, such as those method and parameters based on residual stiffness,<br />
residual strength or fatigue life which don‟t treat <strong>of</strong> micro-mechanism <strong>of</strong> <strong>composite</strong> structure <strong>under</strong><br />
cyclic <strong>loading</strong>, only adopt macro-parameters to characterize its fatigue properties straightforwardly.
W Lian / A residual stiffness – residual strength coupled model for <strong>composite</strong> laminate <strong>under</strong> fatigue <strong>loading</strong><br />
2. Review <strong>of</strong> the residual stiffness and residual strength models<br />
The representational residual stiffness models presented by prevenient researchers are summarized<br />
simply in table 1, as following,<br />
Table 1. Collection <strong>of</strong> the residual stiffness models<br />
Presenter The residual stiffness model<br />
Yang [2] a<br />
E( n) = E(0)[1 - Qn ]<br />
E( n) = E(0)[1 - ( d + a B ) n ]<br />
Yang-2 [3] a3+ BS<br />
2 max<br />
Echtermeyer [4] E( n) = E(0) - log n<br />
Coats [5]<br />
*<br />
E(<br />
n) E <br />
A D<br />
= 1- <br />
<br />
E(0) E(0) A<br />
0 <br />
E n E Da n N <br />
<br />
<br />
Plumtree [6] ( ) / (0) = 1- 1- ( 1 - / )<br />
E n E K E n <br />
<br />
max <br />
Zhang [7] ( ) = (0) 1 - ( / (0) )<br />
Whitworth [8]<br />
1<br />
m m<br />
E( n) = E( N)[ - hln( n + 1) + ( E(0) / E( N))<br />
]<br />
E ( n) = E (0) - DC [ E(0) - / e )] n<br />
Whitworth-2 [9] a a a a<br />
max f<br />
Ye [10]<br />
En ( )<br />
= 1 - [ NC( n + 1)]<br />
E(0)<br />
Hwang [11] c 1<br />
Bangyan [12]<br />
Philippidis [13]<br />
Vure [14]<br />
Shokrieh [15]<br />
d E( n) / dn<br />
Acn -<br />
=-<br />
<br />
1/( n+ 1) 2 n/( n+<br />
1)<br />
max<br />
E( n) = E(0)[1 -( Kn ) (1 - q)]<br />
EN ( ) A c<br />
= 1 - K( ) N<br />
E(1) E<br />
0<br />
b 1/ B<br />
max<br />
En ( )<br />
= [1 - ( c + 1) A n]<br />
E(0)<br />
c 1/( c+<br />
1)<br />
max<br />
<br />
1/ <br />
log( n)<br />
- log(0.25) <br />
Eij ( n) = 1- Eij<br />
- +<br />
log( Nij<br />
) log(0.25) <br />
- f f<br />
<br />
Tserpes [16] Eij ( n) = <br />
A(1/ Nij ) + 1 <br />
Eij<br />
(0)<br />
Mao [17]<br />
m1 m2<br />
E(0) - E( n) n n <br />
= q+ (1 - q)<br />
<br />
E(0) - E( N) N N <br />
Note: The other symbols are model parameters, please refer to the literature for details.<br />
It can be found that the upper residual stiffness models generally satisfy the boundary conditions,<br />
which are,<br />
E(n)=E(0), when n=0<br />
E(n)=Ecr(N), when n=N<br />
133
134<br />
Fifth International Conference on <strong>Fatigue</strong> <strong>of</strong> Composites<br />
Although the stiffness degrades irregularly when failure happens, a critical residual stiffness value could<br />
still be distinguished, which had been verified by experiments[4, 14], or an critical residual stiffness<br />
could be defined artificially based on the considering <strong>of</strong> structure safety or functional requirement.<br />
Totally, the upper residual stiffness models could be divided to two groups, one is to establish the<br />
relationship between the residual stiffness and the cycle number, such as the models presented by<br />
Yang [2] , Zhang [7] , Whitworth [9] , Hwang [11] , Philippidis [13] etc; the other is to establish the relationship<br />
between the residual stiffness and the life ratio, such as those presented by Plumtree [6] , Shokrieh [15] ,<br />
Mao [2] etc. To the author‟s opinion, it is not robust to establish the relationship between the residual<br />
stiffness and the absolute cycle number because the fatigue life <strong>of</strong> the <strong>composite</strong> scatters seriously and<br />
one cycle <strong>loading</strong> induces different stiffness degradation in the different specimens or different fatigue<br />
stage for one specimen. Research and experiment results [16~19] had revealed that the curves <strong>of</strong><br />
normalized residual stiffness (E(n)/E(0)) with life ratio (n/N) keep accordant with each other, which<br />
denotes the fatigue damage evolves according to similar rule for the <strong>composite</strong> with same layup<br />
sequence <strong>under</strong> similar fatigue <strong>loading</strong> spectrum, but their lives scatter seriously.<br />
For the residual strength, accordingly, many models had been established, as following in the table 2.<br />
Table 2. collection <strong>of</strong> the residual strength models<br />
Presenter The residual strength models<br />
Yang [20] c c c b<br />
S ( n) = S (0) - K n<br />
Yang-2 [21]<br />
Yang-3 [22]<br />
Adam [23] max<br />
max <br />
<br />
S (0) -<br />
max<br />
( ) = (0) - c c<br />
S (0) -<br />
max<br />
S n S K n<br />
c b<br />
max<br />
S (0) -<br />
S n S K n<br />
<br />
<br />
( ) =<br />
max c<br />
(0) -<br />
( c c <br />
( S (0) -<br />
max )<br />
b<br />
max<br />
<br />
)<br />
x y<br />
Sn ( ) - log( n)<br />
- log(0.5) <br />
+ = 1<br />
S(0) - log( N)<br />
-log(0.5)<br />
<br />
( ) (0) [ (0) ] n<br />
S n = S - S - <br />
N<br />
Broutman [24] max<br />
n <br />
= - - <br />
logN Hashin [25] log<br />
[ S( n)] [ S(0)] [ S(0)]<br />
( )<br />
n<br />
( ) (0) ( )<br />
Charewicz [26] = + - <br />
S n max S max f<br />
N<br />
Schaff 27,28] S( n) S(0) S(0) <br />
= - - max <br />
Sendeckyj [29] ( ) 1<br />
s<br />
v<br />
n <br />
N <br />
<br />
S(0) = max S( n) / max+<br />
( n -1)<br />
f <br />
<br />
Xiong [30] m<br />
n = C s - S S - S n <br />
3<br />
( (0)) (0) ( ) b<br />
Hahn [31] c c<br />
S ( n) = S (0) - cDn<br />
S ( n) = S (0) - A ( N - 1)<br />
Haplin [32] r r r<br />
A<br />
Whitworth [8] r r r r n<br />
S ( n) = S (0) - ( S (0) -<br />
max )<br />
N<br />
s
W Lian / A residual stiffness – residual strength coupled model for <strong>composite</strong> laminate <strong>under</strong> fatigue <strong>loading</strong><br />
Philippidis [33] S( n) = S(0) - ( S(0) - ) ( CNT/ p)<br />
Chou [34] 1 i<br />
i 1<br />
S ( n) S (0) S (0) max n <br />
<br />
-<br />
= - -<br />
<br />
Yao [35]<br />
max<br />
<br />
Tension: S( n) S(0) S(0) <br />
Caprino [36] max<br />
Revuelta [37]<br />
Reifsnider [38]<br />
Tserpes [16]<br />
= - - max <br />
m<br />
sin x cos( -<br />
) <br />
sin cos( x -<br />
) <br />
Compression: S( n) = S(0) -S (0) - ( n / N )<br />
S( n) S(0) a (1 R)( n 1)<br />
<br />
= - - -<br />
1 1 1<br />
A A A A<br />
S ( n) = S (0) - B ( n - 1)<br />
max<br />
i-1<br />
max ( )<br />
( ) = 1- 1 - * * d<br />
0<br />
n n n <br />
S n i<br />
S(0) <br />
N( n) <br />
N( n)<br />
<br />
<br />
2<br />
<br />
n n <br />
Sij ( n) = B+ C + 1 Sij<br />
(0)<br />
N <br />
ij N <br />
ij <br />
<br />
<br />
1/ <br />
log( n)<br />
- log(0.25) <br />
= - - + <br />
log( Nij<br />
) - log(0.25) <br />
<br />
<br />
Shokrieh [39] S ( n) 1 ( S (0) )<br />
ij ij ij ij<br />
Note: The other symbols are model parameters, please refer to the literature for details.<br />
Similarly, the strength degradation models is the function <strong>of</strong> the cycle number, n or life ratio, n/N.<br />
And they satisfy the boundary conditions which are,<br />
S(n)=S(0), when n=0<br />
S( n)= Scr ( N)= max , when n =N<br />
Accordingly, the authors thought that it is not reasonable enough to establish the relationship between<br />
residual strength with absolute cycle number due to the scatter <strong>of</strong> the life and residual strength itself.<br />
Although the residual strength models in table 2 are more than those <strong>of</strong> residual stiffness, study on the<br />
strength degradation rule based on experiments is evidently less than that on the residual stiffness,<br />
because the strength degradation rule is not so inerratic as that <strong>of</strong> residual stiffness, it scatters more<br />
seriously. In addition, the experimental research on strength degradation is time and money consuming<br />
because only one residual strength value can be obtained for one specimen. However, the residual<br />
strength was an important mechanical parameter for the <strong>composite</strong> structure, because it has strong<br />
relationship with safety and reliability. What‟s more, failure must occur when the residual strength<br />
reaches to the peak stress <strong>of</strong> fatigue <strong>loading</strong>, so the residual strength has its natural criteria as a failure<br />
index.<br />
3. The residual stiffness-residual strength coupled model<br />
The foregone stiffness or strength degradation models were presented separately, however, the<br />
potential relationship between them has rarely been studied. To the best knowledge <strong>of</strong> the authors, only<br />
Whitworth[9] had established the relationship between a stiffness degradation model presented by<br />
himself(Eq. 1) with a modified Yang‟s strength degradation model (Eq. 2)by replacing their common<br />
v<br />
135
136<br />
Fifth International Conference on <strong>Fatigue</strong> <strong>of</strong> Composites<br />
parameters, life radio - n/N, as showing in formula (3),<br />
a a<br />
E( n) E( N) n <br />
= 1-H1- <br />
E(0) E(0) N S n = S - S - (2)<br />
N<br />
r r r r n<br />
( ) (0) ( (0) max )<br />
a<br />
En ( ) <br />
1-<br />
<br />
r r<br />
Sn ( ) max E(0)<br />
= 1-1- <br />
a<br />
<br />
S(0) S(0) <br />
<br />
En ( ) <br />
H 1-<br />
<br />
<br />
<br />
E(0)<br />
<br />
where a、H and r are model parameters. But, there were no more efforts on such relationship research.<br />
In current research, the research on the potential relationship between the residual stiffness and<br />
residual strength was carried out presented on the basis <strong>of</strong> the following assumptions:<br />
(1) The damage evolves in the <strong>composite</strong> material <strong>under</strong> fatigue <strong>loading</strong>, which will induce the<br />
degradation <strong>of</strong> its stiffness and strength.<br />
(2) The damage accumulates irreversibly in the laminate during the <strong>loading</strong> acting continually, so the<br />
stiffness and strength degraded monotonously.<br />
(3) At the same time, the instantaneous residual stiffness and residual strength were determined by the<br />
same damage conditions in the laminate, there is inherent relationship between them.<br />
Firstly, due to the continuously nondestructive trackability <strong>of</strong> the residual stiffness, many researchers<br />
recommended it as a preferred damage parameter. In this paper, the following stiffness degradation<br />
model was presented and found to be versatile to describe the stiffness degradation rule in the whole<br />
range fatigue life for variable multidirectional laminates,<br />
u<br />
E( n) E( N) 1 - ( n / N)<br />
<br />
= 1- 1-1-v E(0) E(0) (1 - n/ N)<br />
<br />
where, u and v are experimental parameters which can be obtained by the stiffness degradation curve<br />
fitting, and they are determined by the laminate‟s stacking sequence and the load spectrum.<br />
As describing as part 2, the authors think that it is more reasonable to establish the relationship<br />
between the normalized residual stiffness (E(n)/E(0)) with the life ratio (n/N), experimental results [16-19]<br />
show that the normalized stiffness degradation curves accord with each other for the specimens with<br />
same layup sequence <strong>under</strong> the same <strong>loading</strong> in the dual-normalizing coordinate system, which would<br />
be confirmed again in Fig. 1~12 in part 4. Normalization eliminates the individual specimens‟ difference<br />
and life‟s scatter, then the disciplinarian emerges.<br />
Equation (4) is equivalent to the following formula, which is a kind <strong>of</strong> damage definition in reality,<br />
E(0) -E( n) 1 -(<br />
n / N)<br />
= 1-<br />
E(0) - E( N) (1 - n/ N)<br />
where, DE [0,1] . When n=0, DE=0, when n N , DE 1 .<br />
u<br />
v<br />
E<br />
(1)<br />
(3)<br />
(4)<br />
D<br />
(5)<br />
In the same format, another damage parameter based on the residual strength, DS, can be defined as<br />
equation (6)
W Lian / A residual stiffness – residual strength coupled model for <strong>composite</strong> laminate <strong>under</strong> fatigue <strong>loading</strong><br />
S(0) - S( n)<br />
DS<br />
(6)<br />
S(0) - S( N)<br />
where, DS [0,1] . Theoretically, failure would not occur before the residual strength reaches to the peek<br />
stress <strong>of</strong> the <strong>loading</strong> spectrum, then S(N) should equal max .<br />
Then, considering the interval <strong>of</strong> DE & DS, the relationship between them was supposed to be the<br />
following equation simply,<br />
Then, we get equation (8).<br />
( ) w<br />
D = D<br />
(7)<br />
S E<br />
u<br />
S( n) max 1 - ( n / N)<br />
<br />
= 1- 1-1-v S(0) S(0) (1 - n/ N)<br />
<br />
So, the relationship between the residual stiffness and residual strength can be established as Eq. (9)<br />
S( n) E(0) - E( n)<br />
<br />
= 1-1- S(0) S(0) E(0) E( N)<br />
w<br />
w<br />
max<br />
<br />
-<br />
<br />
(9)<br />
where the parameter w can be easily obtained by residual strength experiment.<br />
4. verifying <strong>of</strong> the residual stiffness-residual strength coupled model<br />
Parameters u and v in Eq. (4) are very easy to obtain based on the recorded experimental data <strong>of</strong> once<br />
piece <strong>of</strong> specimen in a whole fatigue processing. In Eq. (8), u and v keep same value with those in Eq.<br />
(4) <strong>under</strong> the condition <strong>of</strong> same laminate and same <strong>loading</strong> spectrum, the single unknown parameter, w,<br />
can be obtained by even one residual strength experiment combined with the static strength.<br />
Lee&Jen[40] had researched the fatigue response <strong>of</strong> the thermoplastic matrix PEEK reinforced by<br />
carbon fiber AS4 <strong>composite</strong> laminates with three stacking sequence ([+45]4S, [0/90] 4S, [0/45/90/-45]4S)<br />
<strong>under</strong> dual stress level (ri), stress ratio (R1=0, R2=0.2) and frequency (f1=25Hz, f2=5Hz) experimentally,<br />
and enumerated the stiffness and residual strength degradation data in the figures. Those data was<br />
picked up by the authors and adopted to validate the adaptability <strong>of</strong> current residual stiffness - residual<br />
strength coupled model.<br />
From the experimental data, the critical residual stiffness ratio for three laminates was shown in table<br />
3. The critical residual strength ratio took the relative peak stress level to the static strength,<br />
r= / S(0)<br />
, which was shown in table 3 too.<br />
i<br />
max<br />
Table 3. The critical residual stiffness and residual strength for AS4/PEEK<br />
Laminate Loading case Critical residual stiffness ratio Critical residual strength ratio<br />
[+45]4S<br />
[0/90] 4S<br />
[0/45/90/-45] 4S<br />
r1=0.40<br />
0.40<br />
0.55<br />
r2=0.34 0.34<br />
r1=0.66<br />
0.66<br />
0.82<br />
r2=0.60 0.60<br />
r1=0.70<br />
0.70<br />
0.70<br />
r2=0.64 0.64<br />
Due to the sufficiency <strong>of</strong> the experimental data, u, v, w were determined by method <strong>of</strong> data fitting,<br />
their values were listed in table 4, the curves <strong>of</strong> the stiffness and strength degradation rule were shown<br />
137<br />
(8)
138<br />
Fifth International Conference on <strong>Fatigue</strong> <strong>of</strong> Composites<br />
Fig. 1~12, in which the invert experimental data was shown too.<br />
From table 4, three rules can bee found,<br />
(1) The value <strong>of</strong> u and v increases with the increasing fraction <strong>of</strong> ply 0 o for these laminates.<br />
(2) For same laminate, the value <strong>of</strong> u and v increases with the increasing <strong>of</strong> the stress level, ri.<br />
(3) Despite <strong>of</strong> the diverse value <strong>of</strong> u and v, the coupled parameter, w, does not almost change with<br />
laminate‟s layup sequence or <strong>loading</strong> case, and it is generally greater than 2.0.<br />
Table 4. The value <strong>of</strong> u, v and w for the laminates<br />
Laminate Loading case u v w<br />
[+45]4S<br />
[0/90] 4S<br />
[0/45/90/-45] 4S<br />
r1=0.40 0.50 0.51 2.04<br />
r2=0.34 0.56 0.61 2.01<br />
r1=0.66 0.83 0.72 2.23<br />
r2=0.60 0.96 0.68 2.14<br />
r1=0.70 0.75 0.51 2.09<br />
r2=0.64 0.82 0.62 2.17<br />
With the increasing faction <strong>of</strong> ply 0 o , the stiffness degradation rule tends to “sudden death”, <strong>under</strong><br />
which the u and v will increasing due to the model‟s mathematical character. Similarly, with the<br />
increasing <strong>of</strong> the stress level, laminate‟s life will decrease and the damage may not evolve adequately<br />
and then the stiffness degradation rule tends to “sudden death” also. Based on the assumptions in part 3,<br />
the strength degradation rule has a inner relationship with stiffness degradation rule, the different<br />
damage evolvement processes for different laminates are imported to their corresponding residual<br />
strength model (Eq. (8) ) by the residual stiffness model, and the coupled parameter, w, might be a<br />
material constant.<br />
From fig. 1~12, it can be found that the residual stiffness model describes the stiffness degradation<br />
rule perfectly. And, the residual strength model describes the strength degradation rule fairly well.<br />
Residual stiffness ratio<br />
1.0<br />
0.8<br />
0.6<br />
0.4<br />
0.2<br />
0.0<br />
r1= 0.4,R1= 0,f1=25<br />
r1= 0.4,R1= 0,f2= 5<br />
r1= 0.4,R2=0.2,f1=25<br />
r1= 0.4,R2=0.2,f2= 5<br />
Current model<br />
[ 45]<br />
4S<br />
0.0 0.2 0.4 0.6 0.8 1.0<br />
Life ratio (n/N )<br />
Fig. 1. Stiffness degradation <strong>of</strong> laminate [+45]4S <strong>under</strong> stress level r1.
W Lian / A residual stiffness – residual strength coupled model for <strong>composite</strong> laminate <strong>under</strong> fatigue <strong>loading</strong><br />
Residual strength ratio<br />
Residual strength ratio<br />
Residual stiffness ratio<br />
1.0<br />
0.8<br />
0.6<br />
0.4<br />
0.2<br />
0.0<br />
r2=0.34,R1= 0,f1=25<br />
r2=0.34,R1= 0,f2= 5<br />
r2=0.34,R2=0.2,f1=25<br />
r2=0.34,R2=0.2,f2= 5<br />
Current model<br />
[ 45]<br />
4S<br />
0.0 0.2 0.4 0.6 0.8 1.0<br />
Life ratio (n/N )<br />
Fig. 2. Stiffness degradation <strong>of</strong> laminate [+45]4S <strong>under</strong> stress level r2.<br />
1.0<br />
0.8<br />
0.6<br />
0.4<br />
0.2<br />
0.0<br />
r1= 0.4,R1= 0,f1=25<br />
r1= 0.4,R1= 0,f2= 5<br />
r1= 0.4,R2=0.2,f1=25<br />
r1= 0.4,R2=0.2,f2= 5<br />
Current model<br />
[ 45]<br />
4S<br />
0.0 0.2 0.4 0.6 0.8 1.0<br />
Life ratio (n/N )<br />
Fig. 3. Strength degradation <strong>of</strong> laminate [+45]4S <strong>under</strong> stress level r1.<br />
1.0<br />
0.8<br />
0.6<br />
0.4<br />
0.2<br />
0.0<br />
r2=0.34,R1= 0,f1=25<br />
r2=0.34,R1= 0,f2= 5<br />
r2=0.34,R1=0.2,f1=25<br />
r2=0.34,R1=0.2,f2= 5<br />
Current model<br />
[ 45]<br />
4S<br />
0.0 0.2 0.4 0.6 0.8 1.0<br />
Life ratio (n/N )<br />
Fig. 4. Strength degradation <strong>of</strong> laminate [+45]4S <strong>under</strong> stress level r2.<br />
139
140<br />
Residual stiffness ratio<br />
Residual stiffness ratio<br />
Residual strength ratio<br />
1.0<br />
0.8<br />
0.6<br />
0.4<br />
Fifth International Conference on <strong>Fatigue</strong> <strong>of</strong> Composites<br />
r1=0.66,R1= 0,f1=25<br />
r1=0.66,R1= 0,f2= 5<br />
r1=0.66,R2=0.2,f1=25<br />
r1=0.66,R2=0.2,f2= 5<br />
Current model<br />
[0/90] 4S<br />
0.0 0.2 0.4 0.6 0.8 1.0<br />
Life ratio (n/N )<br />
Fig. 5. Stiffness degradation <strong>of</strong> laminate [0/90]4S <strong>under</strong> stress level r1.<br />
1.0<br />
0.8<br />
0.6<br />
0.4<br />
r2= 0.6,R1= 0,f1=25<br />
r2= 0.6,R1= 0,f2= 5<br />
r2= 0.6,R2=0.2,f1=25<br />
r2= 0.6,R2=0.2,f2= 5<br />
Current model<br />
[0/90] 4S<br />
0.0 0.2 0.4 0.6 0.8 1.0<br />
Life ratio(n/N )<br />
Fig. 6. Stiffness degradation <strong>of</strong> laminate [0/90]4S <strong>under</strong> stress level r2<br />
1.0<br />
0.8<br />
0.6<br />
0.4<br />
r1=0.66,R1= 0,f1=25<br />
r1=0.66,R1= 0,f2= 5<br />
r1=0.66,R2=0.2,f1=25<br />
r1=0.66,R2=0.2,f2= 5<br />
Current model<br />
[0/90] 4S<br />
0.0 0.2 0.4 0.6 0.8 1.0<br />
Life ratio (n/N )<br />
Fig. 7. Strength degradation <strong>of</strong> laminate [0/90]4S <strong>under</strong> stress level r1.
W Lian / A residual stiffness – residual strength coupled model for <strong>composite</strong> laminate <strong>under</strong> fatigue <strong>loading</strong><br />
Residual strength ratio<br />
Residual stiffness ratio<br />
Residual stiffness ratio<br />
1.0<br />
0.8<br />
0.6<br />
0.4<br />
r2= 0.6,R1= 0,f1=25<br />
r2= 0.6,R1= 0,f2= 5<br />
r2= 0.6,R2=0.2,f1=25<br />
r2= 0.6,R2=0.2,f2= 5<br />
Current model<br />
[0/90] 4S<br />
0.0 0.2 0.4 0.6 0.8 1.0<br />
Life ratio (n/N )<br />
Fig. 8. Strength degradation <strong>of</strong> laminate [0/90]4S <strong>under</strong> stress level r2.<br />
1.0<br />
0.8<br />
0.6<br />
0.4<br />
0.2<br />
r1= 0.7,R1= 0,f1=25<br />
r1= 0.7,R1= 0,f2= 5<br />
r1= 0.7,R2=0.2,f1=25<br />
r1= 0.7,R2=0.2,f2= 5<br />
Current model<br />
[0/ 45/90/-45] 2S<br />
0.0 0.2 0.4 0.6 0.8 1.0<br />
Life ratio (n/N )<br />
Fig. 9. Stiffness degradation <strong>of</strong> laminate [0/45/90/-45]2S <strong>under</strong> stress level r1.<br />
1.0<br />
0.8<br />
0.6<br />
0.4<br />
r2=0.64,R1= 0,f1=25<br />
r2=0.64,R1= 0,f2= 5<br />
r2=0.64,R2=0.2,f1=25<br />
r2=0.64,R2=0.2,f2= 5<br />
Current model<br />
[0/ 45/90/-45] 2S<br />
0.0 0.2 0.4 0.6 0.8 1.0<br />
Life ratio (n/N )<br />
Fig. 10. Stiffness degradation <strong>of</strong> laminate [0/45/90/-45]2S <strong>under</strong> stress level r2.<br />
141
142<br />
Residual strength ratio<br />
1.0<br />
0.8<br />
0.6<br />
0.4<br />
0.2<br />
Fifth International Conference on <strong>Fatigue</strong> <strong>of</strong> Composites<br />
r1= 0.7,R1= 0,f1=25<br />
r1= 0.7,R1= 0,f2= 5<br />
r1= 0.7,R1=0.2,f1=25<br />
r1= 0.7,R1=0.2,f2= 5<br />
Current model<br />
[0/ 45/90/-45] 2S<br />
0.0 0.2 0.4 0.6 0.8 1.0<br />
Life ratio (n/N )<br />
Fig. 11. Strength degradation <strong>of</strong> laminate [0/45/90/-45]2S <strong>under</strong> stress level r1.<br />
1.0<br />
0.8<br />
0.6<br />
0.4<br />
5. Evaluation <strong>of</strong> the coupled model<br />
Residual strength ratio<br />
r2=0.64,R1= 0,f1=25<br />
r2=0.64,R1= 0,f2= 5<br />
r2=0.64,R2=0.2,f1=25<br />
r2=0.64,R2=0.2,f2= 5<br />
Current model<br />
[0/ 45/90/-45] 2S<br />
0.0 0.2 0.4 0.6 0.8 1.0<br />
Life ratio (n/N )<br />
Fig. 12. Strength degradation <strong>of</strong> laminate [0/45/90/-45]2S <strong>under</strong> stress level r2.<br />
The main meaning <strong>of</strong> the coupled model is to establish the relationship between the residual strength<br />
and the residual stiffness because the residual strength, which is a key quantity for structure safety, can<br />
be more accurately predicted by monitoring the stiffness degradation for the <strong>composite</strong> structure in<br />
fatigue process. Although the residual stiffness is easy to measured continuously and nondestructively, it<br />
was still considered to be convenient to establish the relationship between residual strength with cycle<br />
number or life ratio when the safety is paid more attention according to traditional conception. However,<br />
in reality, it is insecure to establish such kind <strong>of</strong> relationship. Although, the cycle number or service time<br />
can be counted accurately, the actual life <strong>of</strong> a <strong>composite</strong> structure <strong>under</strong> fatigue <strong>loading</strong> can not be<br />
assured or predicted accurately before failure due to the greater scatter <strong>of</strong> the fatigue life, static strength<br />
and individual difference, which is the right reason why the residual strength obtained by traditional<br />
method scatters seriously.<br />
In anther words, one <strong>loading</strong> cycle induces different damage in different individual specimen or in the<br />
different life phase for the same specimen. On the other hand, as describing in part 3, the normalized
W Lian / A residual stiffness – residual strength coupled model for <strong>composite</strong> laminate <strong>under</strong> fatigue <strong>loading</strong><br />
stiffness degradation curves accord with each other for the specimens with same layup sequence <strong>under</strong><br />
the same <strong>loading</strong> in the dual-normalizing coordinate system, however, there is an important<br />
precondition which is the cycle number must be normalized by the real ultimate life <strong>of</strong> the specimen for<br />
the abscissa. Then, when we carry out residual strength experiment, we have no ideal <strong>of</strong> the actual life<br />
and the life ratio where the residual strength experiment should be carried out is ambiguous.<br />
In addition, the authors had carried out residual strength experiment on E-glass/Epoxy laminate<br />
specimen with a central hole, the material properties and the specimen‟s dimension can be found in<br />
literature[41] and the ratio <strong>of</strong> the hole diameter to the width <strong>of</strong> the specimen is 0.2. Although the<br />
residual strength does not reduce monotonously (increase then reduce) for the notched specimen at the<br />
beginning <strong>of</strong> the life range generally, however, the experimental results shows reasonable relationship<br />
between the residual strength the stiffness degradation ratio ( 1-E(n)/E(0)) instead <strong>of</strong> the anomalous<br />
relationship between the residual strength with the nominal life ratio, as shown in Fig 13~16, which<br />
approves the rationality <strong>of</strong> the discussion above. The experimental results confirm that the relationship<br />
between residual strength and life ratio is incredible, the data points show great scatter due to the<br />
complex fatigue mechanism and abnormal strength degradation rule <strong>of</strong> notched <strong>composite</strong> laminate.<br />
Residual strength (KN)<br />
Residual strength (KN)<br />
20.0<br />
15.0<br />
10.0<br />
5.0<br />
6.0<br />
4.0<br />
2.0<br />
0.0<br />
stress peak<br />
(a) [0/90]2S with hole, r =0. 8<br />
0.0 0.2 0.4 0.6 0.8 1.0<br />
Life ratio (n/N* )<br />
Stress peak<br />
Residual strength (KN)<br />
20.0<br />
15.0<br />
10.0<br />
5.0<br />
stress peak<br />
Fig. 13. Strength degradation <strong>of</strong> laminate [0/90]2S with central hole.<br />
c<br />
(a) [+45]2S with hole, r =0.6<br />
0.0 0.2 0.4 0.6 0.8 1.0<br />
Life ratio (n/N* )<br />
Residual strength (KN)<br />
6.0<br />
4.0<br />
2.0<br />
0.0<br />
(b) [0/90]2S with hole, r =0.8<br />
0.0 0.1 0.2 0.3 0.4 0.5<br />
1-E (n )/E (0)<br />
Stress peak<br />
Fig. 14. Strength degradation <strong>of</strong> laminate [+45]2S with central hole.<br />
(b) [+45]2S with hole, r =0.6<br />
0.0 0.2 0.4 0.6 0.8<br />
1-E (n )/E (0)<br />
143
144<br />
Residual strength (KN)<br />
Residual strength (KN)<br />
25.0<br />
20.0<br />
15.0<br />
10.0<br />
5.0<br />
0.0<br />
15.0<br />
10.0<br />
5.0<br />
0.0<br />
Stress peak<br />
0.0 0.2 0.4 0.6 0.8 1.0<br />
Life ratio (n/N* )<br />
Stress peak<br />
Fifth International Conference on <strong>Fatigue</strong> <strong>of</strong> Composites<br />
(a) [45/0/0/-45]S with hole, r =0.7<br />
Residual strength (KN)<br />
25.0<br />
20.0<br />
15.0<br />
10.0<br />
5.0<br />
0.0<br />
Stress peak<br />
Fig. 15. Strength degradation <strong>of</strong> laminate [45/0/0/-45]S with central hole.<br />
(a) [45/90/-45/0]S with hole,<br />
0.0 0.2 0.4 0.6 0.8 1.0<br />
Life ratio (n/N* )<br />
Residual strength (KN)<br />
15.0<br />
10.0<br />
5.0<br />
0.0<br />
(b) [45/0/0/-45]S with hole, r =0.7<br />
0.0 0.1 0.2 0.3 0.4 0.5<br />
1-E (n )/E (0)<br />
Stress peak<br />
Fig. 16. Strength degradation <strong>of</strong> laminate [45/90/-45/0]S with central hole.<br />
(b) [45/90/-45/0]S with hole, r =0.6<br />
0.0 0.2 0.4 0.6 0.8<br />
1-E (n )/E (0)<br />
In all the figures above, figures (a) show the relationship between residual strength and nominal life<br />
ratio, the nominal life ratio is cycle number n divided by the average life (N*)<strong>of</strong> several (3~5) other<br />
specimens which are tested to failure and corresponding to the data point located on the stress peak<br />
( max ) line. Essentially, according to traditional method, we want to obtain the residual strength <strong>of</strong> the<br />
specimen <strong>under</strong> fatigue <strong>loading</strong> at the life ratio which is cycle number n normalized by the real life itself,<br />
however we hardly get it. However, if we test the residual strength at some stiffness degradation ratio,<br />
as shown in figures (b), the relationship between them becomes disciplinarian.<br />
6 Conclusion<br />
Based on the basis that the instantaneous residual strength and residual stiffness are determined by the<br />
damage condition in the material at the same time, a new residual stiffness model for laminate <strong>under</strong><br />
fatigue <strong>loading</strong> was presented and a coupled model was set up to establish the relationship between the<br />
residual stiffness and residual strength. The experimental data <strong>of</strong> three kinds <strong>of</strong> AS4/PEEK laminates<br />
was adopted to verify the models, results show that the residual stiffness model was versatile to describe<br />
the stiffness degradation rule <strong>of</strong> the multidirectional laminates, the residual strength can be predicted<br />
precisely relatively by simple residual strength test according to the coupled model, the coupled model<br />
has two same parameters with the residual stiffness model and one more coupled model, so they are
W Lian / A residual stiffness – residual strength coupled model for <strong>composite</strong> laminate <strong>under</strong> fatigue <strong>loading</strong><br />
easy for the engineering application.<br />
The coupled parameter, w, was considered to be a material parameter based on the validation results<br />
<strong>of</strong> three laminates with different stacking sequence (with different stiffness and strength degradation<br />
rule). For the material <strong>of</strong> AS4/PEEK, w is about 2.0 for the constant <strong>loading</strong>, and it needs additional<br />
experiment for the spectrum <strong>loading</strong>. There is no hypothesis about material and structure in the coupled<br />
model, so it can be extended to apply for other material and laminates theoretically.<br />
Due to the continue nondestructive trackability <strong>of</strong> the residual stiffness, it is more appropriate to use<br />
residual stiffness as the damage parameter, and the authors suggest that the residual strength can be<br />
tested <strong>under</strong> condition <strong>of</strong> some stiffness degradation ratio instead <strong>of</strong> life ratio.<br />
References<br />
[1] Talreja R.<strong>Fatigue</strong> <strong>of</strong> <strong>composite</strong> material.Lancaster,Technomic Publishing Company, 1987.<br />
[2] Yang J N, Jones D L, Yang S H, et al. A stiffness degradation model for graphite/epoxy laminates. Journal <strong>of</strong> Composite Materials, 1990,<br />
24: 753~769.<br />
[3] Lee L J, Fu K E, Yang J N. Prediction <strong>of</strong> fatigue damage and life for <strong>composite</strong> laminates <strong>under</strong> service <strong>loading</strong> spectra. Composites<br />
Science and Technology, 1996, 56: 635-648.<br />
[4] Echtermeyer A T, Engh B, Buene L. Lifetime and Young‟s modulus changes <strong>of</strong> glass/phenolic and glass/polyester <strong>composite</strong>s <strong>under</strong><br />
fatigue. Composites, 1995, 26(1): 10-16.<br />
[5] Coats T W, Harris C E. Experimental verification <strong>of</strong> a progressive damage model for IM7/5260 laminates subjected to tension-tension<br />
fatigue. Journal <strong>of</strong> Composite Materials, 1995, 29(3): 280-305.<br />
[6] Plumtree A, Shen G.. Prediction <strong>of</strong> fatigue damage development in unidirectional long fibre <strong>composite</strong>s. Polymers and Polymer<br />
Composites, 1994, 2(2): 83-90.<br />
[7] Zhang D Q,Sandor B I. Damage evaluation in <strong>composite</strong> materials using thermographic stress analysis. Advances in <strong>Fatigue</strong> Lifetime<br />
Predictive Techniques, Philadelphia, ASTM, 1992: 341-353.<br />
[8] Whitworth H A. Evaluation <strong>of</strong> the residual strength degradation in <strong>composite</strong> laminates <strong>under</strong> fatigue <strong>loading</strong>. Composite Structures, 2000,<br />
48: 261-264.<br />
[9] Whitworth H A. Modeling stiffness reduction <strong>of</strong> graphite/epoxy <strong>composite</strong> laminates. Journal <strong>of</strong> Composite Materials, 1987, 21: 362-372.<br />
[10] Ye L. On fatigue damage accumulation and material degradation in <strong>composite</strong> materials. Composites Science and Technology, 1989, 36:<br />
339-350.<br />
[11] Hwang W, Han K S. <strong>Fatigue</strong> <strong>of</strong> <strong>composite</strong>, fatigue modulus concept and life prediction. Journal <strong>of</strong> Composite Materials, 1986, 20:<br />
155-165.<br />
[12] Bangyan L, Lessard L B. <strong>Fatigue</strong> and damage-tolerance analysis <strong>of</strong> <strong>composite</strong> laminates: Stiffness loss, damage-modeling and life<br />
prediction. Composites Science and Technology, 1994, 51: 43-51.<br />
[13] Philippidis T P, Vassilopoulos A P. <strong>Fatigue</strong> design allowables for GRP laminates based on stiffness degradation measurements.<br />
Composites science and technology, 2000, 60: 2819-2828.<br />
[14] Vure N R S, Kriz R D. Effect <strong>of</strong> cooling rate and stacking sequence on the fatigue behavior <strong>of</strong> notched quasi-isotropic AS4/PEEK<br />
Laminates. Journal <strong>of</strong> <strong>composite</strong>s technology & Research, 1996, 18(2): 127-134.<br />
[15] Shokrieh M M, Lessard L B. Progressive fatigue damage modeling <strong>of</strong> <strong>composite</strong> materials: Part 1. Modeling. Journal <strong>of</strong> Composite<br />
Materials, 2000, 34(13): 1056-1080.<br />
[16] Tserpes K I, Papanikos P, Labeas G, et al. <strong>Fatigue</strong> damage accumulation and residual strength assessment <strong>of</strong> CFRP Laminates. Composite<br />
Structures, 2004, 63(2): 219-230.<br />
[17] Mao H, Mahadevan S. <strong>Fatigue</strong> damage modeling <strong>of</strong> <strong>composite</strong> materials. Composite Structures, 2002, 58: 405-410.<br />
[18] Rotem A. The fatigue <strong>behaviour</strong> <strong>of</strong> orthotropic laminates <strong>under</strong> tension-compression <strong>loading</strong> International Journal <strong>of</strong> <strong>Fatigue</strong>, 1991, 13(3):<br />
209-215.<br />
[19] Jessen S M, Plumtree A. <strong>Fatigue</strong> damage accumulation in pultruded glass/polyester rods. Composites, 1989, 20(6): 559-567.<br />
[20] Yang J N. <strong>Fatigue</strong> and residual strength degradation for graphite/epoxy <strong>composite</strong>s <strong>under</strong> tension-compression cyclic <strong>loading</strong>. Journal <strong>of</strong><br />
Composite Materials. 1978, 12: 19-38.<br />
[21] Yang J N, Jones D L. Load sequence effects on the fatigue <strong>of</strong> unnotched <strong>composite</strong> laminates. ASTM STP, 723, Philadelphia, American<br />
Society for Testing and Materials 1981: 213–232.<br />
145
146<br />
Fifth International Conference on <strong>Fatigue</strong> <strong>of</strong> Composites<br />
[22] Yang JN, Du S. An exploratory study into the fatigue <strong>of</strong> <strong>composite</strong>s <strong>under</strong> spectrum <strong>loading</strong>. Journal <strong>of</strong> Composite Materials, 1983, 17:<br />
511–526.<br />
[23] Adam T, Dickson R F, Jones C J, et al. A power law fatigue damage model for fiber-reinforced plastic laminates. Proceedings <strong>of</strong> the<br />
Institution <strong>of</strong> Mechanical Engineers, Part C, 1986, 200(3): 155–166.<br />
[24] Broutman L J, Sahu S. A new theory to predict cumulative fatigue damage in fiberglass reinforced plastics. Composite Materials: Testing<br />
and Design, ASTM STP 497, 1972: 170-188.<br />
[25] Hashin Z. Cumulative damage theory for <strong>composite</strong> materials: Residual life and residual strength methods. Composites Science and<br />
Technology, 1985, 23(1): 1-19<br />
[26] Charewicz A, Daniel I M. Damage mechanisms and accumulation in graphite/epoxy laminates. Composite Materials. <strong>Fatigue</strong> and fracture,<br />
ASTM STP 907, Philadelphia, ASTM, 1986: 274-297.<br />
[27] Schaff J R,Davidson B D. Life prediction methodology for <strong>composite</strong> structures, Part I-Constant amplitude and two-stress level fatigue.<br />
Journal <strong>of</strong> Composite Materials, 1997, 31(2): 128-157.<br />
[28] Schaff, J R, Davidson B D. Life prediction methodology for <strong>composite</strong> structures. Part II- Spectrum fatigue. Journal <strong>of</strong> Composite<br />
Materials, 1997, 31(2): 158-181.<br />
[29] Sendeckyj G P. Life prediction for resin-matrix <strong>composite</strong> materials. <strong>Fatigue</strong> <strong>of</strong> <strong>composite</strong> materials, Amsterdam, Elsevier Science<br />
Publishers, 1990: 431-483.<br />
[30] Xiong J J, Li H Y, Zeng B Y. A strain-based residual strength model <strong>of</strong> carbon fibre/epoxy <strong>composite</strong>s based on CAI and fatigue residual<br />
strength concepts. Composite Structures 2008, 85: 29-42.<br />
[31] Hahn H T, Kim R Y. Pro<strong>of</strong> testing <strong>of</strong> <strong>composite</strong> materials. Journal <strong>of</strong> Composite materials. 1975, 9:297-311.<br />
[32] Haplin J C, Jerina K L, Johnson T A. Analysis <strong>of</strong> the test methods for high modules fibers and <strong>composite</strong>s, ASTM STP 521, Philadelphia,<br />
American Society for Testing and Materials, 1973: 5-64.<br />
[33] Philippidis T P, Assimakopoulou T T. Using acoustic emission to assess shear strength degradation in FRP <strong>composite</strong>s due to constant and<br />
variable amplitude fatigue <strong>loading</strong>. Composites Science and Technology, 2008, 68: 840-847.<br />
[34] Chou P C, Croman R. Residual strength in fatigue based on the strength-life equal rank assumption. Journal <strong>of</strong> Composite Materials, 1978,<br />
12: 177-194.<br />
[35] Yao W X, Himmel N.A new cumulative fatigue damage model for fiber-reinforced plastics.Composites Science and Technology, 2000,<br />
60: 59~64.<br />
[36] Caprino G. Predicting fatigue life <strong>of</strong> <strong>composite</strong> laminates subjected to tension-tension fatigue. Journal <strong>of</strong> Composite Materials, 2000,<br />
34(16): 1334-1355.<br />
[37] Revuelta D, Cuartero J, Miravete A, et al. A new approach to fatigue analysis in <strong>composite</strong>s based on residual strength degradation,<br />
Composite Structures, 2000, 48: 183-186.<br />
[38] Reifsnider K L, Stinchcomb W W. A critical element model <strong>of</strong> the residual strength and life <strong>of</strong> <strong>Fatigue</strong>-loaded <strong>composite</strong> coupons.<br />
Composite Materials: <strong>Fatigue</strong> and Fracture, Hahn H T, ed. ASTM STP 907, Philadelphia, American Society for Testing and Materials,<br />
1986: 298-313.<br />
[39] Shokrieh M M, Lessard L B. Multiaxial fatigue behavior <strong>of</strong> unidirectional plies based on uniaxial fatigue experiments- I. Modelling.<br />
International Journal <strong>of</strong> <strong>Fatigue</strong>, 1997, 19(3): 201-207.<br />
[40] Lee C H, Jen M H. <strong>Fatigue</strong> response and modeling <strong>of</strong> variable stress amplitude and frequency in AS-4/PEEK <strong>composite</strong> laminates Part 1:<br />
experiments. Journal <strong>of</strong> Composite Materials, 2000, 34(11): 906-929.<br />
[41] Lian W, Yao W X. <strong>Fatigue</strong> life prediction <strong>of</strong> <strong>composite</strong> laminates by FEA simulation method. International Journal <strong>of</strong> fatigue, 2010,<br />
32(1):123-133.
An Energy-Based <strong>Fatigue</strong> Approach for Composites Combining<br />
Failure Mechanisms, Strength and Stiffness Degradation<br />
Abstract<br />
H Krüger *, R Rolfes, E Jansen<br />
Institute <strong>of</strong> Structural Analysis, Leibniz Universität Hannover, Appelstrasse 9a, 30167 Hanover, Germany<br />
In order to improve the fatigue analysis <strong>of</strong> large structures made <strong>of</strong> fibre-reinforced plastics a physically motivated<br />
fatigue assessment procedure is investigated. In contrast to the analysis procedure usually applied the novel model<br />
consists <strong>of</strong> a layer-wise continuum mechanics approach on macro scale and considers different failure modes.<br />
The approach subdivides into two analysis parts: discontinuous quasi-static degradation and continuous fatigue<br />
degradation. The discontinuous approach is based on a well-known failure mode theory. The continuous degradation<br />
approach makes use <strong>of</strong> an energy-based hypothesis, which combines strength and stiffness degradation.<br />
With the present approach stress redistributions and sequence effects can be investigated.<br />
Keywords: <strong>Fatigue</strong> modelling, reinforced <strong>composite</strong>, damage mechanics, layer-based approach, degradation, sequence effects<br />
1. Introduction<br />
For evaluating the fatigue <strong>behaviour</strong> <strong>of</strong> structures made <strong>of</strong> fibre-reinforced plastics (FRPs) it is<br />
common practice to use SN-curves on laminate scale in combination with the simple and linear damage<br />
accumulation rule according to Palmgren and Miner [2]. This is done even though this rule has been<br />
developed for metals, which are in contrast to FRPs isotropic and ductile and have only a single failure<br />
mode. Additionally stress redistributions between layers and within the structure can occur since the<br />
material properties <strong>of</strong> FRPs, stiffness and strength degrade depending on the <strong>loading</strong> and the<br />
development <strong>of</strong> tolerable cracks. This causes a non-linear damage accumulation and shows that<br />
Palmgren´s and Miner´s rule is not valid for FRPs. Finally, the whole procedure is not really suitable, it<br />
is purely empirical and does not represent the complex failure <strong>behaviour</strong> <strong>of</strong> FRPs. Furthermore, the<br />
procedure is also costly to apply, because due to this improper approach each laminate set-up and<br />
<strong>loading</strong> situation needs to be experimentally investigated.<br />
Due to these shortcomings there has been a lot <strong>of</strong> research activity in the field <strong>of</strong> modelling the<br />
fatigue <strong>behaviour</strong> <strong>of</strong> FRPs in the last decades. The models investigated can be classified in three groups:<br />
The first group is built by the so-called “fatigue life concepts” which are, similar to the Palmgren and<br />
Miner rule, linear and <strong>of</strong> purely empirical nature [3,4]. The second group comprises the<br />
phenomenological models [5,6,7], which are based on empirically determined evolution laws<br />
concerning the stiffness or the strength <strong>of</strong> laminates. Progressive damage models [8,9], the third group,<br />
* Corresponding author. Tel: +49 (0)511 762 2266; fax: +49 (0)511 762 2366<br />
E-mail address: H.Krueger@isd.uni-hannover.de
148<br />
Fifth International Conference on <strong>Fatigue</strong> <strong>of</strong> Composites<br />
describe the progressive development <strong>of</strong> cracks or delaminations.<br />
The present approach combines several advantages <strong>of</strong> different groups and avoids unwanted<br />
disadvantages. It is closest to the second type <strong>of</strong> models, since in principal it also bases on empirical<br />
evolution laws. But due to its energy-based methodology and combination with the fracture-mode<br />
dependent theory <strong>of</strong> Puck [1] it is more mechanically oriented and couples stiffness and strength<br />
degradation. In contrast to the progressive damage models it is applicable to arbitrary structures and<br />
allows for the consideration <strong>of</strong> large number <strong>of</strong> cycles, since it works on macro-mechanical scale and<br />
uses a block-wise <strong>loading</strong> approach. Due to the restriction to a 2D-approach efficient standard shell<br />
elements can be used and also the fatigue assessment <strong>of</strong> large structures (e.g. rotorblades <strong>of</strong> wind energy<br />
converters (WEC)) may be achievable. Since distinct stiffness and strength degradations occur during<br />
the lifetime <strong>of</strong> a structure made <strong>of</strong> FRPs it is required to investigate structures on a more global scale in<br />
order to cover the accompanying stress redistributions. Besides these global or macro-scale stress<br />
redistributions also local (meso-scale) stress redistributions between the layers <strong>of</strong> a laminate are<br />
accounted for, since the model is layer-based.<br />
The fatigue model is implemented in a material routine, which can be used in combination with the<br />
commercial FE-s<strong>of</strong>tware Abaqus ® and its layered shell elements. Using this type <strong>of</strong> elements each layer<br />
can have its own material definition and, even more important, independent degradation factors.<br />
2. Overview and Framework <strong>of</strong> the New <strong>Fatigue</strong> Approach<br />
Within the present approach the standard structural analysis is extended by a fatigue assessment<br />
procedure (Figure 1). Therewith the analysis consists <strong>of</strong> two parts, the quasi-static and the cyclic part.<br />
First the structure will be evaluated against possible quasi-static failures as inter-fibre failures or fibre<br />
failures as described by Puck´s failure criterion [1]. If a tolerable failure occurs the material properties<br />
will be degraded as presented in chapter 3. Such a degradation is termed discontinuous because this<br />
happens only if a failure criterion is met. Fibre failures and inter-fibre failures with an inclined fracture<br />
surface are according to Puck intolerable due to their abrupt and explosive character and thus the<br />
analysis will be aborted in the case, that one <strong>of</strong> the corresponding criteria is met. However, during the<br />
fatigue life and also during the fatigue assessment some failures <strong>of</strong> filaments and single fibres occur, but<br />
these are regarded as uncritical since they are supposed to be very limited and release low-energy.<br />
If the quasi-static strength criterion is not met or is not met anymore after discontinuous degradation,<br />
it is changed over to the cyclic part <strong>of</strong> the analysis. Subject to the maximum stress, the number <strong>of</strong> cycles<br />
and the load ratio R, which is the ratio <strong>of</strong> the maximum stress to the minimum stress, the material is<br />
degraded by means <strong>of</strong> the new energy-based approach at each material point (chapter 4). This<br />
degradation is termed continuous, since each load cycle leads to a degradation until total degradation is<br />
reached.<br />
The analysis <strong>of</strong> the following <strong>loading</strong> step is conducted with degraded material properties and<br />
therewith stress redistributions on meso-scale (between layers) as well as on macro-scale can occur and<br />
the analysis can become non-linear.
An Energy-based <strong>Fatigue</strong> Approach for Composites Combining Failure Mechanisms, Strength and Stiffness Degradation 149<br />
Figure 1: Flowchart <strong>of</strong> the structural analysis including fatigue evaluation [13].<br />
Since lightweight-structures are usually exposed to a large number <strong>of</strong> load cycles, which,<br />
depending on the application, may reach up to hundreds <strong>of</strong> millions, it is not desired to execute a<br />
cycle-by-cycle analysis. Therefore the approach provides the option to group the external <strong>loading</strong> to<br />
blocks <strong>of</strong> the same maximum <strong>loading</strong> and range as this is usually done with stresses, e.g. by means <strong>of</strong><br />
the rainflow-count method, even if the correctness <strong>of</strong> the analysis may slightly decrease. Structures <strong>of</strong><br />
mechanical engineering applications are <strong>of</strong>ten exposed to repetitive <strong>loading</strong> situations, then the analysis<br />
can be drastically shortened.<br />
The degradation factors are the same for the continuous and the discontinuous degradation. In order<br />
to sufficiently describe the stiffness and the strength degradation <strong>of</strong> a plane stress approach ten<br />
parameters are required. The degradation parameters <strong>of</strong> the material properties in normal direction need<br />
to be distinguished in tension and compression, since the effect <strong>of</strong> the cracks developed are different.<br />
This is not such pronounced for the parameters associated with shear.<br />
with: Ei j : stiffness<br />
Ri j : strength<br />
1 <br />
1 <br />
E E D E <br />
(1)<br />
j j j<br />
i 0, i E, i 0, i E, i<br />
R R D R <br />
(2)<br />
j j j j j<br />
i 0, i R, i 0, i R, i<br />
DE,i j : stiffness damage parameter (0: undamaged; 1: totally damaged)<br />
DR,i j : strength damage parameter (0: undamaged; 1: totally damaged)<br />
ηE,i j : stiffness degradation factor (1: undamaged; 0: totally damaged)<br />
ηR,i j : strength degradation factor (1: undamaged; 0: totally damaged)<br />
i: orientation<br />
j: direction (tension or compression)<br />
0: undamaged
152<br />
Fifth International Conference on <strong>Fatigue</strong> <strong>of</strong> Composites<br />
Fig. 3. Development <strong>of</strong> the degradation factors subject to the stress exposure fE,IFF and schematic illustration <strong>of</strong> multiple degradation.<br />
Indeed the effect <strong>of</strong> inter-fibre-failures on the shear stiffness depends on the direction <strong>of</strong> the normal<br />
stressing (tension or compression), but this difference is described to be not that drastic [11] and no<br />
quantitative data is available. Thus the shear degradation within a compressive or tensile regime is<br />
considered to be the same.<br />
This is not valid for the stiffness degradation perpendicular to the fibres. Straight cracks, as caused by<br />
IFF <strong>of</strong> mode A or B, open <strong>under</strong> tensile <strong>loading</strong>, but <strong>under</strong> compressive <strong>loading</strong> those simply close and<br />
the related stiffness remains unchanged.<br />
4. Continuous Degradation<br />
In contrast to the discontinuous degradation within the continuous degradation procedure each<br />
stressing leads to a certain degradation and also degradations due to compressive normal stresses and in<br />
fibre direction are considered. The evolution <strong>of</strong> damage bases mainly on the development <strong>of</strong> strains<br />
during the fatigue life process, whose free parameters need to be calibrated by means <strong>of</strong> fatigue tests or<br />
can be well estimated according to data given in the literature. This is shown exemplarily in figure 4 for<br />
the strain evolution perpendicular to the fibres. The static strain and the fatigue failure strain are known,<br />
the single free parameter combination (Δε2/Δn2) and allows for fitment to the material analysed.<br />
with<br />
<br />
2 n2 1 2 n2<br />
A , B <br />
n n<br />
fat<br />
1<br />
n <br />
f ,2 n <br />
2 0,2 1AB 1 11 N2 0,2 N2<br />
<br />
<br />
<br />
1 <br />
2 2 2 2<br />
ε0: static strain<br />
εf fat : strain at fatigue failure<br />
n: number <strong>of</strong> cycles<br />
N2: number <strong>of</strong> cycles to failure in 2-direction<br />
(10)
An Energy-based <strong>Fatigue</strong> Approach for Composites Combining Failure Mechanisms, Strength and Stiffness Degradation 153<br />
Fig. 4. Evolution-curve <strong>of</strong> ε2-strains.<br />
The main constituent <strong>of</strong> the new continuous degradation method is an energy-based hypothesis,<br />
which was applied to concrete at first [10]. This hypothesis equals the dissipated energy during fatigue<br />
<strong>loading</strong> with that during quasi-static <strong>loading</strong> (fig. 5). This means that the damage state, in the sense <strong>of</strong><br />
mechanical properties as stiffness and strength (in the same material orientation), only depends on the<br />
amount <strong>of</strong> energy dissipated, irrespective <strong>of</strong> how <strong>of</strong>ten and with which amplitude the structure has been<br />
loaded. Unlike the application to isotropic materials the orientation <strong>of</strong> stressing and the failure mode<br />
respectively need to be incorporated in case <strong>of</strong> anisotropic materials as FRPs,<br />
W ( D) W ( D, , n)<br />
(11)<br />
da, j fat, j fat<br />
i i<br />
Fig. 5. Development <strong>of</strong> energy dissipation and degradation caused by quasi-static (top line) or cyclic <strong>loading</strong> (bottom line), Wi da,j or Wi fat,j ;<br />
showing the example <strong>of</strong> tensile σ2-stresses (in-situ layer).<br />
Due to that approach the stiffness and the strength degradations are coupled together, so also a<br />
strength degradation <strong>of</strong> failures detected by the quasi-static strength analysis can be established. The<br />
residual strength is determined through the dissipated energy incorporated in a stress-strain-diagram. A<br />
degradation <strong>of</strong> the strength leads to a shrinkage <strong>of</strong> the fracture body, whose undamaged variant (ηR,i j =<br />
1.0) is described by Puck´s original failure criterion. The effects <strong>of</strong> the five independent strength<br />
degradation factors on the fracture body and therewith on the failure criterion is presented in figure 6.<br />
Different combinations <strong>of</strong> the strength degradation factors with ηR,i j = 1.0 or ηR,i j = 0.5 are shown.
154<br />
Fifth International Conference on <strong>Fatigue</strong> <strong>of</strong> Composites<br />
Fig. 6. Shrinkage <strong>of</strong> the fracture body with different combinations <strong>of</strong> the strength degradation factors (ηR,i j = 1.0 or ηR,i j = 0.5).<br />
5. Numerical Example<br />
In order to test the approach a numerical example is investigated. The example should show, that the<br />
degradation procedure reasonably works. It is checked, if stress redistribution and sequence effects due<br />
to stiffness degradations occur.<br />
5.1 Mechanical Model<br />
The developed approach is tested on an open-hole plate with a GFRP-[0/90/0] laminate lay-up, which<br />
is simply supported on the left edge (fig. 7). In order to reduce calculation costs and due to the<br />
symmetry <strong>of</strong> the structure and the <strong>loading</strong> only the upper half is modelled and only degradations caused<br />
by tensile stresses are considered. Standard shell elements with four nodes and a reduced integration<br />
scheme are used for the FE-model, Abaqus ® is chosen as the FE-solver. In-plane tension fatigue <strong>loading</strong><br />
(R=0.1) is applied horizontally at the right-hand boundary. The effect <strong>of</strong> two different <strong>loading</strong> sequences<br />
are compared. They deviate only in their sequences, which are opponent to each other: The first load<br />
sequence is decreasing, so the largest amplitude is at first, and the second one is increasing and the<br />
largest amplitude is at last (fig. 7).
An Energy-based <strong>Fatigue</strong> Approach for Composites Combining Failure Mechanisms, Strength and Stiffness Degradation 155<br />
Fig. 7. Schematic diagram <strong>of</strong> the structure used for the numerical example and block diagram <strong>of</strong> two <strong>loading</strong> sequences.<br />
5.2 Material Model and Material Data<br />
The material data used for the numerical model can be found in table 1, the data is extracted from<br />
Knops [11]. The tensile stress-strain-curves implemented in the program can be found in Knops [11] and<br />
Maimi et al. [12] respectively and are illustrated in figure 8.<br />
Table 1. Material Data used for the numerical example.<br />
E∥ in MPa E⊥ in MPa G∥⊥ in MPa ν∥⊥ R∥ t in MPa<br />
45,600 16,200 5,830 0.278 1,140<br />
R⊥ t in MPa R∥ c in MPa R⊥ c in MPa R∥⊥ in MPa p⊥∥ t<br />
50 570 114 72 0.3<br />
p⊥∥ c p⊥⊥ t p⊥⊥ c Mag ηwm<br />
0.25 0.20 0.20 1.30 0.50<br />
ηws ηrE2 cE2 ξE2 ηrE21<br />
0.50 0.03 5.3 1.3 0.25<br />
cE21 ξE21<br />
0.70 1.5<br />
Unless appropriate SN-curves are available, in order to determine the number <strong>of</strong> cycles to failure N i<br />
caused by constant amplitude <strong>loading</strong> the formula according to [14] is used, which shows generally a<br />
good approximation to experimentally investigated SN-curves. Besides the strengths, the<br />
slope-parameters mi <strong>of</strong> the SN-curves allow for fitment to the material used,<br />
with mi: slope <strong>of</strong> the SN-curve (i: direction)<br />
SM: stress mean<br />
SA: stress amplitude<br />
i<br />
t c t c<br />
Ri Ri 2<br />
SM Ri R <br />
i<br />
Ni<br />
<br />
2<br />
S<br />
<br />
A<br />
.<br />
m<br />
(12)
156<br />
6. Results and Discussion<br />
Fifth International Conference on <strong>Fatigue</strong> <strong>of</strong> Composites<br />
Fig. 8. Tensile stress-stain-curves implemented in the calculation routine.<br />
Figure 9 presents the degradation <strong>of</strong> the tensile material stiffness perpendicular to the fibres <strong>of</strong> the<br />
inner 90°- and the outer 0°-layers after applying the different load sequences. If the applied load is high<br />
in the first stage <strong>of</strong> the <strong>loading</strong> sequence, the stresses close to the hole are much higher than in case <strong>of</strong><br />
the increasing <strong>loading</strong> sequence. This leads consequently to a clearly higher degradation in that area.<br />
However the following <strong>loading</strong> steps do not cause a distinct further degradation. In case <strong>of</strong> the<br />
increasing <strong>loading</strong> sequence the area around the hole is already degraded before the structure is highly<br />
loaded. Due to that the total degradation in that area is comparably little. The stresses redistribute to the<br />
area between the edge and the hole <strong>of</strong> the structure, there on the contrary the degradation is higher.<br />
It can be stated that decreasing load sequences lead to a more local but higher degradation and<br />
increasing <strong>loading</strong> sequences to a more global and lower degradation.<br />
Fig. 9. ηE2 t -distribution after applying the two <strong>loading</strong> sequences (top: decreasing sequence, bottom: increasing sequence; left: 90°-layer, right:<br />
0°-layer).
An Energy-based <strong>Fatigue</strong> Approach for Composites Combining Failure Mechanisms, Strength and Stiffness Degradation 157<br />
7. Conclusions and Outlook<br />
The results show that it is possible to simulate degradations caused by fatigue <strong>loading</strong> and therewith<br />
sequence effects using the present approach, which seems to be promising. Due to the energy-based<br />
damage mechanics approach used it is possible to simulate stiffness degradation in combination with<br />
strength degradation <strong>of</strong> FRPs <strong>under</strong> a high number <strong>of</strong> cycles. By means <strong>of</strong> integrating Puck´s theory the<br />
present approach considers different failure modes and enables a relatively mechanical and precise<br />
fatigue assessment. Further steps are the improvement <strong>of</strong> the model with special attention to<br />
<strong>multiaxial</strong>ity and interactions as well as the verification <strong>of</strong> the model.<br />
References<br />
[1] A. Puck, “Festigkeitsanalyse von Faser-Matrix-Laminaten – Modelle für die Praxis, Carl Hanser, München, 1996; also in: M. Knops,<br />
„Analysis <strong>of</strong> Failure in Fiber Polymer Laminates: The Theory <strong>of</strong> Alfred Puck“, Springer, Germany, 2008.<br />
[2] M.A. Miner, “Cumulative damage in fatigue”, Journal <strong>of</strong> Applied Mechanics (1945), 67, A159-A164.<br />
[3] Z. Hashin, A. Rotem, „A fatigue criterion for fibre reinforced <strong>composite</strong> materials“, Journal <strong>of</strong> Composite Materials, 7 (1973), p.<br />
448-464.<br />
[4] A. Plumtree, G.X. Cheng, „A fatigue damage parameter for <strong>of</strong>f-axis unidirectional fibre-reinforced <strong>composite</strong>s“, International Journal <strong>of</strong><br />
<strong>Fatigue</strong>, 21(8) (1999), p. 849-856.<br />
[5] M.M. Shokrieh, L.B. Lessard, “Residual fatigue life simulation <strong>of</strong> laminated <strong>composite</strong>s”, Proceedings <strong>of</strong> International Conference on<br />
Advanced Composites (ICAC 98), 15–18, December 1998, Hurghada, Egypt, p. 79–86.<br />
[6] J.N. Yang, D.L. Jones, S.H. Yang, A. Meskini, “A stiffness degradation model for graphite/epoxy laminates”, Journal <strong>of</strong> Composite<br />
Materials, 24 (1990), p. 753-769.<br />
[7] W.X. Yao, N. Himmel, “A new cumulative fatigue damage model for fibre-reinforced plastics”, Composites Science and Technology, 60<br />
(2000), p. 59-64.<br />
[8] X. Feng, M.D. Gilchrist, A.J. Kinloch, F.L. Matthews, „Development <strong>of</strong> a method for predicting the fatigue life <strong>of</strong> CFRP components”,<br />
in : Degallaix, S., Bathias, C. und Fougères, R. (Editor), International Conference on fatigue <strong>of</strong> Composites, Proceedings, 3- 5 June<br />
1997, Paris, France, La Société Française de Métallurgie et de Matériaux, p. 407-414.<br />
[9] M.M. Shokrieh, L.B. Lessard, “Progressive fatigue damage modeling <strong>of</strong> <strong>composite</strong> materials, Part I: Modeling”, Journal <strong>of</strong> Composite<br />
Materials, 34(13) (2000), p. 1056-1080.<br />
[10] D. Pfanner, “Zur Degradation von Stahlbetonbauteilen unter Ermüdungsbeanspruchung” („Degradation <strong>of</strong> Structures Made <strong>of</strong> Reinforced<br />
Concrete <strong>under</strong> <strong>Fatigue</strong> Loading“), PhD-Thesis, Ruhr-Universität Bochum, 2000.<br />
[11] M. Knops, „Analysis <strong>of</strong> Failure in Fiber Polymer Laminates: The Theory <strong>of</strong> Alfred Puck“, Springer, Germany, 2008.<br />
[12] P. Maimi, P. P. Camanho, J.A. Mayugo, C.G. Dávila: „A continuum damage model for <strong>composite</strong> laminates (Part I: Constitutive model;<br />
Part II: Computational implementation and validation), Mechanics <strong>of</strong> Materials, 39 (2007), S. 897-919.<br />
[13] H. Krüger, R. Rolfes: “A Physically Motivated and Layer-based <strong>Fatigue</strong> Concept for Fiber-Reinforced Plastics”, 14.-17. September 2010,<br />
CST conference, Valencia, Spain.<br />
[14] Germanischer Lloyd: “Richtlinie für die Zertifizierung von Windenergieanlagen“, engl.: „Certification Guideline for Wind-Energy<br />
Converters“, Germanischer Lloyd Wind Energie GmbH, Hamburg (2003).
Experimental characterization and analytical modeling <strong>of</strong><br />
material non-linearity in fatigue analysis <strong>of</strong> polymer matrix<br />
<strong>composite</strong>s<br />
Abstract<br />
M Magin, N Himmel *<br />
Institut für Verbundwerkst<strong>of</strong>fe GmbH – University Kaiserslautern, Erwin Schrödinger Str. Geb. 58 – 67663 Kaiserslautern, Germany<br />
Due to their high mechanical performance and advantageous cost and weight performance, fiber reinforced polymer<br />
matrix <strong>composite</strong>s are widely used in aerospace and mechanical engineering. To asses the fatigue life <strong>of</strong> these <strong>composite</strong>s<br />
in computational simulations, the <strong>under</strong>lying material models need to consider physical non-linearity <strong>under</strong> both static<br />
and cyclic <strong>loading</strong>. Non-linear material models <strong>of</strong> unidirectional <strong>composite</strong>s with glass and carbon fiber reinforcement<br />
which are widely used in the wind energy and aircraft industry were determined experimentally and implemented into a<br />
fatigue life prediction program. Based on the experimental input, the influence <strong>of</strong> the physical non-linearity <strong>of</strong> the<br />
<strong>composite</strong> materials on the results <strong>of</strong> static and fatigue life analyses was investigated. While non-linear material models<br />
require significantly more experimental and analytical effort, their usage leads to more realistic fatigue life calculations,<br />
which could be shown in a comparison <strong>of</strong> experimental and analytical results using different linear and non-linear<br />
analytical models.<br />
1. Introduction<br />
To simulate the fatigue life <strong>of</strong> fiber reinforced polymer matrix <strong>composite</strong>s, the <strong>under</strong>lying material<br />
models need to consider material non-linearity <strong>under</strong> both static and cyclic <strong>loading</strong>, such as stress-strain<br />
curves. In an on-going research project the physical non-linearity <strong>of</strong> polymer matrix <strong>composite</strong>s with<br />
glass and carbon fiber reinforcement was investigated. The selected materials are representative for<br />
applications in the wind energy and aircraft industries. The non-linear material parameters <strong>of</strong> these<br />
<strong>composite</strong>s were determined experimentally and implemented into a fatigue life prediction program.<br />
While non-linear material models require significantly more experimental and analytical effort, their<br />
usage leads to more realistic fatigue life calculations.<br />
2. Experimental characterization<br />
To investigate the inherent physical non-linearity <strong>of</strong> the selected <strong>composite</strong> materials experiments<br />
were carried on unidirectional laminates to determine tension and compression quasi-static strength<br />
parameters for [0], [90] and [±45] laminates prior to and after cyclic fatigue pre<strong>loading</strong> with constant<br />
amplitude sinusoidal load <strong>under</strong> load control at stress ratios <strong>of</strong> R= -1, 0.1 and 10 for three different<br />
* E-mail address: norbert.himmel@ivw.uni-kl.de
Experimental characterization and analytical modeling <strong>of</strong> material non-linearity in fatigue analysis <strong>of</strong> polymer matrix <strong>composite</strong>s<br />
stress levels. Also, stiffness degradation was continuously measured using the quotient <strong>of</strong> the stress and<br />
strain differences at the upper and lower reversal points <strong>of</strong> the hysteresis loop<br />
3. Modeling<br />
To model the fatigue life <strong>of</strong> fiber reinforced polymeric <strong>composite</strong>s subjected to general in-service<br />
<strong>loading</strong> pr<strong>of</strong>iles a simulation tool based on the Critical Element Concept <strong>of</strong> Reifsnider and Stinchcomb<br />
[2] has been developed [1]. The available simulation uses non-linear S-N curves, Puck‟s inter-fiber<br />
failure criterion, and stiffness degradation models with an empirical delamination parameter [3]. The<br />
s<strong>of</strong>tware was extended to incorporate non-linear material models for the stress-strain relationships <strong>of</strong><br />
unidirectional <strong>composite</strong>s for uniaxial fiber parallel, transverse, and shear <strong>loading</strong>, using a modified<br />
Ramberg-Osgood equation to predict the fatigue life more realistically. Furthermore, an optimized<br />
interface was generated for communication with a commercially available finite element program to<br />
allow the extension <strong>of</strong> the fatigue life analysis to geometrically more complex shaped structures and/or<br />
more heterogeneous load cases.<br />
4. Results<br />
Based on experimentally determined material properties, such as Fig. 1, the influence <strong>of</strong> the physical<br />
non-linearity on the fatigue life <strong>of</strong> polymer matrix <strong>composite</strong>s was investigated. As a parameter study [4]<br />
showed the influence <strong>of</strong> the fiber-parallel stress-strain relationship is particularly strong as it influences<br />
directly the stress transfer during fatigue <strong>loading</strong> to the 0° plies and, therefore, the load parallel to the<br />
fiber direction carried by these plies.<br />
Fig. 1. R = +0.1 S - N diagram <strong>of</strong> unidirectional glass/epoxy <strong>composite</strong> perpendicular to fiber direction with linear and non-linear curve fits<br />
The comparison <strong>of</strong> experimental and simulation results <strong>of</strong> a carbon fiber reinforced<br />
vinylester-urethane hybrid resin toughened by liquid, epoxy-terminated butadiene-nitrile rubber<br />
(CF/VEUH:ETBN) subjected to miniTWIST variable amplitude <strong>loading</strong> (Fig. 2) shows that the best<br />
159
160<br />
Fifth International Conference on <strong>Fatigue</strong> <strong>of</strong> Composites<br />
correlations are obtained for a simulation mode combining non-linear stress-strain relations with<br />
inter-fiber failure and delamination induced stiffness reduction. A model assuming linear stress-strain<br />
behavior combined with the neglecting <strong>of</strong> stiffness degradation overestimates the fatigue life, while it is<br />
<strong>under</strong>estimated by combining linear stress-strain behavior and the full degradation <strong>of</strong> the<br />
multidirectional laminate to its 0° plies.<br />
Fig. 2. Test results and fatigue life predictions for [+45/0/-45/90]S CF/VEUH:ETBN <strong>under</strong> miniTWIST variable amplitude <strong>loading</strong> [3]<br />
Acknowledgements<br />
The financial support <strong>of</strong> the German Research Foundation (DFG) within the research project<br />
'Lebensdaueranalyse dünnwandiger Faser-Kunstst<strong>of</strong>f-Verbund-Strukturen unter Berücksichtigung<br />
werkst<strong>of</strong>flicher Nichtlinearitäten' (HI 700 / 11-2) to carry out the presented work is gratefully<br />
acknowledged.<br />
References<br />
[1] Himmel, N.: <strong>Fatigue</strong> Life prediction <strong>of</strong> Laminated Polymer Matrix Composites. International Journal <strong>of</strong> <strong>Fatigue</strong>, 24:2–4, 2002, p. 349 –<br />
360.<br />
[2] Reifsnider, K. L.; Stinchcomb, W. W.: A Critical-Elemental Model for the Residual Strength and Life <strong>of</strong> <strong>Fatigue</strong>-Loaded Composite<br />
Coupons; In: H. T. Hahn (ed.), Composite Materials: <strong>Fatigue</strong> and Fracture, ASTM STP 907, 1986, pp. 298 – 313.<br />
[3] Noll, T.; Magin, M.; Himmel, N.: <strong>Fatigue</strong> Life Simulation <strong>of</strong> Multi-axial CFRP Laminates Considering Non-linearity <strong>of</strong> Material. 4 th<br />
International Conference on <strong>Fatigue</strong> <strong>of</strong> Composites, Sept. 26-28, 2007, Kaiserslautern, Germany.<br />
[4] Magin, M; Himmel, N.: Effect <strong>of</strong> Physical Non-linearity on Cyclic <strong>Fatigue</strong> Life Prediction <strong>of</strong> Polymer Matrix Composites. 8th Intern.<br />
Conference on Durability <strong>of</strong> Composite Systems (Duracosys 2008), July 16–18, 2008, Porto, Portugal.
Abstract<br />
Calorimetric Analysis <strong>of</strong> dissipative Effects associated<br />
with the <strong>Fatigue</strong> <strong>of</strong> GFRP Composites<br />
H Sawadogo, S Panier *, S Hariri<br />
Polymers and Composites Technology & Mechanical Engineering Department, Ecole des<br />
Mines de Douai, 941 rue Charles Bourseul, 59508 Douai, France<br />
This paper deals with the calorimetric analysis <strong>of</strong> damage mechanisms <strong>of</strong> <strong>composite</strong> materials. Thermoelastic coupling<br />
source amplitude and the mean dissipation per cycle were derived from surface temperature field provided by an IR<br />
system. Cycling tests performed on glass/epoxy <strong>composite</strong>s with initial defects <strong>under</strong>line that thermoelastic source<br />
distribution give a good localization <strong>of</strong> the defect. During fatigue tests, mean dissipation per cycle increase when the<br />
delamination growths and seems to be a good indicator <strong>of</strong> the damage evolution.<br />
Keywords: Mechanical dissipation; <strong>composite</strong>; fatigue; delamination; infrared thermography<br />
1. Introduction<br />
Infrared thermography methods are nowadays well known to evaluate the damage in <strong>composite</strong><br />
materials. Theses methods are classified in two categories, passive and active. The passive methods<br />
consist to excite a structure by a thermal [1] or elastic wave [2] (vibrothermography) and to use infrared<br />
thermography to evaluate the temperature field. The second methods are based on the temperature<br />
variations due to the damage phenomena which occur when a mechanical load is applied to a specimen<br />
or a component. Some authors use directly the temperature changes to evaluate the damage [3, 4].<br />
Various studies on metallic materials previously carried out by Chrysochoos and coworkers have shown<br />
that heat sources produced by the material itself were more relevant than temperature when analyzing<br />
various phenomena such as Luder's bands [5], fatigue [6] or strain localization [7]. The main reason is<br />
that the temperature field is influenced by conduction as well as heat exchanges with ambient air and<br />
grips, unlike local heat sources. In this study, the fatigue phenomena on GFRP <strong>composite</strong>s were<br />
therefore studied using a calorimetric approach. The aim was to assess the heat source fields created<br />
during the fatigue test. The heat sources are derived from thermal images provided by an infrared<br />
camera using a local expression <strong>of</strong> the heat equation. A specific thermal image processing was<br />
developed to separately estimate the dissipated energy associated with the irreversible evolutions <strong>of</strong> the<br />
damage and the thermoelastic coupling sources induced by the reversible thermal expansion.<br />
2. Temperature: a good damage indicator?<br />
If we measure the surface temperature <strong>of</strong> a specimen during cycling test (self-heating test), we can<br />
* E-mail address: panier@ensm-douai.fr
162<br />
Fifth International Conference on <strong>Fatigue</strong> <strong>of</strong> Composites<br />
observe an increase <strong>of</strong> the surface average temperature and an oscillation around this average value<br />
(figure 1). These temperature variations are due to two different heat sources which are the<br />
thermoelastic coupling and the intrinsic dissipation.<br />
Fig. 1. Temperature variation during fatigue test [4].<br />
The small amplitude oscillatory temperature variations is due to the reversible thermoelastic heating<br />
and cooling during each <strong>loading</strong> cycle. This coupling leads to an oscillation <strong>of</strong> the temperature at the<br />
same frequency as the load (Figure 1). The Thermoelastic Stress Analysis (TSA) method which is a<br />
standard technique <strong>of</strong> stress analysis used in industry is based on the theoretical treatment <strong>of</strong> the the<br />
thermoelastic effect due to Lord Kelvin who showed that the temperature change ∆T associated with<br />
adiabatic elastic deformation can be expressed in the form:<br />
3<br />
T = -K T <br />
(1)<br />
m ii<br />
i=<br />
1<br />
where Km is the thermoelastic constant, Δζii is the normal stress changes.<br />
The second type <strong>of</strong> heat source is the intrinsic dissipation associated with irreversible structural<br />
changes, cycle after cycle. This is characterized by a progressive increase in overall temperature <strong>of</strong> the<br />
specimen (Figure 1). In 1921, this phenomenon had been observed by Moore and Kommers [8]. But it is<br />
especially since the work <strong>of</strong> Luong [3] that the temperature stabilized after several cycles is used as an<br />
indicator <strong>of</strong> fatigue damage. By cycling a sample and determining the steady-state temperature for<br />
different stress levels, he observed that beyond a given limit, the steady-state temperature starts to<br />
increase significantly. This regime change corresponds to a situation where the fatigue limit is reached.<br />
This empirical method does not give good results for all materials. However, some models based on a<br />
physical basis (microplasticity) have been developped to describe this result [9, 10].<br />
All these works concern only metallic materials. The applications <strong>of</strong> <strong>composite</strong> materials fatigue are<br />
rare even though they are historically one <strong>of</strong> the first materials studied. Indeed, Charles et al. have<br />
shown that it is possible to detect areas <strong>of</strong> stress concentration and location <strong>of</strong> cracking in glass/epoxy<br />
<strong>composite</strong> plates [11]. More recently, Toubal et al. showed that the surface temperature <strong>of</strong> a<br />
carbon/epoxy <strong>composite</strong> during a cyclic test have the same evolution than the damage typically
H Sawadogo, S Panier, S Hariri / Calorimetric Analysis <strong>of</strong> dissipative Effects associated with the <strong>Fatigue</strong> <strong>of</strong> GFRP Composites<br />
observed for <strong>composite</strong> materials [4]. The figure 2 showed the surface temperature variation measured<br />
by infrared thermography during a fatigue test [12]. The fatigue test was performed on woven<br />
glass/epoxy fabric [±45 o ] sample with a hole at a frequency <strong>of</strong> 5 Hz with a load ratio <strong>of</strong> 0.1 and a<br />
maximum stress corresponding to 45% <strong>of</strong> the UTS.<br />
Instead <strong>of</strong> working on the temperature (result) it was decided to identify the heat sources (origin) in<br />
the spirit <strong>of</strong> the works done by Chrysochoos et al. [5, 6].<br />
3. Heat Diffusion Equation<br />
Fig. 2. Evolution <strong>of</strong> the surface temperature during a fatigue test [12].<br />
The fatigue is considered as a dissipative, quasi-static thermomechanical process. The equilibrium<br />
state <strong>of</strong> each volume <strong>of</strong> material is then described by means <strong>of</strong> a set <strong>of</strong> n state variables. The chosen set<br />
<strong>of</strong> state variables is made <strong>of</strong>: the absolute temperature T, the linearised strain tensor ε and n-2 scalar<br />
components α1, α2, ... αn-2 <strong>of</strong> the vector a gathering the internal variables. Considering the first and second<br />
principles <strong>of</strong> thermodynamics and assuming that Fourier's law is used to model the heat conduction, the<br />
heat diffusion equation can be written as follow:<br />
where ρ is the mass density, C is the specific heat, k is the thermal conduction tensor, rext the external<br />
heat supply, the Cauchy stress tensor and the specific Helmhotz free energy. The right-hand<br />
side <strong>of</strong> equation (2) represents the heat sources produced by the material itself during the deformation<br />
process. It can be split into separate terms : the mechanical dissipation d1 which corresponds to the heat<br />
production due to various mechanical irreversibilities and the thermomechanical couplings sthe and sic.<br />
163<br />
(2)
164<br />
Fifth International Conference on <strong>Fatigue</strong> <strong>of</strong> Composites<br />
As the thermal informations given by the IR camera only concerns surface temperature field, the<br />
following assumptions are used to perform the heat source evaluation:<br />
the thermal conductivity is orthotopic and the thermal conductivity tensor have the following<br />
form :<br />
kxx 0 0 <br />
k =<br />
<br />
0 kyy<br />
0<br />
<br />
<br />
0 0 k zz (<br />
x, y, z)<br />
the density ρ and the specific heat C are independent <strong>of</strong> the internal state<br />
the convective terms included in the material time derivation are neglected hence<br />
the thermal gradients remain small throughout the thickness <strong>of</strong> the specimen<br />
T<br />
T =<br />
t<br />
the external heat supply rext is time-independent. Consequently, the equilibrium temperature<br />
( 0 )<br />
field T0 verifies: ( )<br />
- div k. grad T = rext<br />
the temperature variations induced by damage mechanisms remain too small to have any<br />
influence on the microstructural state hence sic = 0<br />
Under the previous assumptions and by integrating the equation (2) over the sample thickness, the<br />
following equation can be obtained:<br />
22 k <br />
xx kyy<br />
sthed1 + - - = +<br />
2D 2 2<br />
t C x C y<br />
C C<br />
where 1 h/2<br />
( x, y, t) = ( x, y, t ) dz<br />
h , s the ( x, y, t)<br />
, and<br />
-h<br />
/2<br />
d1 ( x, y, t ) are respectively the temperature<br />
variation = T- T0,<br />
thermoelastic source and intrinsic dissipation averaged through the thickness.<br />
is a time constant that characterizes the perpendicular heat exchanges between front and back specimen<br />
faces and the surroundings. Due to the small sample thickness and high thermal diffusivity, we can<br />
assume that the depth-wise averaged temperature field is close to the temperature distribution<br />
measured at the specimen surface.<br />
4. Computation <strong>of</strong> heat sources<br />
The purpose <strong>of</strong> the thermal data processing is to estimate the mean amplitude <strong>of</strong> the thermoelastic<br />
source sthe and the mean dissipation d 1 per cycle over a set <strong>of</strong> N <strong>loading</strong> cycles. The construction <strong>of</strong><br />
the heat source distribution via equation (3) requires the evaluation <strong>of</strong> partial derivative operators<br />
applied to noisy digital signals. To improve the signal to noise ratio, it is then necessary to reduce the<br />
noise amplitude without modifying the spatial and temporal thermal gradients. Among several possible<br />
methods [6, 7], a special local least-squares fitting <strong>of</strong> the thermal signal is considered in this work. The<br />
local fitting function <strong>of</strong> the temperature charts is chosen as:<br />
(3)<br />
2D<br />
<br />
(4)
H Sawadogo, S Panier, S Hariri / Calorimetric Analysis <strong>of</strong> dissipative Effects associated with the <strong>Fatigue</strong> <strong>of</strong> GFRP Composites<br />
where the trigonometric time functions describe the periodic part <strong>of</strong> the thermoelastic effects while the<br />
linear time function takes transient effects due to heat losses, dissipative heating and possible drifts in<br />
the equilibrium temperature into account. Figure 3 gives an example <strong>of</strong> temperature field obtained after<br />
filtering. The quantities sthe and d 1 are evaluated separately by replacing in equation (3)<br />
respectively by the periodic and linear part <strong>of</strong> fit .<br />
5. Experimental Set-up<br />
Fig. 3. Unfiltered and filtered temperature field.<br />
The material studied is a glass fiber and epoxy resin <strong>composite</strong>. Three kinds <strong>of</strong> specimens were tested.<br />
Thin flat specimens were used 250 mm length, 25 mm width and 4 to 4.2 mm thickness with five plies.<br />
For the two first kinds <strong>of</strong> specimen (type 1 and 2), the middle ply is cutted before fabrication to initiate<br />
the damage (figure 4). Type 3 are specimens with a hole without initial damage except which generate<br />
by the hole drilling. The stacking <strong>of</strong> the specimens are type 1: [0]5 (UD specimens), type 2 and<br />
3:[0=90=0=90=0] (cross-ply specimens).<br />
The fatigue tests were conducted using a servo-hydraulic machine equipped with a 100 kN cell. The<br />
experimental setup included two focal plane array infrared cameras (IRFPA Cedip MW) to measure<br />
surface temperature on both sides <strong>of</strong> the specimen. The camera is a IR system with 320 x 256 detectors<br />
which provide high sensitivity <strong>of</strong> less than 20 mK at 30 o C. The use <strong>of</strong> two infrared systems allows the<br />
evaluation <strong>of</strong> the heat sources from the two faces <strong>of</strong> the specimen. To reduce the radiation <strong>of</strong> the<br />
surroundings and obtain better thermal measure, the testing machine is protected with paper and the<br />
working place around the cameras with a black tissue (figure 5).<br />
165
166<br />
Fifth International Conference on <strong>Fatigue</strong> <strong>of</strong> Composites<br />
Fig. 4. Specimen stacking with defect.<br />
Fig. 5. <strong>Fatigue</strong> testing machine.<br />
The fatigue tests are carried out by submitting series <strong>of</strong> <strong>loading</strong> blocks. Each block consisted <strong>of</strong> 2 000<br />
cycles performed at constant <strong>loading</strong> frequency fL = 3Hz, constant load ratio Rζ= 0.1, and constant<br />
stress range Δζ. At the end <strong>of</strong> each <strong>loading</strong> block, the thermal equilibrium has been awaited before the<br />
next block starts. Tensile tests were performed on each kind to evaluate the ultimate tensile strength<br />
(UTS).<br />
6. Results<br />
6.1 Thermoelastic coupling source<br />
The surface temperatures <strong>of</strong> the both sides <strong>of</strong> the specimen were recorded during fatigue tests. The<br />
average temperature over 50 cycles, in the case <strong>of</strong> UD specimen (type 1), is given in figure 6. Hot spot<br />
appears at the same place on the both sides. The assumptions that the measured surface thermal map is<br />
very close to the depthwise average temperature field, is then verified due to the small thickness <strong>of</strong> the<br />
specimen. The thermoelastic coupling source calculation permits to <strong>under</strong>line too the occurrence <strong>of</strong> one<br />
hot spot (figure 6). We can remark that the thermoelastic coupling map give a better localization <strong>of</strong> the<br />
hot spot.
H Sawadogo, S Panier, S Hariri / Calorimetric Analysis <strong>of</strong> dissipative Effects associated with the <strong>Fatigue</strong> <strong>of</strong> GFRP Composites<br />
Fig. 6. Distribution <strong>of</strong> the average variation <strong>of</strong> the surface temperature ( o C) and the<br />
6.2 Dissipation source<br />
ζmax=45%UTS<br />
s ( o C/s ) on the both sides <strong>of</strong> UD specimen at<br />
Different levels <strong>of</strong> <strong>loading</strong> have been applied to the type 1 specimens (20, 30, 40, 50 and 60% <strong>of</strong> the<br />
UTS). The plots <strong>of</strong> the thermoelastic coupling term are not given. Figure 7 shows the pattern <strong>of</strong> mean<br />
dissipation per cycle calculated at different stress ranges (20, 30 and 40%). For low level <strong>of</strong> <strong>loading</strong><br />
(20%), no dissipation appears. For a load closed to 30% <strong>of</strong> UTS, localization <strong>of</strong> dissipation occurs. For<br />
higher load, final collapse <strong>of</strong> the specimen is characterized by a uniform dissipation along the initial<br />
defect (figure 7). This result shows that the dissipation source depends on the level <strong>of</strong> applied load. To<br />
be sure that the evaluated dissipation is linked with a damage process, the dissipation source was<br />
calculated during a delamination process.<br />
Fig. 7. Dissipation evaluated at different stress ranges ( o C/s).<br />
To study the delamination, cycling tests were performed on the cross ply specimens (type 2) with the<br />
same initial defect than the UD specimens (type 1). Pictures obtained with camera at different number<br />
<strong>of</strong> cycles show the the evolution <strong>of</strong> the delamination when a load <strong>of</strong> 40% UTS is applied (figure 8).<br />
Initially, the delamination is uniform (at 500 cycles) then the delamination growth is more important on<br />
the left <strong>of</strong> the specimen. The plot <strong>of</strong> the thermoelastic coupling source distribution after 1000 cycles and<br />
167
168<br />
Fifth International Conference on <strong>Fatigue</strong> <strong>of</strong> Composites<br />
4000 cycles gives an information on the stress concentration closed to the delamination zone (we can<br />
remark that the intensity is constant during the delamination propagation) (figure 9). From this plot, we<br />
can't conclude on the delamination growth.<br />
Fig. 8. Evolution <strong>of</strong> the delamination during fatigue test.<br />
Fig. 9. Distribution <strong>of</strong> s the ( o C/s ) at (a) 1000 cycles and (b) 4000 cycles.<br />
The evaluated dissipation source during the delamination process is given on figure 10. Initially, we<br />
have a uniform dissipation along the initial defect and after 1000 cycles, the dissipation increase on the<br />
left <strong>of</strong> the specimen where the delamination propagation is more important. The level <strong>of</strong> dissipation<br />
increase during the fatigue test and reach a maximum value <strong>of</strong> 0.15 C/s after 3 000 cycles. This value is<br />
constant during the delamination process.<br />
In figure 11, the trend <strong>of</strong> dissipation source along the specimen is pointed out during 4000 cycles. The<br />
shape <strong>of</strong> the pr<strong>of</strong>ile is in a good agreement with the delamination propagation.
H Sawadogo, S Panier, S Hariri / Calorimetric Analysis <strong>of</strong> dissipative Effects associated with the <strong>Fatigue</strong> <strong>of</strong> GFRP Composites<br />
Fig. 10. Evolution <strong>of</strong> the mechanical dissipation during fatigue test ( o C/s).<br />
Fig. 11. Variations in dissipation pr<strong>of</strong>ile during 4000 cycles.<br />
<strong>Fatigue</strong> tests were also performed on cross ply specimens without initial defect but with a hole (type<br />
3). The dissipation was calculated closed to the hole where the stress concentration is important. Figure<br />
12 shows the evolution <strong>of</strong> the dissipation source evaluated at different levels <strong>of</strong> loads with a new<br />
specimen for each test. For low stress ranges less than 30% <strong>of</strong> UTS, the intensity <strong>of</strong> dissipation source is<br />
small (less than 0.15 C/s) and constant. These specimens have reached a very high number <strong>of</strong> cycles<br />
169
170<br />
Fifth International Conference on <strong>Fatigue</strong> <strong>of</strong> Composites<br />
(100 000 cycles) without failure. At this level <strong>of</strong> stress, no damage or small damage was appeared.<br />
When the applied load increase, the dissipation increase too. For all the specimens, the calculation <strong>of</strong> the<br />
dissipation source was made 2000 cycles before the final failure <strong>of</strong> the specimen. In figure 13, the<br />
evaluated dissipation were reported for two fatigue tests performed on two specimens at different levels<br />
<strong>of</strong> load (50% and 60% <strong>of</strong> UTS). The obtained curves were similar for the two levels <strong>of</strong> <strong>loading</strong>. During<br />
the first 40% <strong>of</strong> life <strong>of</strong> the specimen, the level <strong>of</strong> dissipation was constant and small. Next, the<br />
dissipation increase until the failure <strong>of</strong> the specimens.<br />
7. Conclusion<br />
Fig. 12. Evolution <strong>of</strong> the calculated dissipation versus the applied load.<br />
Fig. 13. Evolution <strong>of</strong> the calculated dissipation for two levels <strong>of</strong> <strong>loading</strong>.<br />
This study is intented to show the relation between the dissipation <strong>of</strong> heat and the damage <strong>of</strong> the<br />
<strong>composite</strong>s. Based on a local expression <strong>of</strong> the heat equation, an infrared image processing method is<br />
used to estimate the thermoelastic coupling source amplitude and the mean dissipation per cycle. This<br />
method had been used to study the damage <strong>of</strong> UD and cross ply glass/epoxy specimens with an initial<br />
defect.<br />
The localization <strong>of</strong> the defect is given by the thermoelastic source distribution due to the stress<br />
concentration near the defect. When an evolution <strong>of</strong> the damage is observed, the mean dissipation per<br />
cycle increase. Cycling tests performed on cross ply specimens <strong>under</strong>line the relation between the<br />
delamination growth and the mean dissipation per cycle distribution. The plot <strong>of</strong> the dissipation term<br />
during fatigue tests at two different levels <strong>of</strong> <strong>loading</strong> shows that the dissipation is low and constant at
H Sawadogo, S Panier, S Hariri / Calorimetric Analysis <strong>of</strong> dissipative Effects associated with the <strong>Fatigue</strong> <strong>of</strong> GFRP Composites<br />
the begin (until 40% <strong>of</strong> the life) and then increase until the final failure <strong>of</strong> the specimen.<br />
In terms <strong>of</strong> structure design, the mean dissipation per cycle mapping may be useful to evaluate the<br />
localization and the evolution <strong>of</strong> the damage. The next objectives are to <strong>under</strong>line the limits <strong>of</strong> this<br />
method. A fully coupled full field kinematic and thermal measurements with motion compensation must<br />
be performed to built up a coupled energy balance.<br />
References<br />
[1] X. Maldague, Theory and Practice <strong>of</strong> Infrared Technology for Nondestructive Testing, John Wiley & Sons, 2001.<br />
[2] N. Krohn, A. Dillenz, K. Nixdorf, R. Voit-Nitschmann, G. Busse, Ndt <strong>of</strong> shape adaptive structures, NDT & E International 34 (2001)<br />
269-276.<br />
[3] M. Luong, Infrared thermography <strong>of</strong> fatigue in metals, SPIE 1692 (1992) 222-233.<br />
[4] L. Toubal, M. Karama, B. Lorrain, Damage evolution and infrared thermography in woven <strong>composite</strong> laminates <strong>under</strong> fatigue <strong>loading</strong>,<br />
International Journal <strong>of</strong> <strong>Fatigue</strong> 28 (2006) 1867-1872.<br />
[5] A. Chrysochoos, H. Louche, Thermal and dissipative e_ects accompanying luders band propagation, Mat. Sci. Eng. A-struct. 307 (2001)<br />
15-22.<br />
[6] B. Berthel, B. Wattrisse, A. Chrysochoos, A. Galtier, Thermographic analysis <strong>of</strong> fatigue dissipation properties <strong>of</strong> steel sheets, Strain 43<br />
(2007) 273-279.<br />
[7] B. Wattrisse, A. Chrysochoos, J. Muracciole, M. Nemoz-Gaillard, Analysis <strong>of</strong> strain localization during tensile tests by digital image<br />
correlation, Experimental Mechanics 41 (2001) 29-39.<br />
[8] H. Moore, J. Kommers, <strong>Fatigue</strong> <strong>of</strong> metals <strong>under</strong> repeated stress, Chemical and metallurgical Engineering 25 (1921) 1141-1144.<br />
[9] C. Doudard, S. Calloch, F. Hild, P. Cugy, A. Galtier, Identi_cation <strong>of</strong> the scatter in high cycle fatigue from temperature measurements, C.<br />
R. Mecanique 332 (2004) 795-801.<br />
[10] E. Charkaluk, A. Constantinescu, Estimation <strong>of</strong> the mesoscopic thermoplastic dissipation in high-cycle fatigue, C. R. Mecanique 334<br />
(2006) 373-379.<br />
[11] J. Charles, F. Appl, J. Francis, Using the scanning infrared camera in experimental fatigue studies, Experimental Mechanics 15 (1975)<br />
133-138.<br />
[12] H. Sawadogo, Comportement en fatigue des <strong>composite</strong>s monolithiques et sandwiches: d_etection et suivi de l'endommagement par<br />
techniques non destructives, Ph.D. thesis, Université de Lille 1 (2009).<br />
171
<strong>Fatigue</strong>-driven Residual Life Models Based on Controlling<br />
<strong>Fatigue</strong> Stress and Strain in Carbon Fibre/Epoxy Composites<br />
Abstract<br />
J J Xiong *, J B Bai, R A Shenoi<br />
Aircraft Department, Beihang University, Beijing, 100083, People’s Republic <strong>of</strong> China<br />
Two novel fatigue-driven models based on controlling fatigue stress and strain with four parameters are derived to<br />
evaluate fatigue residual life easily and expediently from the small sample test data for reliability-based design. The<br />
random model for fatigue-driven residual life is obtained by means <strong>of</strong> the randomized approach to a deterministic<br />
equation and the parameter determination formulae <strong>of</strong> models are respectively established to deal with the test data<br />
effectively and easily based on the maximum likelihood principle and the minimum residual sum <strong>of</strong> squares. In addition,<br />
the probability distributions for these two models are also given. Finally, the models are applied to two sets <strong>of</strong><br />
experimental data, demonstrating the practical and effective use <strong>of</strong> the proposed models. It is shown from these examples<br />
that the models can logically characterize the physical characteristics and the phenomenological quantitative laws and the<br />
parameters <strong>of</strong> model can be estimated more easily and expediently, as well as fatigue-driven residual life can be obtained<br />
realistically according to the small sample test data using the new formulae.<br />
Key words: <strong>composite</strong>s; fatigue; residual life; reliability; stress; strain<br />
1. Introduction<br />
Static and fatigue <strong>behaviour</strong> <strong>of</strong> high performance <strong>composite</strong>s has been investigated extensively.<br />
Comprehensive reviews <strong>of</strong> the subject have been conducted by Reifsnider<br />
1 , Talreja<br />
2 and Shenoi<br />
The static tensile strength <strong>of</strong> <strong>composite</strong>s is governed largely by the fibre strength but this cannot readily<br />
be expressed in a simple way because <strong>of</strong> the statistical nature <strong>of</strong> the fibre fracture and owing to the role<br />
<strong>of</strong> the matrix and/or interface during fracture. To cause overall <strong>composite</strong> failure it is generally accepted<br />
that there needs to be a critical cluster <strong>of</strong> fibre breaks adjacent to one another to trigger a catastrophic<br />
<br />
fracture 4 . The formation <strong>of</strong> such a cluster is dependent on the statistical distribution <strong>of</strong> the fibre<br />
strengths and the local stress transfer in the vicinity <strong>of</strong> a fibre break, which in turn is influenced by the<br />
fibre-matrix interface. The compression strength <strong>of</strong> the <strong>composite</strong>, on the other hand, is related to the<br />
ability <strong>of</strong> the matrix to support the fibre against buckling and the integrity <strong>of</strong> the fibre-matrix interface.<br />
<br />
Soutis et al 5 report compression strength data for high-strength and intermediate modulus fibres in<br />
epoxy resins <strong>of</strong> low to moderate toughness.<br />
During cyclic <strong>loading</strong> <strong>of</strong> notched laminates (below the static strength), the initial damage which<br />
develops at the notch is similar to that seen <strong>under</strong> quasistatic <strong>loading</strong>. This effectively leads to an<br />
* Corresponding author.<br />
E-mail address: jjxiong@buaa.edu.cn<br />
3 .
<strong>Fatigue</strong>-driven Residual Life Models Based on Controlling <strong>Fatigue</strong> Stress and Strain in Carbon Fibre/Epoxy Composites<br />
increase in residual strength with cycling, in particular <strong>under</strong> tension-tension <strong>loading</strong>. Under<br />
compression <strong>loading</strong>, the situation may be similar, with the residual strength generally increasing with<br />
cycling as a result <strong>of</strong> the damage growth and an associated reduction in stress concentration associated<br />
with the discontinuity. Situations in which fatigue failure <strong>of</strong> the notched laminates can occur are for the<br />
lay-ups where the progressive delamination growth in fatigue leads to a progressively greater instability<br />
<strong>of</strong> the load-carrying<br />
<br />
0 plies or ply blocks. This is most likely to be an issue <strong>under</strong><br />
<br />
tension-compression <strong>loading</strong>. Wang et al. 6 studied notch fatigue strengthening <strong>under</strong> different cyclic<br />
<br />
stress levels and elapsed number <strong>of</strong> cycles in [0/90]4S AS4/PEEK laminates. Nuismer et al. 7 studied<br />
uniaxial failure <strong>of</strong> <strong>composite</strong> laminates containing stress concentrations. The relationships between the<br />
<br />
residual strength, fatigue cycles and stress concentration were given. Xiong, Shenoi et al. 8 have<br />
<strong>under</strong>taken experimental investigations <strong>of</strong> the static and fatigue strength <strong>of</strong> T300/QY8911 carbon fibre<br />
reinforced <strong>composite</strong> laminates. It is observed that all tension-tension fatigue damage patterns <strong>of</strong><br />
notched laminates are similar while the tension-tension fatigue properties vary with the laminate lay-up.<br />
The reduction <strong>of</strong> the stress concentration caused by the tension-tension fatigue damage leads to an<br />
improvement in the residual strength <strong>of</strong> the notched specimens in contrast to their static strength<br />
properties. The damage mechanics <strong>of</strong> notched laminates <strong>under</strong> compression-compression <strong>loading</strong> are<br />
more complex than those <strong>of</strong> tension-tension fatigue specimens; their damage patterns are influenced by<br />
the test clamping fixture, the layup, the size <strong>of</strong> specimens and the diameter <strong>of</strong> hole. The residual<br />
strengths are lower than those <strong>of</strong> the specimens without the fatigue damage. <strong>Fatigue</strong> strength <strong>of</strong><br />
<br />
<strong>composite</strong>s has been proved to be related to stress ratio (R). Harris et al 9 have studied the fatigue<br />
<strong>behaviour</strong> <strong>of</strong> a number <strong>of</strong> carbon-fibre-reinforced plastics (CFRP) laminates <strong>of</strong> HTA/913, HTA/982A,<br />
T800/5245 and T800/924. Replicate stress/life data were obtained at four stress ratios (R) <strong>of</strong> +0.1, -0.3,<br />
-1.5 and +10 on virgin samples and on damaged samples. The fatigue <strong>behaviour</strong> <strong>of</strong> a series <strong>of</strong><br />
unidirectional hybrid <strong>composite</strong>s has been established as a function <strong>of</strong> composition and <strong>of</strong> the stress<br />
ratio in repeated tension and tension/compression cycling.<br />
Under compression, as in the static case, fatigue <strong>behaviour</strong> is more dependent on the matrix and<br />
interfacial characteristics than the fibre strength. For [0/90/0] cross ply and [0/90/±45] quasi-isotropic<br />
laminates, damage is <strong>of</strong> four main types: matrix cracking, delamination in [0/90/±45] laminates,<br />
fibre/matrix debonding and 0 <br />
fibre breakage 2 . Because <strong>of</strong> this variety <strong>of</strong> fatigue mechanisms<br />
closely related to anisotropy, including various mechanisms such as the interfacial debonding, matrix<br />
cracking, ply cracking, fiber breakage, and so on, it is difficult to define <strong>composite</strong> damage in a unique<br />
manner. Consequently, a variety <strong>of</strong> fatigue damage modelling techniques have been proposed that<br />
involve stiffness degradation, residual strength, crack density, crack length, etc, with the fatigue damage<br />
definition functions being dependent on the number <strong>of</strong> cycles and on material characteristic<br />
<br />
variables 10 . While the origins <strong>of</strong> the damage modelling trends were linear, many researches have<br />
proposed non-linear quadratic functions to account for the inherent complexities in <strong>composite</strong> <strong>behaviour</strong>.<br />
Based on the damage variables mentioned above, various theoretical, experimental and computational<br />
criteria have been proposed to estimate the overall life <strong>of</strong> a <strong>composite</strong> structure. Most <strong>of</strong> the damage<br />
173
174<br />
Fifth International Conference on <strong>Fatigue</strong> <strong>of</strong> Composites<br />
criteria are functions <strong>of</strong> the material characteristic variables; damage criteria based on the physical<br />
11 14<br />
characteristic <strong>of</strong> the materials have proved to be more promising -<br />
. It is specially emphasized that<br />
the damage criteria based on residual strength, stiffness and strain have been extensively developed and<br />
widely applied. Because <strong>of</strong> the simplicity and wide technological usage <strong>of</strong> the well-known<br />
Palmgren-Miner or Paris-Erdogan laws, very precise, experimentally-based, deterministic, linear<br />
residual strength or stiffness degradation models have been proposed to predict fatigue life <strong>of</strong> different<br />
laminates from the assumption that the matrix is the weak link <strong>of</strong> the system.<br />
In recent years, continuum damage mechanics has been applied to investigate the mechanics behavior<br />
<strong>of</strong> the anisotropic <strong>composite</strong>s with multifarious failure modes. In the meso-scale, taking the s<strong>of</strong>tening<br />
effect <strong>of</strong> material into account, continuum damage mechanics introduces internal damage variables to<br />
denote the formation and growth <strong>of</strong> micro-cracks and micro-excavations which result in strength and<br />
stiffness degradation <strong>of</strong> material in macro-scale. Jessen and Plumtree 15 derived a damage evolution<br />
equation for glass fibre <strong>composite</strong>s pultrusions and the damage S-N curve based on continuum damage<br />
<br />
principle. Shen et al. 16 <br />
, Chow and Wang 17 <br />
, Xiong and Shenoi 18 obtained the elastic damage<br />
constitutive relation for <strong>composite</strong> laminates by means <strong>of</strong> continuum damage mechanics. Phillips and<br />
<br />
Shenoi 19,20 applied damage mechanics to predict fatigue life <strong>of</strong> structural components such as tee<br />
connection and top hat stiffness.<br />
It is interesting in the above reviews to note that a large number <strong>of</strong> researches are grouped according<br />
to some important issues such as static tensile and compressive strength <strong>behaviour</strong>, tension-tension and<br />
compression-compression fatigue <strong>behaviour</strong> including the influence <strong>of</strong> the stress ratio on fatigue<br />
<strong>behaviour</strong>, damage mechanisms, and damage models. It is also clear that there is a need for a more<br />
practical and expedient model for structural applications, particularly in the aerospace field. In this<br />
paper an attempt is made to develop techniques for modelling the stress- and strain-based residual lives,<br />
to characterise long-term cyclic <strong>behaviour</strong> and to identify the governing parameters, all to be based on<br />
fundamental static and fatigue experimental data.<br />
2 <strong>Fatigue</strong>-driven residual life models based on controlling fatigue stress and strain<br />
<br />
A fatigue damage function is usually proposed as follows 1,2,21 :<br />
( , , , ,<br />
, , )<br />
D = D n r S T M (1)<br />
where D is the damage function, n is the number <strong>of</strong> cyclic <strong>loading</strong>, r is the stress ratio, S is the<br />
maximum cyclic stress, is the <strong>loading</strong> frequency, T is the current temperature and M is the<br />
moisture level. Since the temperature T and moisture level M <strong>of</strong> the specimen are constants or<br />
close to constants (by means <strong>of</strong> controlling the temperature and moisture rise) during the test. A<br />
degenerated form <strong>of</strong> Equation (1) is also sometimes represented as:<br />
( , , , )<br />
D = D n r S <br />
(2)<br />
The level <strong>of</strong> damage can be characterized by residual strength <strong>of</strong> the specimen or structure, which<br />
represents the material strength, usually decreasing with increasing numbers <strong>of</strong> cycles. In a virgin state,
<strong>Fatigue</strong>-driven Residual Life Models Based on Controlling <strong>Fatigue</strong> Stress and Strain in Carbon Fibre/Epoxy Composites<br />
the residual strength equals the static strength; <strong>under</strong> fatigue <strong>loading</strong> conditions, the residual strength is<br />
equal to the maximum static stress to cause ultimate failure in the post fatigue condition. Thus, the<br />
change in residual strength can be regarded as the damage variable. Based on the assumption that the<br />
slope <strong>of</strong> the residual strength R ( n)<br />
is inversely proportional to some power b -1<br />
<strong>of</strong> the residual<br />
<br />
strength R ( n)<br />
itself, a rate equation was obtained as 11 :<br />
( ) ( , , )<br />
b-1<br />
( )<br />
dR n f r S<br />
=- (3)<br />
dn R n<br />
Here f ( r, S, ) is a function <strong>of</strong> r , S and . In case <strong>of</strong> without consideration <strong>of</strong> <strong>loading</strong> sequence<br />
effect and the change in local stress with damage evolution. Taking the integral <strong>of</strong> Equation (3) gives:<br />
( , , )<br />
( )<br />
n = f r S R -Rn<br />
175<br />
b<br />
0 <br />
(4)<br />
where R 0 is the ultimate strength. Equation (4) describes the strength degradation <strong>of</strong> a sample<br />
subjected to constant amplitude, constant frequency cyclic <strong>loading</strong>. For the sake <strong>of</strong> simplicity, the<br />
<strong>loading</strong> frequency and the stress ratio r will be fixed, so f ( r, S, ) = f ( S)<br />
. Thus:<br />
( ) ( )<br />
b<br />
0 <br />
(5)<br />
n = f S R -Rn<br />
Equation (3) is a surface equation corresponding to residual strength R , fatigue stress S and<br />
<br />
number <strong>of</strong> fatigue stress cycle n . On the basis <strong>of</strong> the S-N curve equation 22 given as:<br />
( )<br />
0<br />
m<br />
N = C S - S<br />
(6)<br />
where C is the material constant, m is the exponent constant <strong>of</strong> material, S is the fatigue strength<br />
and S0 is the fitting fatigue limit, or reference fatigue strength, one can obtain f ( S ) <strong>of</strong> Equation (6)<br />
as:<br />
Substituting Equation (7) into Equation (3) yields:<br />
( ) ( )<br />
0<br />
m<br />
f S = C S - S<br />
(7)<br />
m<br />
( ) ( )<br />
b<br />
n = C S - S0 R0 - R n <br />
(8)<br />
For a given failure state, namely fatigue residual strength R ( n)<br />
is given to be a certain <strong>of</strong> value<br />
R f , Equation (8) becomes S n<br />
b<br />
- curve as n = C ( S - S ) R- R = C ( S - S )<br />
m m<br />
0 0 f 0 0<br />
consistent with<br />
S - N curve (6) used in fatigue. In the case <strong>of</strong> given <strong>loading</strong> stress S = s0,<br />
Equation (8) degenerates<br />
to the R - n curve as ( ) ( ) b<br />
m<br />
n C s - S R - R n = C R - R , which describes the<br />
( ) b<br />
= 0 0 0<br />
0 0<br />
phenomenological, monotonically quantitatively decreasing law <strong>of</strong> fatigue residual strength shown in<br />
the experiments.<br />
The ultimate strength R 0 and residual strength R ( n)<br />
are obtained respectively:<br />
R0= E0 f<br />
(9)<br />
R( n) = E( n) f<br />
(10)
176<br />
where f is the rupture strain, 0<br />
Fifth International Conference on <strong>Fatigue</strong> <strong>of</strong> Composites<br />
Substituting Equations (9) and (10) into Equation (8), one has:<br />
where<br />
b<br />
C0 C<br />
f<br />
E is the initial modulus and E ( n)<br />
is the residual modulus.<br />
m<br />
( ) ( )<br />
b<br />
n = C0 S - S0 E0-En (11)<br />
= . Equation (11) describes the relationship between fatigue stress S , residual<br />
modulus E ( n)<br />
and cyclic <strong>loading</strong> number n . At a specific fatigue stress S , the relationship between<br />
residual modulus R ( n)<br />
and fatigue strain ( n)<br />
after n fatigue <strong>loading</strong> cycles becomes:<br />
S<br />
E( n)<br />
= (12)<br />
<br />
( n)<br />
Substituting Equation (12) into Equation (11), it is possible to have:<br />
m S <br />
n = C0 ( S - S0 ) E0- ( n)<br />
<br />
Equation (13) is the fatigue model based on controlling-strain to depict the relationship between fatigue<br />
stress S , fatigue strain ( n)<br />
and cyclic <strong>loading</strong> number n .<br />
3. Parameter determination <strong>of</strong> fatigue-driven residual life model<br />
<br />
From the randomized approach <strong>of</strong> deterministic equation 23 , a randomization <strong>of</strong> Equation (8) gives:<br />
m<br />
b<br />
( ) ( ) ( )<br />
n = C S - S0 R0 - R n X n<br />
(14)<br />
where X ( n)<br />
usually is a log-Gauss stochastic process dependent on n , with 0 mean and constant <br />
standard deviation. The logarithmic form <strong>of</strong> Equation (14) is:<br />
where Y = lg n , a = lg C<br />
b<br />
(13)<br />
Y = a0 + a1x1 + a2x2 + U<br />
(15)<br />
0 , a 1 = m , a 2 = b , x1 = lg(<br />
S - S0)<br />
, x R - R(<br />
n)<br />
<br />
2<br />
U = lg X(<br />
n)<br />
. U is the random variable following a Gauss distribution 0, <br />
2 = lg 0 ,<br />
N . From Equation<br />
(15), the random variable Y follows Gauss distribution N a + a x<br />
2<br />
+ a x , .<br />
According to the<br />
maximum likelihood principle, it can be shown that:<br />
where<br />
=<br />
0<br />
1<br />
1<br />
a0 = y -a0 -a1 x1 - a2x2 (16)<br />
L L - L L<br />
a1<br />
=<br />
L L - L L<br />
a<br />
l<br />
2<br />
12 20 22 10<br />
12 21 11 22<br />
L L - L L<br />
=<br />
L L - L L<br />
21 10 11 20<br />
12 21 11 22<br />
( ) 2<br />
yi - a0 - a1x1 i - a2x2 i<br />
i=<br />
1<br />
l<br />
2<br />
2<br />
(17)<br />
(18)<br />
(19)
<strong>Fatigue</strong>-driven Residual Life Models Based on Controlling <strong>Fatigue</strong> Stress and Strain in Carbon Fibre/Epoxy Composites<br />
L<br />
12<br />
L<br />
L<br />
10<br />
20<br />
L<br />
L<br />
=<br />
11<br />
22<br />
=<br />
=<br />
1 l<br />
y = yi<br />
l i=<br />
1<br />
1 l<br />
x = x<br />
1 1i<br />
l i=<br />
1<br />
1 l<br />
x = x<br />
=<br />
=<br />
l<br />
<br />
i=<br />
1<br />
l<br />
<br />
i=<br />
1<br />
l<br />
<br />
i=<br />
1<br />
2 2i<br />
l i=<br />
1<br />
l<br />
<br />
i=<br />
1<br />
l<br />
<br />
i=<br />
1<br />
( x - x )<br />
1i<br />
1<br />
2<br />
( x - x )<br />
2i<br />
( x - x )( x - x )<br />
1i<br />
21<br />
1<br />
L = L<br />
12<br />
2<br />
2i<br />
( x - x )( y - y)<br />
1i<br />
1<br />
( x - x )( y - y)<br />
2i<br />
Eqns. (16) to (18) are functions <strong>of</strong> constants R 0 and S 0 . The constants R 0 and S 0 can be<br />
determined by means <strong>of</strong> the minimum value principle <strong>of</strong> the residual sum <strong>of</strong> squares (RSS) Q( R , S )<br />
in Equation (15) in a four-stage process.<br />
(a) First, letting the residual sum <strong>of</strong> squares (RSS) as:<br />
l<br />
0 0 i 1 2 1i 3 2i<br />
i=<br />
1<br />
(b) Then, the value ranges <strong>of</strong> R 0 and S 0 are estimated as:<br />
2<br />
i<br />
i<br />
2<br />
2<br />
0 0<br />
( ) ( ) 2<br />
Q R , S = y - a - a x - a x<br />
(20)<br />
where R<br />
R0 ( Rmax<br />
, Rmax<br />
+ <br />
S0 0,<br />
S0<br />
min )<br />
= maxR<br />
, R , ,<br />
R ,<br />
is a finite value, , ( i 1,<br />
2,<br />
,<br />
l)<br />
max<br />
residual strength, S S S S <br />
1<br />
2<br />
0min 1 2<br />
l<br />
R i<br />
177<br />
= is the test data <strong>of</strong><br />
= min , , , l , and Si , ( i = 1,2, , l)<br />
is the fatigue stress.<br />
(c) Subsequently, for given initial values <strong>of</strong> R0 ˆ , S0 ˆ and calculation step lengths 1 , 2 , one can<br />
search and find out the value <strong>of</strong> ( , )<br />
Q R0 S 0 by changing the values <strong>of</strong> R 0 and 0<br />
S during the<br />
above value ranges respectively,. Thus R 0 and S 0 pertaining to the minimum value <strong>of</strong><br />
( , )<br />
Q R S may be determined.<br />
0 0<br />
(d) Finally, the parameters a 0 , 1 a and 2<br />
a can be determined from Eqns. (16) to (18).
178<br />
Fifth International Conference on <strong>Fatigue</strong> <strong>of</strong> Composites<br />
C = 10<br />
L<br />
m =<br />
L<br />
12<br />
12<br />
( y-a<br />
x -a<br />
x )<br />
L<br />
L<br />
20<br />
21<br />
1 1<br />
- L<br />
- L<br />
2 2<br />
22<br />
11<br />
L L - L L<br />
b =<br />
L L - L L<br />
21 10 11 20<br />
12 21 11 22<br />
By invoking the procedures <strong>of</strong> equations (16) to (20), one can obtain the undetermined constants E 0 ,<br />
S 0 , C 0 , m , b and in Equation (13).<br />
4. Reliability prediction for fatigue-driven residual life<br />
In case there are a large number <strong>of</strong> test data <strong>of</strong> ultimate strength R 0 , the probability models <strong>of</strong><br />
residual strength based on controlling-stress can be obtained from the PDF <strong>of</strong> ultimate strength R 0 .<br />
According to Equation (5), one can have:<br />
L<br />
L<br />
10<br />
22<br />
n <br />
R( n) = R0<br />
- <br />
f ( S)<br />
<br />
<br />
Generally, the ultimate strength R 0 follows the two-parameter Weibull distribution 11 and its<br />
distribution function is:<br />
( ) = = - -(<br />
)<br />
FR0 x P R0 x 1 exp <br />
<br />
x<br />
<br />
<br />
<br />
(22)<br />
Substituting for R 0 , the probability distribution function <strong>of</strong> residual fatigue strength R ( n)<br />
at a given<br />
fatigue stress S and fatigue stress cycles n is<br />
1<br />
<br />
b n <br />
FRn ( ) ( x) = P R( n) x P<br />
<br />
R0 x<br />
<br />
=<br />
<br />
- <br />
f ( S)<br />
<br />
<br />
<br />
<br />
1<br />
<br />
<br />
b<br />
1<br />
n <br />
x<br />
<br />
b n<br />
<br />
+ <br />
f ( S)<br />
<br />
<br />
F ( ) ( x) = P R0 x<br />
1 exp<br />
<br />
Rn + = - - <br />
f ( S)<br />
<br />
<br />
<br />
<br />
<br />
<br />
From Equation (24), it is clear that residual strength R ( n)<br />
follows a three-parameter Weibull<br />
distribution. Based on Equation (21), the residual strength Rp ( n)<br />
corresponding to a reliability level<br />
p is:<br />
1<br />
b<br />
n <br />
Rp( n) = R0<br />
p - <br />
f ( S)<br />
<br />
1<br />
b<br />
(21)<br />
(23)<br />
(24)<br />
(25)
<strong>Fatigue</strong>-driven Residual Life Models Based on Controlling <strong>Fatigue</strong> Stress and Strain in Carbon Fibre/Epoxy Composites<br />
Substituting Equation (7) into Eqns. (24) and (25) gives:<br />
1<br />
<br />
<br />
b<br />
n <br />
x+ m <br />
C( S - S0<br />
) <br />
F ( ) ( x) = P R( n) x = 1- exp -<br />
<br />
Rn <br />
<br />
<br />
<br />
<br />
<br />
n <br />
R n = R - <br />
( )<br />
( - )<br />
p 0 p m<br />
CSS0 Assuming fatigue failure occurs when the residual strength R ( n)<br />
equals the maximum cyclic stress<br />
S , or R ( n)<br />
= S , at the same time, n = N , then a transformation <strong>of</strong> Equation (8) gives:<br />
( )( )<br />
0<br />
b<br />
1<br />
b<br />
179<br />
(26)<br />
(27)<br />
N = f S R - S<br />
(28)<br />
Since the ultimate strength R 0 is a variable and follows Equation (22), fatigue life N also is a<br />
variable and follows:<br />
N<br />
( ) ( )( )<br />
F n = P N n = P fSR-Sn b<br />
0 (29)<br />
1<br />
1 1<br />
<br />
b<br />
b b<br />
n n+ S f ( S ) <br />
FN ( n) = P R0 + S = 1- exp - 1<br />
f ( S)<br />
<br />
<br />
b f ( S)<br />
<br />
<br />
Equation (30) shows that fatigue life N follows a three-parameter Weibull distribution. When<br />
( ) ( ) m<br />
S C S - S<br />
f 0<br />
= , Equation (30) becomes:<br />
5. Examples and discussion<br />
1 1 m <br />
b b<br />
( 0 ) b<br />
n+ C S S - S <br />
FN ( n) = P N n<br />
= 1- exp - 1<br />
m <br />
b C( S -S0)<br />
b <br />
<br />
Example 5.1 37 specimens was cut from ( 0, 90,<br />
45)<br />
s Graphite/Epoxy laminate panel. 12<br />
specimens were tested statically and their ultimate strengths are shown in Table 1 and Figure 1. 25<br />
specimens were subjected to fatigue <strong>loading</strong> at various maximum stress levels s and the results are<br />
tabulated in Table 2 and shown in Figure 1. One specimen did not fail at one million cycles and its<br />
residual strength was measured.. The fatigue tests were then stopped and the residual strengths were<br />
measured. All the fatigue tests were performed at a frequency <strong>of</strong> 20Hz with a stress ratio 0.1.<br />
<br />
<br />
(30)<br />
(31)
180<br />
Fifth International Conference on <strong>Fatigue</strong> <strong>of</strong> Composites<br />
<br />
Table 1. Ultimate strength <strong>of</strong> G/E [0,90,±45]S (unit: MPa) 11<br />
435.49 500.82 552.03<br />
457.28 517.53 560.80<br />
495.81 536.12 563.68<br />
498.73 540.05 580.31<br />
<br />
Table 2. <strong>Fatigue</strong> residual strength 11 data <strong>of</strong> G/E [0,90,±45]S<br />
S / MPa n / cycles R(n) / MPa S / MPa n / cycles R(n) / MPa<br />
441.90 1650 441.90 363.92 18790 363.92<br />
441.90 1950 441.90 363.92 3840 363.92<br />
441.90 1320 441.90 348.32 161000 348.32<br />
415.91 2050 415.91 348.32 110000 348.32<br />
389.92 50980 389.92 337.93 523500 337.93<br />
389.92 6480 389.92 337.93 863200 337.93<br />
363.92 155000 363.92 322.33 1346300 322.33<br />
363.92 228500 363.92 337.93 1007000 337.93<br />
363.92 88000 363.92 376.92 30000 376.92<br />
363.92 117580 363.92 376.92 30000 376.92<br />
363.92 228700 363.92 376.92 30000 376.92<br />
363.92 221200 363.92 376.92 30000 376.92<br />
363.92 310000 363.92<br />
Fig. 1. <strong>Fatigue</strong> residual life curves.<br />
From the test data shown in Tables 1 and 2, using the model in Equation (8) and its parameter<br />
estimation method presented above, the fatigue residual strength surface equation is determined as:<br />
65 -24.56<br />
n = 4.2110 S 519.89 - R n<br />
( ) 0.97<br />
<br />
(32)
<strong>Fatigue</strong>-driven Residual Life Models Based on Controlling <strong>Fatigue</strong> Stress and Strain in Carbon Fibre/Epoxy Composites<br />
From the data shown in Table 1, it can be shown that the percentile value pertinent to the probability <strong>of</strong><br />
survival <strong>of</strong> 99.9% is 299.31 MPa. Based on Equation (27), fatigue residual strength surface equation<br />
with the probability <strong>of</strong> survival <strong>of</strong> 99.9% is:<br />
65 -24.56<br />
n = 4.2110 S 299.31-<br />
R n<br />
If S=363.92 MPa, Eqns. (32) and (33) became respectively as:<br />
( ) 0.97<br />
181<br />
<br />
(33)<br />
( ) 0.97<br />
n = 522.88 519.89-Rn (34)<br />
( ) 0.97<br />
n = 522.88 299.31-Rn (35)<br />
Using Equation (34), the mean value <strong>of</strong> the fatigue <strong>loading</strong> cycle at a residual strength, R = 363. 92<br />
MPa is 70102 cycles. From the experimental data shown in Table 2, the mean value <strong>of</strong> fatigue <strong>loading</strong><br />
cycle at the residual strength <strong>of</strong> R = 363. 92 MPa is 152401 cycles. The relative deviation <strong>of</strong><br />
prediction from the experimental result is:<br />
152401- 70102<br />
100% = 54%<br />
152401<br />
If S=337.93 MPa, Eqns. (32) and (33) became respectively as<br />
( ) 0.97<br />
n = 3228.11 519.89-Rn (36)<br />
( ) 0.97<br />
n = 3228.11 299.31-Rn (37)<br />
Using Equation (36), the mean value <strong>of</strong> fatigue <strong>loading</strong> cycle at the residual strength <strong>of</strong> R = 363. 92<br />
MPa is 502594 cycles. From the experimental data shown in Table 2, the mean value <strong>of</strong> fatigue <strong>loading</strong><br />
cycle at the residual strength <strong>of</strong> R = 363. 92 MPa is 797900 cycles. The relative deviation <strong>of</strong><br />
prediction from experimental result is<br />
797900 - 502594<br />
100% = 37%<br />
797900<br />
Equations (34) and (36) are shown in Figure 1. From Figure 1, it is seen that the calculated curves are<br />
consistent with the experimental data. From an accuracy check <strong>of</strong> the analysis results, the relative<br />
deviations <strong>of</strong> predicted results from experimental data at S=363.92 MPa and S=337.93 MPa are 54%<br />
and 37% respectively, with the acceptable scatter. One reason for the deviation <strong>of</strong> the model results from<br />
the experimental data is the small sample size <strong>of</strong> the test data. It is well known that fatigue lives <strong>of</strong><br />
<strong>composite</strong> laminates are <strong>of</strong>ten very scattered. For this reason, generally, many sets <strong>of</strong> large sample<br />
experiments are conducted to obtain the population law and the analysis results with high reliability<br />
levels. In this case, reasonable constraints limited the experimental results that were feasible and<br />
permissible. If more specimens are used for fatigue tests at each stress level and more stress levels are<br />
considered, then more exact fatigue performance can be determined and more accurate calculated<br />
results can be obtained. An expression in the form <strong>of</strong> a power function product is adopted in Equation (8)<br />
to more easily and expediently estimate the parameters <strong>of</strong> this model, and there exist four parameters in<br />
this model to fit more adequately the experimental phenomenological quantitative laws.<br />
It is worth noting that Equation (8) can characterize fatigue residual strength properties; S and
182<br />
Fifth International Conference on <strong>Fatigue</strong> <strong>of</strong> Composites<br />
R ( n)<br />
in this model are expressed in the form <strong>of</strong> constant amplitude nominal stress, so the <strong>loading</strong><br />
sequence effect and the change in local stress with damage evolution have not been taken into account.<br />
Example 5.2 A 20-ply T300/QY8911 plate was manufactured with a layup <strong>of</strong><br />
<br />
- - and having a mean modulus E 0 <strong>of</strong> 54.34 GPa. Test-specimens<br />
45/ 0 2 / 45/ 90 2 / 45/ 0 / 45/ 90 s<br />
were cut from this plate for a scenes <strong>of</strong> static and fatigue tests. The geometry and dimensions <strong>of</strong> the<br />
specimens are shown in Figure 2. The four variables in the tension case are the dimensions <strong>of</strong> the central<br />
holes (10.00 mm), the thickness t (2.4mm), the width W (50mm) and the length L (300 mm).<br />
10 specimens were tested statically and the mean value <strong>of</strong> their fracture strains is 5286 . 11<br />
specimens were subjected to tension-tension fatigue <strong>loading</strong> at various maximum stress levels s and<br />
the results are tabulated in Table 3. The fatigue tests were performed in a frequency range <strong>of</strong> 10-15Hz<br />
with a stress ratio <strong>of</strong> 0.1.<br />
Nominal stress<br />
S / MPa<br />
285<br />
304<br />
320<br />
340<br />
Fig. 2. Notched specimen for static tension and tension-tension fatigue tests.<br />
Table 3. Strains at the hole-site <strong>of</strong> notched laminates <strong>under</strong> tension-tension fatigue <strong>loading</strong> (unit: με)<br />
Stress cycles n / cycles<br />
1 0.25×10 6 0.5×10 6 0.75×10 6 1.0×10 6<br />
4350<br />
4460<br />
4490<br />
4650<br />
4620<br />
4510<br />
4930<br />
4860<br />
4970<br />
5400<br />
5320<br />
4380<br />
4500<br />
4680<br />
4560<br />
5180<br />
4420<br />
4520<br />
4730<br />
4620<br />
5270<br />
5210<br />
n = 1×10 6 , ε = 5780; n = 2.2×10 6 , ε = 5960<br />
n = 1×10 6 , ε = 5630; n = 3.2×10 6 , ε = 6030<br />
4470<br />
4570<br />
4800<br />
4670<br />
5310<br />
4550<br />
4670<br />
4760<br />
4970<br />
4920<br />
4730<br />
5350<br />
5290<br />
5400<br />
From the test data shown in Table 3, by invoking Equations (16) to (20) and the procedures served from<br />
those, one can obtain the undetermined constants E 0 , S 0 , C 0 , m and b in Equation (13). The<br />
controlling-strain fatigue residual strength model is then determined as:<br />
- <br />
n= S -<br />
<br />
<br />
30 19.55<br />
8.75 10 54340.0 S<br />
From Equation (38), it is found that if S = 285MPa , then:<br />
n<br />
- 285.0<br />
<br />
<br />
18<br />
= 9.1210 54340.0 -<br />
6.20<br />
6.20<br />
(38)<br />
(39)
<strong>Fatigue</strong>-driven Residual Life Models Based on Controlling <strong>Fatigue</strong> Stress and Strain in Carbon Fibre/Epoxy Composites<br />
If S = 304MPa , then:<br />
If S = 320MPa , then:<br />
If S = 340MPa , then:<br />
n<br />
n<br />
n<br />
- 304.0 <br />
<br />
<br />
18<br />
= 2.5810 54340.0 -<br />
- 320.0 <br />
<br />
<br />
19<br />
= 9.4810 54340.0 -<br />
- 340.0 <br />
<br />
<br />
19<br />
= 2.9010 54340.0 -<br />
Equations (38) to (42) are shown in Figures 3a to 3d. One can see that there is good agreement<br />
between the experimental data and the predicted curves; thus it is argued that the residual fatigue<br />
strength model <strong>of</strong> Equation (13) has adequately and logically characterized the physical characteristics<br />
and the phenomenological quantitative laws.<br />
(a) S = 285MPa<br />
(b) S = 304MPa<br />
6.20<br />
6.20<br />
6.20<br />
183<br />
(40)<br />
(41)<br />
(42)
184<br />
6. Conclusions<br />
Fifth International Conference on <strong>Fatigue</strong> <strong>of</strong> Composites<br />
(c) S = 320MPa<br />
(d) S = 340MPa<br />
Fig. 3. <strong>Fatigue</strong> experimental data and the fitting strain-life curve for laminate [45/02/-45/902/-45/0/45/90]S <strong>of</strong> T300/QY8911.<br />
The focus <strong>of</strong> this paper has been to present two new practical models for predicting fatigue residual<br />
lives. The parameter estimation formulae <strong>of</strong> both <strong>of</strong> models are established. The applicability <strong>of</strong> the new<br />
models has been shown for two sets <strong>of</strong> experimental results for estimating fatigue residual lives. Close<br />
correlation is achieved between the predictions and the actual experimental results.<br />
Acknowledgement<br />
This project was supported by the National Natural Science Foundation and Aeronautics Science<br />
Foundation <strong>of</strong> China<br />
References<br />
[1] Reifsnider K L. <strong>Fatigue</strong> <strong>of</strong> Composite Materials. Oxford: Elsevier, 1990<br />
[2] Talreja R. <strong>Fatigue</strong> <strong>of</strong> polymer matrix <strong>composite</strong>s. In „Comprehensive <strong>composite</strong> materials (eds. Kelly A. and Zweben C.) (Volume 2):<br />
Polymer Matrix Composites‟, eds. Talreja R. and Manson J. E. Oxford: Elsevier, 2000
<strong>Fatigue</strong>-driven Residual Life Models Based on Controlling <strong>Fatigue</strong> Stress and Strain in Carbon Fibre/Epoxy Composites<br />
[3] Read PJCL, Shenoi RA. A review <strong>of</strong> fatigue damage modelling in context <strong>of</strong> marine FRP laminates. Marine Structures, 1995; 8(1):<br />
257-278<br />
[4] Bader M G. Composites. UK, Oxford: Butterworth Heinemann, 1991<br />
[5] Soutis C, Smith E C, Matthews F L. Predicting the compressive engineering performance <strong>of</strong> carbon fibre-reinforced plastics. Composites<br />
Part A, 2000; 31: 531-536<br />
[6] Wang CM, Shin CS. Residual properties <strong>of</strong> notched [0/90]45AS4/PEEK <strong>composite</strong> laminates after fatigue and re-consolidation.<br />
Composites Part B, 2002; 33: 67-76<br />
[7] Nuismer R. J. and Whitney J.M. Uniaxial failure <strong>of</strong> <strong>composite</strong>s laminates containing stress concentrations. ASTM STP 593, 1975; 117-142<br />
[8] Xiong JJ, Shenoi RA, Wang SP, Wang WB. On Static and <strong>Fatigue</strong> Strength Determination <strong>of</strong> Carbon Fibre/Epoxy Composites. Part I:<br />
Experiments. Journal <strong>of</strong> Strain Analysis for Engineering Design, 2004; 39(5): 529-540<br />
[9] Beheshty M H, Harris B and Adam T. An empirical fatigue-life model for high-performance fibre <strong>composite</strong>s with and without impact<br />
damage. Composites Part A: Applied Science and Manufacturing, 1993; 30(8): 971-987<br />
[10] Kaminski M. On probabilistic fatigue models for <strong>composite</strong> material. International Journal <strong>of</strong> <strong>Fatigue</strong>, 2002; 477-495<br />
[11] Yang JN and Liu MD. Residual strength degradation model and theory <strong>of</strong> periodic pro<strong>of</strong> tests for Graphite/Epoxy laminates. Journal <strong>of</strong><br />
Composite Materials, 1977; 11: 176-203<br />
[12] Xiong JJ, Shenoi RA. Two new practical models for estimating reliability-based fatigue strength <strong>of</strong> <strong>composite</strong>s. Journal <strong>of</strong> Composite<br />
Materials, 2004; 38(14): 1187-1209<br />
[13] Xiong JJ, Shenoi RA, Wang SP, Wang WB. On Static and <strong>Fatigue</strong> Strength Determination <strong>of</strong> Carbon Fibre/Epoxy Composites. Part II:<br />
Theoretical Formulation. Journal <strong>of</strong> Strain Analysis for Engineering Design, 2004; 39(5): 541-548<br />
[14] Xiong JJ, Li YY, Zeng BY. A Strain-based Residual Strength Model <strong>of</strong> Carbon Fibre/Epoxy Composites Based on CAI and <strong>Fatigue</strong><br />
Residual Strength Concepts. Composite Structures, 2008; 85: 29-42<br />
[15] Jessen, S.M. and Plumtree, A. Continuum Damage Mechanics Applied to Cyclic Behavior <strong>of</strong> Glass Fibre Composites Pultrusion.<br />
Composites, 1991; 22: 181-190<br />
[16] Shen, W. Peng, L. Yang, F. and Shen, Z. Generalized Elastic Damage Theory and its Application to Composite Plate. Engineering<br />
Fracture Mechanics, 1987; 28:403-412<br />
[17] Chow C. L. and Wang J. An Anisotropic Theory <strong>of</strong> Elasticity for Continuum Damage Mechanics. International Journal <strong>of</strong> Fracture, 1987;<br />
33: 3-16<br />
[18] Xiong JJ, Shenoi RA. A two-stage theory on fatigue damage and life prediction <strong>of</strong> <strong>composite</strong>s. Composites Science and Technology, 2004;<br />
64(9): 1331-1343<br />
[19] Phillips H.J., Shenoi R.A. Damage Tolerance <strong>of</strong> Laminated Tee Joints in FRP Ship Structures. Composites, 1998; 29A: 465-478<br />
[20] Phillips H.J., Shenoi R.A. Damage Mechanics <strong>of</strong> Top-Hat Stiffeners Used in FRP Ship Construction. Marine Structures, 1999; 12: 1-19<br />
[21] Hwang W, Han KS. Cumulative damage models and multi-stress fatigue life prediction. Journal <strong>of</strong> Composite Material, 1986; 20: 125-153<br />
[22] Weibull W. <strong>Fatigue</strong> testing and analysis <strong>of</strong> results. New York: Macmillan Company, 1961<br />
[23] Xiong JJ, Shenoi RA. A practical randomization approach <strong>of</strong> deterministic equation to determine probabilistic fatigue and fracture<br />
<strong>behaviour</strong>s based on small experimental data sets. International Journal <strong>of</strong> Fracture, 2007; 145: 273-283<br />
185
Prediction <strong>of</strong> transverse crack initiation <strong>of</strong> CFRP laminates<br />
<strong>under</strong> fatigue <strong>loading</strong><br />
Abstract<br />
A Hosoi a, *, K Takamura b , N Sato c , H Kawada d<br />
a Department <strong>of</strong> Mechanical Science and Engineering, Nagoya University<br />
b Graduate School <strong>of</strong> Fundamental Science and Engineering, Waseda University<br />
c Composite Materials Research Laboratories, Toray Industries, Inc.<br />
d Depatment <strong>of</strong> Applied Mechanics and Aerospace Engineering, Waseda University<br />
The method to predict the initiation <strong>of</strong> a transverse crack in carbon fiber reinforced plastic (CFRP) laminates <strong>under</strong><br />
cyclic <strong>loading</strong> was proposed by focusing on the periodicity <strong>of</strong> the transverse crack growth. The number <strong>of</strong> cycles to the<br />
initiation <strong>of</strong> the transverse crack was calculated by using the relationship between the transverse crack growth rate and<br />
the range <strong>of</strong> the energy release rate associated with transverse crack formation, the modified Paris law. The results<br />
obtained by the analysis showed good agreement with the experimental results.<br />
Keywords: transverse crack; fatigue; <strong>composite</strong>; prediction; reliability<br />
1. Introduction<br />
Carbon fiber reinforced plastics (CFRPs) are expected to be a primary structural material replacing<br />
lightweight metallic materials because they have excellent mechanical properties <strong>of</strong> specific strength<br />
and stiffness. On the other hand, the main accident cause <strong>of</strong> machinery and structures in metal materials<br />
is fatigue fracture. Therefore, it is necessary to evaluate properly the fatigue properties <strong>of</strong> CFRP<br />
laminates in order to establish their long-term durability and reliability. When CFRP laminates are<br />
subjected to cyclic <strong>loading</strong>, the damage, such as matrix cracks, delamination and fiber breakage, is<br />
mainly caused. Especially, the transverse cracks caused in 90 plies are generally first damage in CFRP<br />
laminates <strong>under</strong> cyclic <strong>loading</strong>, and they cause more critical damage <strong>of</strong> delamination and fiber breakage.<br />
Thus, it is very important to predict the initiation <strong>of</strong> the transverse crack <strong>under</strong> cyclic <strong>loading</strong>.<br />
Many experimental and analytical studies regarding the formation and propagation <strong>of</strong> transverse<br />
cracks <strong>under</strong> static and fatigue <strong>loading</strong>s have been conducted. Reifsnider and coauthors [1, 2]<br />
researched the cumulative behavior <strong>of</strong> transverse cracks. They showed experimentally that the number<br />
<strong>of</strong> the transverse cracks increased and the density <strong>of</strong> the transverse cracks was saturated finally as cyclic<br />
<strong>loading</strong> was applied. Nairn [3] derived the energy release rate associated with the transverse crack<br />
formation in cross-ply laminates on the basis <strong>of</strong> the stress analysis by a variational approach that Hashin<br />
[4] proposed, and evaluated quantitatively the behavior <strong>of</strong> the transverse crack growth <strong>under</strong> static<br />
tensile <strong>loading</strong>. Moreover, Liu and Nairn [5] applied the analysis to the evaluation <strong>of</strong> fatigue damage<br />
* Corresponding author. Address: Furo-cho, Chikusa-ku, Nagoya 464-8603, Japan. Tel: +81-52-789-4674; fax: +81-52-789-3109.<br />
E-mail address: hosoi@mech.nagoya-u.ac.jp
A Hosoi, K Takamura, N Sato, H Kawada. / Prediction <strong>of</strong> transverse crack initiation <strong>of</strong> CFRP laminates <strong>under</strong> fatigue <strong>loading</strong><br />
growth. Ogi et al. [6] evaluated the behavior <strong>of</strong> transverse crack growth <strong>under</strong> variable amplitude cyclic<br />
<strong>loading</strong>. On the other hand, Tong [7] and Yokozeki et al. [8] evaluated the behavior <strong>of</strong> the transverse<br />
crack propagating to the width direction in quasi-isotropic and cross-ply laminates <strong>under</strong> cyclic <strong>loading</strong>.<br />
Hosoi et al. [9-12] evaluated the behavior <strong>of</strong> transverse crack growth <strong>under</strong> very high-cycle fatigue<br />
<strong>loading</strong> over 10 8 cycles.<br />
The increase and propagation <strong>of</strong> transverse cracks have been widely evaluated by fracture mechanics<br />
methodology. Although the initiation <strong>of</strong> a transverse crack <strong>under</strong> static tensile <strong>loading</strong> was evaluated by<br />
the stress criterion [13], the energy criterion [3] or both [14], it is difficult to predict the initiation <strong>of</strong> a<br />
transverse crack <strong>under</strong> cyclic <strong>loading</strong> because the transverse crack initiates due to the accumulation <strong>of</strong><br />
microscopic damage. Therefore, there are very few studies that the initiation <strong>of</strong> a transverse crack <strong>under</strong><br />
cyclic <strong>loading</strong> was evaluated quantitatively. Takeda et al. [15] proposed that the initiation <strong>of</strong> transverse<br />
crack could be express by the Manson-C<strong>of</strong>fin equation. However, they evaluated the initiation <strong>of</strong><br />
transverse crack by fitting <strong>of</strong> the experimental results. There is no study that the initiation <strong>of</strong> the<br />
transverse crack can be predicted accurately to my knowledge. In this study, the method to predict<br />
quantitatively the initiation <strong>of</strong> a transverse crack was proposed focusing on the periodicity <strong>of</strong> the<br />
transverse crack growth.<br />
2. Experiments<br />
2.1 Specimen<br />
CFRP laminates were made <strong>of</strong> T800H/3631 prepreg whose the fiber volume fraction is 57% and the<br />
cure temperature is 453 K using an autoclave. The stacking sequence <strong>of</strong> the laminates is cross-ply<br />
[0/902]s. Specimen dimensions were decided on the basis <strong>of</strong> ASTM D3039 as shown in Fig. 1. The<br />
thickness <strong>of</strong> the laminate was 0.864 mm. The mechanical properties <strong>of</strong> each specimen are shown in<br />
Table 1. In experiments <strong>of</strong> this study, the results in our previous research [11] were referred.<br />
Fig. 1. Specimen dimensions <strong>of</strong> cross-ply [0/902]s laminates.<br />
Table 1. Mechanical properties <strong>of</strong> cross-ply [0/902]s CFRP laminates<br />
Failure Strength<br />
b [MPa]<br />
Failure Strain<br />
b [%]<br />
Stiffness<br />
E [GPa]<br />
871 1.31 62.3<br />
187
188<br />
Fifth International Conference on <strong>Fatigue</strong> <strong>of</strong> Composites<br />
Table 2. <strong>Fatigue</strong> test conditions <strong>of</strong> cross-ply [0/902]s CFRP laminates<br />
Frequency f Hz 5 100<br />
Applied stress level (max/ti) * 0.60-0.90 0.40-0.50<br />
Stress ratio R 0.1<br />
* ti=871 MPa<br />
2.2 <strong>Fatigue</strong> test conditions<br />
Tensile fatigue tests were conducted at room temperature with a sine waveform <strong>under</strong> load-control<br />
conditions using a hydraulic-driven testing machine. Table 2 shows the fatigue test conditions. The<br />
applied stress level is defined as the maximum applied stress, max, per the stress <strong>of</strong> the transverse crack<br />
initiation <strong>under</strong> static tensile <strong>loading</strong>, ti. The fatigue test <strong>under</strong> a frequency <strong>of</strong> 100 Hz was conducted in<br />
the applied stress level <strong>of</strong> max/ti=0.40-0.50 in order to investigate the fatigue crack growth in high<br />
cycle. It was indicated that the influence <strong>of</strong> the frequency on the fatigue crack growth was small within<br />
the applied stress level <strong>of</strong> max/ti=0.40-0.50 in our previous research [9, 11]. The transverse crack<br />
growth was observed with a microscope and s<strong>of</strong>t X-ray photography [11].<br />
3. Analysis<br />
In this section, the method to predict the number <strong>of</strong> cycles to the transverse crack onset <strong>under</strong> cyclic<br />
<strong>loading</strong> is described. The transverse crack growth <strong>under</strong> fatigue <strong>loading</strong> could be evaluated with the<br />
relationship between the transverse crack growth rate and the range <strong>of</strong> the energy release rate associated<br />
with transverse crack formation as a following equation [5].<br />
dD <br />
= A( ΔG)<br />
(1)<br />
dN<br />
where, D is the transverse crack density that is defined as the number <strong>of</strong> the transverse cracks per the<br />
gauge length, N is the number <strong>of</strong> cycles and G is the energy release rate range associated with<br />
transverse crack formation, G=Gmax-Gmin. A and are the constants obtained by experiments.<br />
Equation (2) shows the energy release rate associated with the formation <strong>of</strong> a new transverse crack<br />
between two existing transverse cracks in cross-ply laminates [3].<br />
ET T<br />
<br />
G = 0 - C3t1Y ( D)<br />
ECC1 where ET and EC show the transverse modulus <strong>of</strong> the ply material and the modulus <strong>of</strong> the cross-ply<br />
laminate, respectively. 0 shows the tensile stress applied in the cross-ply laminate. is the difference<br />
between the transverse and longitudinal thermal expansion coefficients, =T-A. T is the difference<br />
between the specimen temperature and stress free temperature. C1 and C3 are the constants that depend<br />
on the material properties and the ply thickness. t1 is half thickness <strong>of</strong> 90 plies. Y(D) is a calibration<br />
function that depends on the crack density.<br />
In equation (2), it is defined that a new transverse crack is caused between two existing transverse<br />
cracks in the model. Therefore, equation (1) can be rewritten as equation (3) because the transverse<br />
2<br />
(2)
A Hosoi, K Takamura, N Sato, H Kawada. / Prediction <strong>of</strong> transverse crack initiation <strong>of</strong> CFRP laminates <strong>under</strong> fatigue <strong>loading</strong><br />
crack density becomes twice after the formation <strong>of</strong> new transverse crack.<br />
2D<br />
D<br />
N(2 D) N( D)<br />
A ΔG <br />
-<br />
- = (3)<br />
( )<br />
Here, it is though that the transverse crack is formed in the sufficiently-long gauge length comparing the<br />
thickness <strong>of</strong> 90 plies. In the early stage <strong>of</strong> fatigue that the transverse crack density is low, it is assumed<br />
that the mechanism <strong>of</strong> the initiation <strong>of</strong> a transverse crack which was caused from an undamaged state is<br />
similar to the mechanism <strong>of</strong> the formation <strong>of</strong> a transverse crack which was caused between existing two<br />
transverse cracks. On the basis <strong>of</strong> the assumption, the relationship between the transverse crack density<br />
and the number <strong>of</strong> cycles is shown as Fig. 2. The number <strong>of</strong> cycles that the transverse crack initiates, Ni,<br />
in the gauge length, L, is equal to the number <strong>of</strong> cycles that the transverse crack density changes from<br />
1/L to 2/L. Therefore, the number <strong>of</strong> cycles to the transverse crack onset is expressed as<br />
1<br />
Ni N(2 / L) N(1/ L)<br />
LA ΔG <br />
= - = (4)<br />
( )<br />
Fig. 2. The relationship between the transverse crack density and the number <strong>of</strong> cycles on the basis <strong>of</strong> the assumption that the mechanism <strong>of</strong> the<br />
initiation and increase <strong>of</strong> transverse crack is similar.<br />
4. Results<br />
4.1. Behavior <strong>of</strong> transverse crack growth<br />
Figure 3 shows the transverse crack density as a function <strong>of</strong> the number <strong>of</strong> cycles in cross-ply [0/902]s<br />
laminates <strong>under</strong> cyclic <strong>loading</strong> [11]. As the applied stress level becomes lower, the number <strong>of</strong> cycles for<br />
the transverse crack initiation increases and the saturation value <strong>of</strong> the transverse crack density becomes<br />
lower.<br />
4.2 Evaluation by modified Paris law<br />
In order to obtain the modified Paris law constants, A and , in equation (1), the relationship between<br />
the transverse crack growth rate and the energy release rate range was evaluated. It is important to<br />
evaluate accurately the transverse crack growth rate because the transverse crack growth rate changes<br />
depending on the transverse crack density. Figure 4 shows the relationship between the transverse crack<br />
189
190<br />
Fifth International Conference on <strong>Fatigue</strong> <strong>of</strong> Composites<br />
density and the energy release rate range, the solid line, and the relationship between the transverse<br />
crack density and the number <strong>of</strong> cycles, the open symbols, in the case <strong>of</strong> the applied stress level <strong>of</strong><br />
max/ti=0.8. In the former case, the energy release rate range is constant when the transverse crack<br />
density is low. The energy release rate range gradually decreases as the transverse crack density is<br />
higher, because the stress sharing in the 90 plies decreases due to the increase <strong>of</strong> the transverse cracks.<br />
On the other hand, in the latter case, it was found that the transverse crack growth rate decreases as the<br />
energy release rate range decreased, and the transverse cracks are saturated finally. The behavior <strong>of</strong><br />
transverse crack growth corresponds with the behavior <strong>of</strong> the energy release rate range. Figure 5 shows<br />
the behavior <strong>of</strong> the transverse crack growth within the area that the energy release rate range is constant<br />
in Fig. 4. From the result, it is shown that the increase <strong>of</strong> the transverse crack density is proportional to<br />
the number <strong>of</strong> cycles in the early stage <strong>of</strong> fatigue. The result indicates that the assumption is correct that<br />
the mechanism <strong>of</strong> the initiation and increase <strong>of</strong> the transverse crack is similar. The transverse crack<br />
density growth rate can be calculated from Fig. 5. Figure 6 shows the transverse crack density growth<br />
rate as a function <strong>of</strong> the energy release rate range, the modified Paris law. The modified Paris law<br />
constants are A=5.61e -38 and =11.3, respectively from Fig. 6.<br />
4.3 Prediction <strong>of</strong> transverse crack initiation<br />
The number <strong>of</strong> cycles to the initiation <strong>of</strong> transverse crack <strong>under</strong> cyclic <strong>loading</strong> was predicted by<br />
equation (4). In this study, the gauge length <strong>of</strong> L=120 mm and the modified Paris law constants <strong>of</strong><br />
A=5.61e -38 and =11.3 were used. Figure 7 shows the results <strong>of</strong> the experiments and analysis for the<br />
prediction <strong>of</strong> transverse crack initiation <strong>under</strong> fatigue <strong>loading</strong>. In experimental results, the cycles <strong>of</strong> the<br />
first observation <strong>of</strong> the transverse crack by interrupting the fatigue test at the arbitrary cycles is regarded<br />
as the cycles to the transverse crack onset. The analytical result shows good agreement with the<br />
experimental results in Fig. 7.<br />
Transverse crack density mm -1<br />
max/ ti=0.90 f=5Hz<br />
max/ ti=0.80 f=5Hz<br />
max/ ti=0.75 f=5Hz<br />
max/ ti=0.70 f=5Hz<br />
max/ ti=0.60 f=5Hz<br />
1.2<br />
1.0<br />
0.8<br />
0.6<br />
0.4<br />
0.2<br />
max/ ti=0.50 f=100Hz<br />
max/ ti=0.40 f=100Hz<br />
10 0 10 1 10 2 10 3 10 4 10 5 10 6 10 7 10 8 10 9<br />
0<br />
Number <strong>of</strong> cycles n<br />
Fig. 3. Transverse crack density as a function <strong>of</strong> number <strong>of</strong> cycles in cross-ply [0/902]s laminates <strong>under</strong> each applied stress level [11].
A Hosoi, K Takamura, N Sato, H Kawada. / Prediction <strong>of</strong> transverse crack initiation <strong>of</strong> CFRP laminates <strong>under</strong> fatigue <strong>loading</strong><br />
Energy release rate range G J/m 2<br />
1000<br />
800<br />
600<br />
400<br />
200<br />
0<br />
0 0.5 1.0<br />
0<br />
1.5<br />
Transverse crack density D mm -1<br />
1.0 [10 5 ]<br />
Fig. 4. Transverse cracking fatigue date <strong>under</strong> the applied stress level <strong>of</strong> max/ti=0.8. The energy release rate range as a function <strong>of</strong> transverse<br />
crack density, the solid line, and transverse crack density as a function <strong>of</strong> number <strong>of</strong> cycles, the open symbols.<br />
Transverse crack density D mm -1<br />
0.6<br />
0.5<br />
0.4<br />
0.3<br />
0.2<br />
0.1<br />
0.8<br />
0.6<br />
0.4<br />
0.2<br />
0<br />
0 1000 2000 3000<br />
Number <strong>of</strong> cycles N<br />
Fig. 5. Transverse crack density as a function <strong>of</strong> number <strong>of</strong> cycles within the area <strong>of</strong> the constant energy release rate range in Fig. 4.<br />
Crack density growth rate mm -1 /cycle<br />
10 -9<br />
10 -8<br />
10 -7<br />
10 -6<br />
10 -5<br />
10 -4<br />
10 -3<br />
10 -2<br />
5Hz<br />
100Hz<br />
10<br />
100 500 1000 5000<br />
-11<br />
10 -10<br />
Energy release rate range G J/m 2<br />
Fig. 6. Transverse crack density growth rate as a function <strong>of</strong> energy release rate range.<br />
Number <strong>of</strong> cycles N<br />
191
192<br />
5. Discussions<br />
Applied stress level max/ ti<br />
1.0<br />
0.8<br />
0.6<br />
0.4<br />
0.2<br />
Fifth International Conference on <strong>Fatigue</strong> <strong>of</strong> Composites<br />
Experiments 5Hz<br />
Experiments 100Hz<br />
Analysis<br />
10 0 10 1 10 2 10 3 10 4 10 5 10 6 10 7 10 8<br />
0<br />
Number <strong>of</strong> cycles N<br />
Fig. 7. Prediction <strong>of</strong> transverse crack initiation <strong>under</strong> fatigue <strong>loading</strong>.<br />
The reason that the analytical result showed good agreement with experimental results is discussed<br />
here. Generally, a fatigue crack grows partially due to the stress concentration at the crack tip <strong>under</strong><br />
cyclic <strong>loading</strong>s once a microscopic defect initiates. When the transverse crack growth in CFRP<br />
laminates is considered, it is though that the transverse crack is not initiated after accumulation <strong>of</strong><br />
damage in the matrix but the transverse crack is initiated partially due to the stress concentration at the<br />
microscopic defect, such as the interfacial debonding between a fiber and matrix. The transverse crack<br />
increases due to the repeat <strong>of</strong> the partial transverse crack growth by cyclic <strong>loading</strong>. Therefore, it is<br />
thought that the mechanism <strong>of</strong> the initiation and increase <strong>of</strong> transverse crack is similar in the early stage<br />
<strong>of</strong> the fatigue, and the growth <strong>of</strong> the transverse crack density was proportional to the number <strong>of</strong> cycles<br />
as shown in Fig. 5.<br />
6. Conclusions<br />
In this study, the number <strong>of</strong> cycles to the transverse crack initiation <strong>under</strong> fatigue <strong>loading</strong> was<br />
predicted by focusing on the periodicity <strong>of</strong> the transverse crack growth. It is shown that the growth <strong>of</strong><br />
the transverse crack density in the early stage <strong>of</strong> the fatigue is proportional to the number <strong>of</strong> cycles, and<br />
appropriateness <strong>of</strong> the proposed model was confirmed. In addition, the analytical results showed good<br />
agreement with experimental results for predicting the transverse crack initiation <strong>under</strong> fatigue <strong>loading</strong>.<br />
References<br />
[1] K. L. Reifsnider and A. Talug, Analysis <strong>of</strong> fatigue damage in <strong>composite</strong> laminates, Int. J. <strong>Fatigue</strong> 2 (1980) 3-11.<br />
[2] J. E. Masters and K. L. Reifsnider, An investigation <strong>of</strong> cumulative damaged development in quasi-isotropic graphite/epoxy laminates,<br />
ASTM STP 775 (1982) 40-61.<br />
[3] J. A. Nairn, The strain energy release rate <strong>of</strong> <strong>composite</strong> microcracking: A variational approach, J. Compos. Mater. 23 (1989) 1106-1129,<br />
(and errata: J. Compos. Mater. 24 (1990) 223-224).<br />
[4] Z. Hashin, Analysis <strong>of</strong> cracked laminates: A variational approach, Mech. Mater. 4 (1985) 121-136.
A Hosoi, K Takamura, N Sato, H Kawada. / Prediction <strong>of</strong> transverse crack initiation <strong>of</strong> CFRP laminates <strong>under</strong> fatigue <strong>loading</strong><br />
[5] S. Liu and J. A. Nairn, Fracture mechanics analysis <strong>of</strong> <strong>composite</strong> microcracking: Experimental results in fatigue, Proc. <strong>of</strong> the 5th Technical<br />
Conference on Composite Materials (1990) 287-295.<br />
[6] K. Ogi, S. Yashiro, K. Niimi, A probabilistic approach for transverse crack evolution in a <strong>composite</strong> laminate <strong>under</strong> variable amplitude<br />
cyclic <strong>loading</strong>, Compos. Part A-Appl. S. 41 (2010) 383-390.<br />
[7] J. Tong, Characteristics <strong>of</strong> fatigue crack growth in GFRP laminates, Int. J. <strong>Fatigue</strong> 24 (2002) 291-297.<br />
[8] T. Yokozeki, T. Aoki and T. Ishikawa, <strong>Fatigue</strong> growth <strong>of</strong> matrix cracks in the transverse direction <strong>of</strong> CFRP laminates, Compos. Sci.<br />
Technol. 62 (2002) 1223-1229.<br />
[9] A. Hosoi, Y. Arao, H. Karasawa and H. Kawada, High-cycle fatigue characteristics <strong>of</strong> quasi-isotropic CFRP laminates, Adv. Compos<br />
Mater. (2007) 16 151-166.<br />
[10] A. Hosoi, Y. Arao and H. Kawada, Transverse crack growth behavior considering free-edge effect in quasi-isotropic CFRP laminates<br />
<strong>under</strong> high-cycle fatigue <strong>loading</strong>, Compos. Sci. Technol. 69 (2009) 1388-1393.<br />
[11] A. Hosoi, J. Shi, N. Sato and H. Kawada, Variations <strong>of</strong> fatigue damage growth in cross-ply and quasi-isotropic laminates <strong>under</strong> high-cycle<br />
fatigue <strong>loading</strong>, J. Solid Mech. Mater. Eng. 3 (2009) 138-149.<br />
[12] A. Hosoi, N. Sato, Y. Kusumoto, K. Fujiwara and H. Kawada, High-cycle fatigue characteristics <strong>of</strong> quasi-isotropic CFRP laminates<br />
(Initiation and propagation <strong>of</strong> delamination considering the interaction with transverse cracks), Int. J. <strong>Fatigue</strong> (2010) 32 29-36.<br />
[13] J.W. Lee and I. M. Daniel, Progressive transverse cracking <strong>of</strong> cross-ply <strong>composite</strong>s, J. Comp. Mater. 24 (1990) 1225-1243.<br />
[14] S. Ogihara, A. Kobayashi, N Takeda and S. Kobayashi, Damage mechanics analysis <strong>of</strong> transverse cracking behavior in <strong>composite</strong><br />
laminates, Int. J. Damage Mech. 9 (2000) 113-129.<br />
[15] N. Takeda, S. Ogihara and A. Kobayashi, Microscopic fatigue damage progress in CFRP cross-ply laminates, Composites 26 (1995)<br />
859-867.<br />
193
Interfacial <strong>Fatigue</strong> Crack Propagation in Microscopic Model<br />
Composite using Bifiber Shear Specimen<br />
Abstract<br />
M Hojo a, *, Y Matsushita a , M Tanaka b , T Adachi c<br />
a Department <strong>of</strong> Mechanical Engineering and Science, Kyoto University, Sakyo-ku, Kyoto 606-8501, Japan<br />
b Department <strong>of</strong> Mechanical Engineering, Kanazawa Institute <strong>of</strong> Technology, Nonoichi, Ishikawa 921-8501, Japan<br />
c Institute for Frontier Medical Sciences, Kyoto University, Sakyo-ku, Kyoto 606-8507, Japan<br />
Interfacial fatigue crack growth behavior for GF/epoxy model <strong>composite</strong>s was investigated using the bifiber shear<br />
(BFS) methods. This new type <strong>of</strong> the model <strong>composite</strong>s was developed in our previous study for the in situ observation <strong>of</strong><br />
the static crack growth behavior in a scanning electron microscope. The specimen is composed <strong>of</strong> two E-glass filaments<br />
<strong>of</strong> diameters <strong>of</strong> 23 and 40 m and bisphenol A type epoxy is impregnated between the filaments. The crack growth<br />
behavior <strong>under</strong> different stress ratios was investigated to clarify the fatigue crack growth mechanism. The frequency <strong>of</strong><br />
the stress cycling was 30 Hz. The stress ratio, R, <strong>of</strong> the minimum to the maximum loads was kept constant <strong>under</strong> R = 0.1,<br />
0.3 and 0.5 during each test. Although the energy release rate gradually increases with the increment <strong>of</strong> the crack length,<br />
some specimens showed that the change in da/dN was not monotonous with the crack growth, suggesting the difference<br />
in the fatigue crack growth resistance along a single filament which was similar to that in the fracture toughness observed<br />
in our previous study. The fatigue crack growth resistance <strong>of</strong> the interface is much smaller than that <strong>of</strong> the <strong>composite</strong><br />
laminates. The influence <strong>of</strong> the stress ratio became smaller when da/dN was correlated to Gmax than when da/dN was<br />
correlated to K or (G 1/2 ). Thus, the fatigue crack growth mechanism <strong>of</strong> the glass fiber/epoxy interface is completely<br />
different from that <strong>of</strong> the <strong>composite</strong> laminates where da/dN is <strong>of</strong>ten correlated to K <strong>under</strong> mode II <strong>loading</strong> and the<br />
contribution <strong>of</strong> resin is dominant. Fractographic observation showed rather brittle fracture morphology and less<br />
contribution <strong>of</strong> the resin fracture. This tendency also agrees with our former research on the static interface fracture<br />
criterion <strong>under</strong> different <strong>loading</strong> mode ratio.<br />
1. Introduction<br />
The maiden flight <strong>of</strong> B787 in 2009 and the project <strong>of</strong> A350XWB promise that carbon fiber reinforced<br />
plastics (CFRPs) become the common structural materials for the main wing and fuselage <strong>of</strong><br />
commercial aircraft. Although <strong>composite</strong> materials have significantly greater resistance to fatigue<br />
<strong>loading</strong> than have any other class <strong>of</strong> materials, experimental evidences show that the damage in CFRP<br />
structures accumulates <strong>under</strong> fatigue <strong>loading</strong>s [1,2]. Stress - number <strong>of</strong> cycles to failure (S-N) diagrams<br />
usually show that the fatigue strength in fiber direction is lower than the static strength [3,4]. Loads for<br />
the onset <strong>of</strong> transverse cracks <strong>under</strong> fatigue <strong>loading</strong> are lower than those <strong>under</strong> static <strong>loading</strong> [5-7]. The<br />
energy release rate for the delamination fatigue crack growth threshold is below that for the fracture<br />
toughness [8-11].<br />
Fracture <strong>of</strong> continuous fiber-reinforced <strong>composite</strong>s in the fiber direction is caused by stochastic<br />
* Corresponding author. Tel.: +81-75-753-4836; fax: +81-75-771-7286.<br />
E-mail address: hojo_cm@me.kyoto-u.ac.jp
M Hojo, Y Matsushita, etc. / Interfacial <strong>Fatigue</strong> Crack Propagation in Microscopic Model Composite using Bifiber Shear Specimen<br />
damage accumulation based on inherent fiber strength distribution [12-18]. Here, interfacial strength<br />
plays an important role in this damage accumulation, and it is sure that the fatigue <strong>loading</strong> enhances the<br />
damage accumulation [19,20]. Fracture perpendicular to the fiber direction, transverse crack, governs<br />
the design limit <strong>of</strong> <strong>composite</strong> laminated structures. Experimental observations show that transverse<br />
cracks <strong>of</strong>ten occur at the interface, and these interfacial cracks coalesce into longer transverse cracks<br />
[21,22]. Since transverse cracks are usually the first damage observed in laminated structures and can<br />
cause delamination and fiber fracture in adjacent load bearing plies [23], it is quite important from the<br />
point <strong>of</strong> view <strong>of</strong> damage tolerant design. Moreover, these microscopic fracture mechanisms <strong>of</strong><br />
continuous fiber-reinforced <strong>composite</strong> in fiber and transverse directions clearly indicate the importance<br />
<strong>of</strong> <strong>under</strong>standing interfacial fracture <strong>under</strong> fatigue <strong>loading</strong>.<br />
Although there are a number <strong>of</strong> experimental studies to evaluate interfacial strength in <strong>composite</strong><br />
materials [24,25], little works have been reported on the fatigue behavior <strong>of</strong> the fiber/matrix interface.<br />
DiBenedetto et al. [26] briefly have dealt with the fatigue behavior <strong>of</strong> single carbon fiber/epoxy model<br />
<strong>composite</strong>s. However, they only qualitatively characterized the increase <strong>of</strong> local yielding zone with an<br />
increase in applied fatigue cycles. Latour et al [27,28] carried out microdroplet tests <strong>under</strong> fatigue<br />
<strong>loading</strong> for carbon and Kevlar fibers with thermoplastic resin. They found S-N relations for interfacial<br />
strength <strong>under</strong> fatigue <strong>loading</strong> and also these relations were affected by saline environment.<br />
In our previous studies [29,30], the interfacial fracture mechanical properties for glass fiber and<br />
carbon fiber/epoxy interface were evaluated both <strong>under</strong> static and fatigue <strong>loading</strong>s using the<br />
microbundle pull-out test (the so-called micro<strong>composite</strong> test). We found the almost horizontal S-N type<br />
relations for pull-out load. The effect <strong>of</strong> surface treatment on the glass fiber was minimal <strong>under</strong> fatigue<br />
<strong>loading</strong> although this treatment had some effect <strong>under</strong> static <strong>loading</strong>. We also carried out the fatigue<br />
tests <strong>under</strong> different stress ratios, and found that maximum pull-out load controlled the S-N diagrams<br />
for the interfacial fatigue fracture both for glass and carbon fibers.<br />
For fatigue <strong>loading</strong>, the evaluation <strong>of</strong> fatigue crack growth behavior with regard to the fracture<br />
mechanics parameter is quite important to <strong>under</strong>stand its mechanism [31]. The drawback <strong>of</strong> the above<br />
mentioned micro<strong>composite</strong> test method is the difficulties in the measurement <strong>of</strong> the crack length<br />
because the central pull-out fiber is surrounded by six fibers, and the exact crack propagation rate was<br />
not possible to be measured. Gradin et al. [32] reported the crack growth behavior <strong>of</strong> steel rod/epoxy<br />
interface using macroscopic model <strong>composite</strong>s. Though they found the linear relationship between the<br />
crack growth rate and the energy release rate, the diameter <strong>of</strong> the steel rod was 10mm and far from the<br />
real microscopic fracture behavior in <strong>composite</strong> materials.<br />
We proposed new types <strong>of</strong> model <strong>composite</strong>s, bifiber shear (BFS) and bifiber open (BFO) specimens<br />
for the in situ observation <strong>of</strong> crack growth behavior in a scanning electron microscope (SEM) [33]. The<br />
change <strong>of</strong> the static fracture toughness along the glass fiber (GF)/epoxy interface <strong>of</strong> a single filament<br />
was investigated <strong>under</strong> different <strong>loading</strong> mode. Both the opening and shear modes contribute in BFS<br />
specimens while the opening mode mainly contributes in BFO specimens. Though the general tendency<br />
showed that the fracture toughness increased with increasing crack length for both types <strong>of</strong> the<br />
specimens, the change <strong>of</strong> the fracture toughness along a single filament was observed. The initial<br />
195
196<br />
Fifth International Conference on <strong>Fatigue</strong> <strong>of</strong> Composites<br />
fracture toughness values for BFS and BFO specimens were rather insensitive to the <strong>loading</strong> mode. This<br />
result was completely different from that for bulk <strong>composite</strong> laminates [34-36], suggesting less<br />
contribution <strong>of</strong> resin fracture.<br />
In the present study, interfacial fracture behavior for GF/epoxy model <strong>composite</strong>s was investigated<br />
<strong>under</strong> fatigue <strong>loading</strong> using the BFS methods. The interfacial crack growth behavior <strong>under</strong> different<br />
stress ratio was investigated to clarify the crack growth mechanism <strong>under</strong> fatigue <strong>loading</strong>.<br />
2. Experimental procedure<br />
2.1 Materials and specimen<br />
E-glass fibers <strong>of</strong> different diameters (df = 23 and 40 m, Nitto Boseki, without surface treatment)<br />
were used in this study. Bisphenol A type epoxy (Epikote 828) was used as matrix, and<br />
triethylenetetramine (10 wt%) was used as hardener [29,30,33]. Fig. 1 shows a schematic <strong>of</strong> bifiber<br />
shear (BFS) specimen developed in our previous paper [33]. Matrix resin was impregnated between two<br />
parallel filaments. The details <strong>of</strong> the specimen preparation processes were reported in our previous<br />
paper [33]. The specimens were cured at 50 o C for 80 min followed by 100 o C for 60 min. Then, the<br />
specimen was mounted on a paper frame. Special care was taken to keep the two fibers and the paper<br />
frame on the same plane for in-situ observation.<br />
Glass Fiber<br />
Epoxy Resin<br />
Load<br />
<br />
L<br />
Load<br />
Fig. 1. Schematic <strong>of</strong> bifiber shear specimen.<br />
The resin impregnation length, L, and fiber distance at the end <strong>of</strong> both resin impregnation, , were<br />
measured for all specimens using a digital microscope (VH-7000, Keyence) at a magnification <strong>of</strong> 375<br />
times. For specimens with df = 40 m, L was between 300 and 1300 m with an average <strong>of</strong> 740 m,<br />
and was between 30 and 60 m with an average <strong>of</strong> 37 m. For specimens with df = 23 m, L was<br />
between 200 and 1000 m with an average <strong>of</strong> 510 m, and was between 15 and 30 m with an<br />
average <strong>of</strong> 24 m. These values were almost identical to our former paper on the interfacial static
M Hojo, Y Matsushita, etc. / Interfacial <strong>Fatigue</strong> Crack Propagation in Microscopic Model Composite using Bifiber Shear Specimen<br />
fracture toughness using the same specimen. Since the difference in at both end <strong>of</strong> resin impregnated<br />
region was less than 3% for each specimen, the averaged values were used for calculation. Though there<br />
were some differences in the thickness <strong>of</strong> the impregnated resin, the influence on the fracture<br />
mechanical parameters was small in our preparatory calculations. It was also confirmed that the<br />
diameter <strong>of</strong> fiber was almost the same for each specimen, and the change <strong>of</strong> the diameter within the<br />
specimen was negligible. Gold coating was carried out for all specimens before the following<br />
mechanical tests.<br />
2.2 <strong>Fatigue</strong> tests<br />
<strong>Fatigue</strong> tests were carried out with a special low-load-capacity fatigue testing machine <strong>of</strong> 10 N in<br />
capacity with an electromagnetic actuator (Shimadzu) which was installed in a scanning electron<br />
microscope (SEM, JEOL, JSM-5410LV) [33]. The paper frame was cut after griping the specimen with<br />
clip type grips. Then, specimens were loaded statically at the rate <strong>of</strong> 1.0x10 -6 m/s to introduce precracks<br />
<strong>of</strong> the length <strong>of</strong> about half <strong>of</strong> the fiber diameter. Here, the load corresponding to the onset <strong>of</strong> precrack,<br />
Ppre, was recorded. The following fatigue tests were carried out by keeping the maximum load, Pmax,<br />
constant at Ppre/2. The stress ratio <strong>of</strong> the minimum load to the maximum load was kept constant at 0.1,<br />
0.3 and 0.5. The speed <strong>of</strong> stress cycling was 30 Hz. The actual control mode <strong>of</strong> the testing machine was<br />
displacement control instead <strong>of</strong> load control owing to the stability <strong>of</strong> the tests. Here, the specimen<br />
compliance was calculated, and the displacement was controlled to keep the desired maximum load,<br />
Pmax, and the stress ratio, R, constant. Crack length was defined as the length from the bottom <strong>of</strong> the<br />
meniscus, and was measured using video recording <strong>of</strong> SEM during the tests.<br />
2.3 Fracture mechanics parameters at interface<br />
The calculation process to evaluate the energy release rate is summarized as follows. Three<br />
dimensional linear elastic stress analyses were carried out using a commercial finite element (FE) code,<br />
MSC MARC 2001, with a prepost processor, MENTAT 2001, to obtain the energy release rate. The<br />
energy release rate was calculated using crack closure method [39]. Taking the advantage <strong>of</strong> symmetry,<br />
the model consists <strong>of</strong> a half <strong>of</strong> the specimen. Fig. 2a shows the schematic and boundary conditions for<br />
the model. Whole length <strong>of</strong> the fibers was modeled to calculate the geometrical nonlinearity, and large<br />
displacement analysis was carried out. Fig. 2b shows the detailed model around the resin impregnated<br />
part. The minimum size <strong>of</strong> the mesh at the crack tip was taken as 1.3 m for fiber <strong>of</strong> df=40 m, and 0.72<br />
m for fiber <strong>of</strong> df=23 m. Material properties and the details <strong>of</strong> the actual calculation process to<br />
evaluate the energy release rate <strong>of</strong> each specimen were explained in our previous paper [33]. Fig. 3<br />
shows examples <strong>of</strong> the relationships between the energy release rate and the crack length. The energy<br />
release rate gradually increases with the crack growth when the applied stress is constant.<br />
The complex stress intensity factors <strong>of</strong> an interfacial crack, K1 and K2, were also evaluated for the<br />
specimen based on Erdogan‟s definition [40,41]. The mode ratio, K2/K1, increased sharply until the<br />
relative crack length, a/df, is about 1, and then the mode ratio leveled <strong>of</strong>f at about 1.2 – 1.3 [33]. The<br />
197
198<br />
Fifth International Conference on <strong>Fatigue</strong> <strong>of</strong> Composites<br />
contribution <strong>of</strong> shear mode is slightly higher than that <strong>of</strong> opening mode for this specimen expect when<br />
the relative crack length is less than 1.<br />
a<br />
z<br />
x<br />
y<br />
Square root <strong>of</strong> energy release rate, G 1/2 (J/m 2 ) 1/2<br />
d f<br />
<br />
(a)<br />
x<br />
z<br />
Force direction<br />
y<br />
Fixed displacement<br />
d f : Fiber diameter<br />
L : Adhesion length<br />
: Fiber space<br />
a : Crack length<br />
Fig. 2. Boundary conditions and mesh for bifiber shear specimen.<br />
30<br />
25<br />
20<br />
15<br />
10<br />
5<br />
f =800MPa, d f =40m, =40m<br />
L=400m<br />
L=800m<br />
L=1200m<br />
0<br />
0 50 100 150 200 250 300 350<br />
Crack length, a(m)<br />
Fig. 3. Relation between square root <strong>of</strong> energy release rate, G 1/2 , and crack length, a, for bifiber shear specimen.<br />
(b)
M Hojo, Y Matsushita, etc. / Interfacial <strong>Fatigue</strong> Crack Propagation in Microscopic Model Composite using Bifiber Shear Specimen<br />
3. Experimental results and discussion<br />
3.1 In situ observation <strong>of</strong> fatigue crack growth<br />
Figs. 4 and 5 indicate the snap shots <strong>of</strong> the fatigue crack propagation for tests with df = 40 m and 23<br />
m, respectively. The white arrows for the photos <strong>of</strong> N=0 indicate the precracks introduced before the<br />
fatigue tests. Fig. 6 and 7 show the relationship between the crack length and the number <strong>of</strong> cycles. For<br />
the case <strong>of</strong> Fig. 4, specimen S4062a, single fatigue crack started propagating from the left side meniscus.<br />
The propagation was stable until the final fracture at N=2.16x10 4 . For some specimens, cracks<br />
propagated from both sides <strong>of</strong> the meniscus. For the case <strong>of</strong> Fig. 5, specimen S2380a, the first crack<br />
started propagation from the left side meniscus. The second crack initiated from the right side meniscus<br />
at N=8.1x10 3 , and both cracks propagated at almost the same rate until final fracture at N=1.67x10 4 . Fig.<br />
8 compares the relationship for the crack length and number <strong>of</strong> cycles for two cracks in the same<br />
specimens. In this figure, the solid lines indicate the first cracks and the dashed lines indicate the second<br />
cracks.<br />
Fig. 4. Scanning electron micrographs <strong>of</strong> interfacial fatigue crack propagation from one end <strong>of</strong> meniscus (df=40m, S4062a).<br />
199
200<br />
Fifth International Conference on <strong>Fatigue</strong> <strong>of</strong> Composites<br />
Fig. 5. Scanning electron micrographs <strong>of</strong> interfacial fatigue crack propagation from both ends <strong>of</strong> meniscus (df=23m, S2380a).<br />
Crack length, a (m)<br />
700<br />
600<br />
500<br />
400<br />
300<br />
200<br />
100<br />
d f =40m, R=0.5<br />
0<br />
0 1 2 3 4 5 6 7<br />
Number <strong>of</strong> cycles, N (×10 4 )<br />
Fig. 6. Relation between crack length, a, and number <strong>of</strong> cycles, N (df=40m, R=0.5).<br />
S4061d<br />
S4062a<br />
S4062b<br />
S4062e<br />
S4063d<br />
S4080e<br />
S4059a<br />
S4081e
M Hojo, Y Matsushita, etc. / Interfacial <strong>Fatigue</strong> Crack Propagation in Microscopic Model Composite using Bifiber Shear Specimen<br />
Crack length, a (m)<br />
Crack length, a (m)<br />
350<br />
300<br />
250<br />
200<br />
150<br />
100<br />
50<br />
d f =23m, R=0.5<br />
S2369d<br />
S2370d<br />
S2383b<br />
S2383c<br />
S2380a<br />
S2384c<br />
0<br />
0 2 4 6 8 10 12<br />
Number <strong>of</strong> cycles, N (×10 4 )<br />
Fig. 7. Relation between crack length, a, and number <strong>of</strong> cycles, N (df=23m, R=0.5).<br />
500<br />
400<br />
300<br />
200<br />
100<br />
S4081e, d f =40m, R=0.5<br />
S2380a, d f =23m, R=0.5<br />
0<br />
0 0.5 1 1.5 2 2.5 3<br />
Number <strong>of</strong> cycles, N (×10 4 )<br />
Fig. 8. Relation between crack length, a, and number <strong>of</strong> cycles, N for specimens with two cracks propagated from both ends <strong>of</strong> meniscus.<br />
Since all the tests were carried out by keeping the maximum load constant during fatigue <strong>loading</strong>, the<br />
energy release rate gradually increases with the crack length. This brought the downwards convex<br />
tendency <strong>of</strong> the relationship between the crack length and the number <strong>of</strong> cycles as shown in Figs. 6 and<br />
7, where the crack growth rate gradually increased with the crack length owing to the power law<br />
relations. However, the crack growth behavior <strong>of</strong> each crack was far from monotonic increase <strong>of</strong> the<br />
crack growth rate. In some specimens, retardation <strong>of</strong> the crack growth was observed by the step like<br />
relationship in Figs. 6 and 7. In Fig. 8, two cracks in the same specimen showed different changes in<br />
201
202<br />
Fifth International Conference on <strong>Fatigue</strong> <strong>of</strong> Composites<br />
da/dN with number <strong>of</strong> stress cycles in the crack growth. This gives clear evidence that the possible<br />
slight fluctuation <strong>of</strong> the load control was not responsible for the change in the crack growth behavior.<br />
When the relative crack length, a/df, is smaller than 1, the difference in the mode ratio, K2/K1, may<br />
have influence on the crack growth behavior. However, the results <strong>of</strong> Figs. 6-8 show that this influence<br />
is minimal.<br />
3.2 Crack growth rate<br />
Figs. 9 and 10 show the relationship between the crack growth rate, da/dN, and the maximum energy<br />
release rate, Gmax, for the specimens with df=23 m <strong>under</strong> R=0.5. The corresponding relationship<br />
between the crack length and the number <strong>of</strong> cycles is shown in Fig. 7. The specimens shown in Fig. 9<br />
are categorized as type A where da/dN increased monotonically with the increase in Gmax. In this<br />
category, some specimens show that da/dN is expressed by a power law relationship, da/dN=AGmax n .<br />
However, other specimens showed that da/dN-Gmax relationship deviates to the lower values than those<br />
expected by the power law relation with the crack growth. The specimens shown in Fig. 10 are<br />
categorized as type B where the decrease in da/dN is observed, followed by the increase in da/dN during<br />
the propagation.<br />
In our previous study on the static fracture toughness using the same bifiber shear specimens, the<br />
change in the fracture toughness along single filament interface was observed [33]. Thus, the change in<br />
da/dN categorized as type B is due to the variation in the crack growth resistance along single filament<br />
interface. The difference <strong>of</strong> da/dN for two cracks in the same specimen as shown in Fig. 8 also supports<br />
this fact.<br />
Crack propagation rate, da/dN (m/cycle)<br />
10 -5<br />
10 -6<br />
10 -7<br />
10 -8<br />
10 -9<br />
10 -10<br />
10 -11<br />
d f =23m, R=0.5<br />
S2369d<br />
S2383b<br />
S2380a<br />
10 100 1000<br />
Maximum energy release rate, G (J/m<br />
max 2 4000<br />
)<br />
da/dN<br />
(a) Type A<br />
G Gmax max<br />
Fig. 9. Relation between crack propagation rate, da/dN, and maximum energy release rate, Gmax (df=23m, R=0.5, type A).<br />
In Fig. 11, the relationship between da/dN and Gmax 1/2 is compared with that between da/dN and G 1/2<br />
for all specimens in order to find out the controlling fracture mechanics parameter for interfacial fatigue
M Hojo, Y Matsushita, etc. / Interfacial <strong>Fatigue</strong> Crack Propagation in Microscopic Model Composite using Bifiber Shear Specimen<br />
crack growth <strong>under</strong> different stress ratios. Here, the range <strong>of</strong> square root <strong>of</strong> the energy release rate, G 1/2 ,<br />
is defined as Gmax 1/2 - Gmin 1/2 . Taking into account that the energy release rate, G, is proportional to the<br />
square <strong>of</strong> the stress intensity factor, K 2 (G=HK 2 where H is a parameter composed <strong>of</strong> elastic moduli<br />
[42]), G 1/2 is a parameter proportional to the stress intensity range, K, and Gmax 1/2 is a parameter<br />
proportional to the maximum stress intensity factor, Kmax. The definition <strong>of</strong> G 1/2 also fits the second<br />
definition <strong>of</strong> G by Matsubara et al.[43] where G=H(Kmax-Kmin) 2 . Then, da/dN – G 1/2 relation<br />
corresponds to da/dN – K relation, and da/dN – Gmax 1/2 relation corresponds to da/dN – Kmax relation,<br />
respectively [10,11,37]. In these figures, the test results <strong>under</strong> R=0.5 are shown with open symbols, and<br />
those <strong>under</strong> R=0.3 and 0.1 are shown with solid symbols. Triangle marks indicate the results with d f=40<br />
m, and square marks indicate the results with df=23 m. The da/dN-G 1/2 relationship indicates clear<br />
stress ratio dependency where the data points <strong>under</strong> R=0.3 and 0.1 are located right hand side <strong>of</strong> the data<br />
points <strong>under</strong> R=0.5. On the other hand, the da/dN-Gmax relationship indicates no clear stress ratio<br />
dependency although the data points are spread in a wide band.<br />
Crack propagation rate, da/dN (m/cycle)<br />
10 -5<br />
10 -6<br />
10 -7<br />
10 -8<br />
10 -9<br />
10 -10<br />
10 -11<br />
d f =23m, R=0.5<br />
S2370d<br />
S2383c<br />
S2384c<br />
10 100 1000<br />
Maximum energy release rate, G (J/m<br />
max 2 4000<br />
)<br />
da/dN<br />
(b) Type B<br />
G Gmax max<br />
Fig. 10. Relation between crack propagation rate, da/dN, and maximum energy release rate, Gmax (df=23m, R=0.5, type B).<br />
For the case <strong>of</strong> unidirectional GF/epoxy laminates, the crack growth behavior <strong>under</strong> mode II <strong>loading</strong><br />
was correlated to the stress intensity range, K without respect to the stress ratios [43] similar to the<br />
results <strong>of</strong> CFRP laminates [36,37]. Tests <strong>under</strong> mixed modes <strong>of</strong> I and II also showed that both K and<br />
Kmax contributed to the crack growth [44]. Thus, the controlling fracture mechanics parameter and the<br />
fatigue crack growth mechanism <strong>of</strong> the glass fiber/epoxy interface are completely different from those<br />
<strong>of</strong> GF/epoxy laminates.<br />
Fig.12 indicates the da/dN – Gmax relationship for the all specimens <strong>under</strong> different stress ratios.<br />
Large scatter was observed for the obtained data. However the da/dN – Gmax relationship for each<br />
specimen is within a narrow band when we apply a power law relation. The whole data can also be<br />
indicated by a wide band <strong>of</strong> a power law relationship as shown with the hatched area in this figure. The<br />
203
204<br />
Fifth International Conference on <strong>Fatigue</strong> <strong>of</strong> Composites<br />
width <strong>of</strong> this scatter band is about three times in the energy release rate coordinate. It is interesting to<br />
note that the scatter band width <strong>under</strong> fatigue <strong>loading</strong> is quite similar to that for static R-curves where<br />
the plateau values range from 100 to 300 J/m 2 .<br />
Crack propagation rate, da/dN (m/cycle)<br />
10 -5<br />
10 -6<br />
10 -7<br />
10 -8<br />
10 -9<br />
10 -10<br />
10 -11<br />
da/dN-K max<br />
Gmax Kmax<br />
d f =40m R=0.5<br />
d f =23m R=0.5<br />
d f =40m R=0.3<br />
d f =40m R=0.1<br />
d f =23m R=0.1<br />
1 10<br />
60<br />
1/2 2 1/2<br />
Square root <strong>of</strong> maximum energy release rate, G (J/m )<br />
max<br />
Crack propagation rate, da/dN (m/cycle)<br />
10 -5<br />
10 -6<br />
10 -7<br />
10 -8<br />
10 -9<br />
10 -10<br />
10 -11<br />
(a)<br />
(a)<br />
1 10<br />
d f =40m R=0.5<br />
d f =23m R=0.5<br />
d f =40m R=0.3<br />
d f =40m R=0.1<br />
d f =23m R=0.1<br />
Range <strong>of</strong> square root <strong>of</strong> energy release rate, G 1/2 (J/m 2 ) 1/2<br />
(b)<br />
(b)<br />
Fig. 11. Effect <strong>of</strong> stress ratio on crack growth behavior.<br />
The thick dashed line in Fig. 12 shows the result <strong>of</strong> unidirectional GF/epoxy laminates <strong>under</strong> mode II<br />
<strong>loading</strong>s <strong>under</strong> R=0.1 reported by Matsubara et al. [43]. The results <strong>under</strong> R=0.3 indicate slightly higher<br />
resistance in the da/dN-Gmax relation. Then the fatigue crack growth resistance <strong>of</strong> GF/epoxy laminates is<br />
about ten times higher than that <strong>of</strong> GF/epoxy interface. This difference also agrees with the difference <strong>of</strong><br />
the fracture toughness between CF/epoxy laminates (about 2 -3 kJ/m 2 [43]) and GF/epoxy interface<br />
60
M Hojo, Y Matsushita, etc. / Interfacial <strong>Fatigue</strong> Crack Propagation in Microscopic Model Composite using Bifiber Shear Specimen<br />
(about 100-300 J/m 2 in our previous research [33]).<br />
Crack Crack propagation propagation rate, rate, da/dN da/dN (m/cycle) (m/cycle)<br />
10 -5<br />
10 -5<br />
10 -6<br />
10 -6<br />
10 -7<br />
10 -7<br />
10 -8<br />
10 -8<br />
10 -9<br />
10 -9<br />
10 -10<br />
10 -10<br />
10 -11<br />
10 -11<br />
d =40m =40m R=0.5<br />
f<br />
d =23m =23m R=0.5<br />
f<br />
d =40m =40m R=0.3<br />
f<br />
d =40m =40m R=0.1<br />
f<br />
d =23m =23m R=0.1<br />
f<br />
Matsubara et al.<br />
R=0.1<br />
Scatter <strong>of</strong> G R at a=150m a=150m<br />
10 100 1000<br />
Maximum energy release rate, G (J/m<br />
max 2 10 100 1000 4000<br />
Maximum energy release rate, G (J/m )<br />
max 2 4000<br />
)<br />
Fig. 12. Relation between crack propagation rate and maximum energy release rate.<br />
3.3 Fractographic observation and mechanism consideration<br />
Figs. 13 and 14 show the fracture surfaces <strong>of</strong> the BFS specimens with df = 40 and 23 m, respectively.<br />
Both fiber side, (a), and resin side, (b), <strong>of</strong> the fracture surfaces were observed in these figures. For both<br />
figures, the point A indicates the onset point <strong>of</strong> fatigue cracks, and the point B indicates the onset point<br />
<strong>of</strong> final unstable fracture. Very smooth fiber surface was observed on the fracture surface <strong>of</strong> the fiber<br />
side without a trace <strong>of</strong> resin. Moreover, no significant difference was observed between the fracture<br />
surface <strong>of</strong> fatigue fracture and that <strong>of</strong> final unstable fracture. The morphology <strong>of</strong> the fracture surface<br />
indicates that the contribution <strong>of</strong> resin is minimal in the interfacial fracture <strong>of</strong> this model <strong>composite</strong>. It is<br />
also interesting to note that no significant difference was observed between the fracture surfaces <strong>of</strong><br />
static and fatigue fracture [33].<br />
For the case <strong>of</strong> <strong>composite</strong> laminates, the contribution <strong>of</strong> matrix resin is large, and this brings much<br />
higher fatigue crack growth resistance [45,46]. Moreover, shear plastic deformation is responsible for<br />
the fact that the stress range is the controlling fracture mechanics parameter for delamination fatigue<br />
[36,37]. Less contribution <strong>of</strong> resin for the interfacial fracture means that the fracture mechanism is<br />
rather brittle. This fact is probably responsible for that the interface fatigue crack growth <strong>under</strong> different<br />
stress ratios is controlled by the maximum energy release rate, and the fatigue crack growth resistance<br />
<strong>of</strong> interface is much lower than that <strong>of</strong> <strong>composite</strong> laminates [11,37].<br />
205
206<br />
4. Conclusions<br />
Fifth International Conference on <strong>Fatigue</strong> <strong>of</strong> Composites<br />
Fig. 13. Scanning electron micrographs <strong>of</strong> fatigue fracture surfaces for S4081e.<br />
Fig. 14. Scanning electron micrographs <strong>of</strong> fatigue fracture surfaces for S2380a.<br />
<strong>Fatigue</strong> crack growth behavior <strong>of</strong> glass fiber/epoxy interface was investigated using a new type <strong>of</strong><br />
model <strong>composite</strong>s, bifiber shear (BFS) method. Tests <strong>under</strong> different stress ratios were carried out in a<br />
scanning electron microscope, and the in situ observation <strong>of</strong> the fatigue crack growth was successfully<br />
carried out. The contribution <strong>of</strong> the shear component is higher in this BFS specimen.<br />
Although the energy release rate gradually increases with the increment <strong>of</strong> the crack length, the
M Hojo, Y Matsushita, etc. / Interfacial <strong>Fatigue</strong> Crack Propagation in Microscopic Model Composite using Bifiber Shear Specimen<br />
change in the fatigue crack growth rate, da/dN, was not monotonous with the crack growth. Thus, the<br />
fatigue crack growth resistance was not constant along a single filament. The fatigue crack growth<br />
resistance <strong>of</strong> the interface is about one order <strong>of</strong> magnitude smaller than that <strong>of</strong> the <strong>composite</strong> laminates.<br />
The controlling fracture mechanics parameter <strong>under</strong> different stress ratios was the maximum energy<br />
release rate, which was different from that <strong>of</strong> <strong>composite</strong> laminates. Fractographic observation confirmed<br />
that these differences were due to less contribution <strong>of</strong> resin fracture for the interface fatigue crack<br />
propagation.<br />
Acknowledgements<br />
Authors would like to thank Mr. Y. Igarashi and R. Konishi <strong>of</strong> Graduate Student <strong>of</strong> Kyoto University<br />
for helpful discussion in experimental procedures. Authoers would also like to thank Dr. Y. Suzuki <strong>of</strong><br />
Nitto Boseki for supplying glass fibers <strong>of</strong> special diameters.<br />
References<br />
[1] K. Reifsnider, editor. <strong>Fatigue</strong> <strong>of</strong> Composite Materials, Elsevier, Amsterdam, 1991.<br />
[2] R. Talreja, <strong>Fatigue</strong> <strong>of</strong> Composite Materials, Technomic, Lancaster, 1987.<br />
[3] L. Lorenzo, H.T. Hahn, <strong>Fatigue</strong> failure mechanisms in unidirectional <strong>composite</strong>s. In: H.T. Hahn, editor. Composite Materials: <strong>Fatigue</strong> and<br />
Fracture, ASTM STP 907, ASTM, Philadelphia, 1986, pp.210-232.<br />
[4] H. Sembokuya, M. Hojo, C. Nagasawa, T. Aoki, K. Kemmochi, H. Maki, Effect <strong>of</strong> stress ratio on tension and delamination fatigue<br />
behavior in CF/epoxy laminates, Adv. Composite Mater., 1 (1991) 261-275.<br />
[5] N. Takeda, S. Ogihara, A. Kobayashi, Microscopic fatigue damage progress in CFRP cross-ply laminates, Composites, 25 (1995) 859-867.<br />
[6] N.T. Hoang, D. Gamby, M.-C. Lafarie-Frenot, Predincting fatigue transverse crack growth in cross-ply carbon-epoxy laminates from quasi<br />
static strength tests by using iso-damage curves, Intenational Journal <strong>of</strong> <strong>Fatigue</strong>, 32 (2010) 166-173.<br />
[7] S. Ogihara, N. Takeda, S. Kobayashi, A. Kobayashi, Effects <strong>of</strong> stacking sequence on microscopic fatigue damage development in<br />
quasi-isotropic CFRP laminates with interlaminar-toughened layers, Composites Science and Technology, 59 (1999) 1387-1398.<br />
[8] Wilkins DJ, Eisenmann JR, Camin RA, Margolis WS, Benson RA, Characterizing delamination growth in graphite-epoxy. In: Reifsnider<br />
K, editor. Damage in Composite Materials, ASTM STP 775, ASTM; 1982. p.168-183.<br />
[9] Bathias C, Laksimi A. Delamination threshold and <strong>loading</strong> effect in fiber glass epoxy <strong>composite</strong>. In: Johnson, editor. Delamination and<br />
Debonding <strong>of</strong> Materials, ASTM STP 876, ASTM; 1985. p.217-237.<br />
[10] Hojo M, Tanaka K, Gustafson C-G, Hayashi R. Effect <strong>of</strong> stress ratio on near-threshold propagation <strong>of</strong> delamination fatigue cracks in<br />
unidirectional CFRP. Compos Sci Technol 1987;29:273-292.<br />
[11] Hojo M, Ochiai S, Gustafson C-G, Tanaka K. Effect <strong>of</strong> matrix resin on delamination fatigue crack growth in CFRP laminates. Engineering<br />
Fracture Mechanics 1994;49:35-47.<br />
[12] Ochiai S, Osamura K. A computer-simulation <strong>of</strong> strength <strong>of</strong> metal matrix <strong>composite</strong>s with a reaction layer at the interface. Metallurgical<br />
Transactions A 1987;18:673-679.<br />
[13] Ochiai S, Osamura K, Abe K. A study on tensile behavior <strong>of</strong> boron fiber-reinforced aluminum sheet in terms <strong>of</strong> computer-simulation.<br />
Zeitschrift fur Metallkunde; 1985:76:402-408.<br />
[14] Curtin WA. Stochastic damage evolution and failure in fiber-reinforced compocites. Advances in Applied Mechanics 1999;36:163-253.<br />
[15] Ochiai S, Hojo M, Inoue T, Shear-lag simulation <strong>of</strong> the progress <strong>of</strong> interfacial debonding in unidirectional <strong>composite</strong>s. Compos Sci<br />
Technol 1999;59:77-88.<br />
[16] Okabe T, Takeda N, Kamoshida Y, Shimizu M, Curtin WA, A 3D shear-lag model considering micro-damage and statistical strength<br />
prediction <strong>of</strong> unidirectional fiber-reinforced <strong>composite</strong>s. Compos Sci Technol 2001;61:1773-1787.<br />
[17] Okabe T, Sekine H, Ishii K, Nishikawa M, Takeda N, Numerical method for failure simulation <strong>of</strong> unidirectional fiber-reinforced<br />
<strong>composite</strong>s with spring element model. Compos Sci Technol 2005;65: 921-933.<br />
[18] Okabe T, Takeda N. Elastoplastic shear-lag analysis <strong>of</strong> single-fiber <strong>composite</strong>s and strength predinction <strong>of</strong> unidirectional multi-fiber<br />
<strong>composite</strong>s. Composites Part A 2002;33:1327-1335.<br />
[19] Gamstedt EK, Berglund LA, Peijs T. <strong>Fatigue</strong> mechanisms in unidirectional glass-fibre-reinforced polypropylene. Compos Sci Technol<br />
1999;59:759-768.<br />
207
208<br />
Fifth International Conference on <strong>Fatigue</strong> <strong>of</strong> Composites<br />
[20] Nishikawa M, Okabe T. Microstructure-dependent fatigue damage process in short fiber reinforced plastics. International Journal <strong>of</strong> Solids<br />
and Structures 2010;47:398-406.<br />
[21] Hull D, Clyne TW. An Introduction to Composite Materials, 2nd Edition, Cambridge University Press; 1996. p.175.<br />
[22] Hobbiebrunken T, Hojo M, Adachi T, Jong CD, Fiedler B. Evaluation <strong>of</strong> Interfacial Strength in CF/Epoxies using FEM and In-situ<br />
Experiments. Composites Part A, 2006;37:2248–2256.<br />
[23] Schulte K, Stinchcomb WW. Damage Mechanisms-Including Edge Effects-in Carbon Fibre-reinforced Composite Materials. In: Friedrich<br />
K, editor. Application <strong>of</strong> Fracture Mechanics to Composite Materials, Elsevier, Amsterdam; 1989. p.273-325.<br />
[24] Kim J-K, Mai Y-W. Engineeried Interfaces in Fiber Reinforced Composites, Elsevier, Oxford, 1998.<br />
[25] Herrera-Franco PJ, Drzal LT. Comparison <strong>of</strong> methods for the measurement <strong>of</strong> fibre/matrix adhesion in <strong>composite</strong>s. Composites<br />
1992;23:2-27.<br />
[26] DiBenedetto AT, Nicolais L, Ambrosio L, Groeger J. Stress transfer and fracture in single fiber/epoxy <strong>composite</strong>s. In: Composite<br />
Interfaces, Proc. 1st International Conference on Composite Interfaces (ICCI-I), Ishida H, Koenig JL, editors, North-Holland, New York,<br />
1986. p.47-54.<br />
[27] Latour RAJr, Black J, Miller B. Fracture mechanisms <strong>of</strong> the fiber/matrix interfacial bond in fiber-reinforced polymer <strong>composite</strong>s. Surface<br />
and Interface Analysis 1991;17:477-484.<br />
[28] Latour RAJr, Black J, Miller B. Fiber/matrix interfacial bond ultimate and fatigue strength characterization in a 37 o C dry environment. J<br />
Compos Mater 1992;26:256-273.<br />
[29] Hojo M, Terashima K, Igarashi Y, Shida M, Ochiai S, Inoue T, Sawada Y. Interfacial fracture in model <strong>composite</strong>s <strong>under</strong> static and fatigue<br />
<strong>loading</strong>s -Mechanism consideration based on experimental and analytical approaches-. Materials Science Research International, STP-2,<br />
2001:189-196.<br />
[30] Hojo, M, Tanaka M, Hobbiebrunken T, Ochiai S, Inoue T, Sawada Y. Interfacial fracture <strong>of</strong> GF and CF/epoxy model <strong>composite</strong>s <strong>under</strong><br />
static and fatigue <strong>loading</strong>s. In: <strong>Fatigue</strong> 2002, Proceedings <strong>of</strong> the Eighth International <strong>Fatigue</strong> Congress, Vol. 1, EMAS, 2002, p.231-238.<br />
[31] Friedrich K, editor. Application <strong>of</strong> Fracture Mechanics to Composite Materials, Elsevier, Amsterdam; 1989.<br />
[32] Gradin PA, Backlund J. <strong>Fatigue</strong> debonding in fibrous <strong>composite</strong>s. In: Advances in Composite Materials, Proc. 3rd International<br />
Conference on Composite Materials, Vol. 1, Pergamon Press, 1980, p.162-169.<br />
[33] Hojo M, Matsushita Y, Tanaka M, Adachi T, In-situ observation <strong>of</strong> interfacial crack propagation in GF/epoxy model <strong>composite</strong> using<br />
bifiber specimens in mode I and mode II <strong>loading</strong>. Compos Sci Technol 2008;68:2678-2689.<br />
[34] Bradley WL. Relationship <strong>of</strong> matrix toughness to interlaminar fracture toughness. In: Friedrich K, editor. Application <strong>of</strong> fracture<br />
mechanics to <strong>composite</strong> materials. Elsevier, 1989. p.159-187.<br />
[35] Benzeggagh ML, Kenane M. Measurement <strong>of</strong> mixed-mode delamination fracture toughness <strong>of</strong> unidirectional glass/epoxy <strong>composite</strong>s with<br />
mixed mode bending apparatus. Composite Science and Technology, 1996;56:439-449.<br />
[36] Hojo M, Ando T, Tanaka M, Adachi T, Ochiai S, Endo, Y. Mode I and II interlaminar fracture toughness and fatigue delamination <strong>of</strong><br />
CF/epoxy laminates with self-same epoxy interleaf. International Journal <strong>of</strong> <strong>Fatigue</strong> 2006;28:1154-1165.<br />
[37] Hojo M, Matsuda S, Ochiai S. Delamination <strong>Fatigue</strong> Crack Growth in CFRP Laminates <strong>under</strong> Mode I and II Loadings -Effect <strong>of</strong><br />
Mesoscopic Structure on Fracture Mechanism-. In: Degallaix S, Bathias C, Fougeres R, editors. Proc. International Conference on <strong>Fatigue</strong><br />
<strong>of</strong> Composites, SF2M, 1997. p.15-26.<br />
[38] Tanaka H, Tanaka K. Mixed-mode growth <strong>of</strong> interlaminar cracks in carbon/epoxy laminates <strong>under</strong> cyclic <strong>loading</strong>. In: Proc. ICCM-10, Vol.<br />
1, 1995, p.181-188.<br />
[39] Rybicki EF, Kanninen MF. A finite element calculation <strong>of</strong> stress intensity factors by a modified crack closure integral. Engineering<br />
Fracture Mechanics 1977;9:931-938.<br />
[40] Erdogan F. Stress distribution in bonded dissimilar materials with cracks. Transactions <strong>of</strong> the ASME Series E, Journal <strong>of</strong> Applied<br />
Mechanics 1965;32:403-410.<br />
[41] Ikeda T, Miyazaki N. Mixed mode fracture criterion <strong>of</strong> interface crack between dissimilar materials. Engineering Fracture Mechanics,<br />
1998;59(6):725-735.<br />
[42] Sih GC, Paris PC, Irwin GR. On cracks in rectilinearly anisotropic bodies. Int J Fracture Mechanics 1965;1:189-203.<br />
[43] Matsubara G, Ono H, Tanaka K. Mode II fatigue crack growth from delamination in unidirectional tape and satin-woven fabric laminates<br />
<strong>of</strong> high strength GFRP. International Journal <strong>of</strong> <strong>Fatigue</strong> 2006;28:1177-1186.<br />
[44] Matsubara G, Nishikawa H, Nihei K, Tanaka K. Mode-Mixty Effect on Growth Behavior <strong>of</strong> Interlaminar <strong>Fatigue</strong> Cracks in High Strength<br />
GFRP. Trans. Japan Society for Mechanical Engineers, 2004;70A:1733-1740.<br />
[45] Bascom WD, Gweon SY. Fractograpy and failure mechanicms <strong>of</strong> carbon fiber-reinforced <strong>composite</strong> materials. In: Roulin-Moloney AC,<br />
editor. Fractography and failure mechanism <strong>of</strong> polymers and <strong>composite</strong>s. Elsevier, 1988, pp.351-385.<br />
[46] Bradley WL. Relationship <strong>of</strong> matrix toughness to interlaminar fracture toughness. In: Friedrich K, editor. Application <strong>of</strong> fracture<br />
mechanics to <strong>composite</strong> materials. Elsevier, 1989. pp.159-187.
Experimental analysis and modelling <strong>of</strong> fatigue <strong>behaviour</strong> <strong>of</strong><br />
thick woven laminated <strong>composite</strong>s<br />
Abstract<br />
P Nimdum *, J Renard †<br />
Centre des matériaux P. M. Fourt, Mines-Paris Tech, CNRS UMR 7633, BP 87, F-91003 Evry, Cedex<br />
The objective <strong>of</strong> this work was to analyze the fatigue <strong>behaviour</strong> and the damage development in unidirectional and<br />
angle-ply 2/2 twill weave T800 carbon/epoxy woven fabric <strong>composite</strong> laminates. <strong>Fatigue</strong> tensile-tensile tests were<br />
performed and internal damage has been observed by using camera and optical microscope during testing. The<br />
experimental results show that the damage evolution can be characterized by two or three stages according to the 0 o ply<br />
and angle-ply laminates respectively. This evolution is correlated with damage mechanisms. Micromechanical<br />
three-dimensional finite element models <strong>of</strong> the twill weave woven fabric are proposed. Numerical simulations exhibit that<br />
the local bending <strong>of</strong> the thread induces local stress and strain gradients in the warp yarns in the vicinity <strong>of</strong> fill yarns<br />
curvature. Finally numerical results are correlated with experimental observation <strong>of</strong> damage mechanisms in 0 o ply<br />
laminate and experimental global stiffness reduction (20–25%) has been compared with numerical prediction. An original<br />
fatigue criterion for onset delamination during fatigue <strong>loading</strong> <strong>of</strong> angle-ply laminates has been proposed. This criterion is<br />
based on average values <strong>of</strong> the components <strong>of</strong> the stress field. Identification <strong>of</strong> the different parameters <strong>of</strong> this criterion<br />
has been made with experimental Edge Delamination Tests (EDT). Validation was made with tensile fatigue tests<br />
performed on angle-ply textile laminates with drilled circular hole. Further numerical predictions are in good agreement<br />
with experimental results.<br />
Keywords: delamination; woven <strong>composite</strong>; twill 2/2; thick <strong>composite</strong>; damage<br />
1. Introduction<br />
Composite materials have been widely used in high performance structures especially in automobile,<br />
wind turbine blades, marine industries, aircrafts, sports equipment, railway structure, etc. However, the<br />
application <strong>of</strong> unidirectional <strong>composite</strong>s has several drawbacks such as impact resistance and tolerance<br />
in presence <strong>of</strong> a delamination. Therefore, the trend for <strong>composite</strong>s applications is <strong>under</strong>going a<br />
transition towards the use <strong>of</strong> textile <strong>composite</strong>, also known as “woven fabric <strong>composite</strong>s”. These<br />
materials present various attractive [1-3] since it provides improved impact resistance, better in<br />
out-<strong>of</strong>-plane mechanical properties and improved damage tolerant in the presence <strong>of</strong> the delamination<br />
due to the non-planar interply structure <strong>of</strong> woven fabric <strong>composite</strong>s. Nevertheless, the stiffness and<br />
strength <strong>behaviour</strong> <strong>of</strong> woven fabric <strong>composite</strong>s are dependent on many parameters such as the<br />
characteristics <strong>of</strong> fibers and matrix and weave architecture [4] (weave type, packing density <strong>of</strong> yarns,<br />
undulation angle etc.).<br />
* E-mail address: pongsak.nimdum@ensmp.fr<br />
† E-mail address: jacques.renard@ensmp.fr
210<br />
Fifth International Conference on <strong>Fatigue</strong> <strong>of</strong> Composites<br />
Thus, the woven carbon fabric/epoxy <strong>composite</strong> laminates present all their interest. The purpose <strong>of</strong><br />
this work is to first present the damage mechanisms and to focus on the correlation between damage<br />
accumulation and mechanical property. Then, the finite element method (FEM) is applied for<br />
representing the failure mechanism and mechanical damage. Finally, we shall propose a criterion for<br />
onset <strong>of</strong> delamination <strong>under</strong> cyclic <strong>loading</strong> extended from a static criteria.<br />
2. Experimental procedure<br />
2.1 Material<br />
The <strong>composite</strong> material <strong>of</strong> this study was carried out on carbon (T800)/epoxy <strong>composite</strong> material.<br />
The carbon fiber density was 12.81 g/cm 3 . The diameter <strong>of</strong> carbon fiber is equal 7 m. This study<br />
focuses on woven fabrics <strong>composite</strong>s which the interlacing <strong>of</strong> the fill and warp yarns was formed<br />
according to the 2/2 twill weave pattern as show in Fig. 1 with 0.65 mm for one ply thickness and the<br />
resulting fiber volume fraction V = 52.<br />
9%<br />
. The presence <strong>of</strong> weave structure induces very specific<br />
f<br />
physical phenomena. Therefore, first we study on woven 0 o -ply laminate i.e. each ply <strong>of</strong> laminate is<br />
similar orientation and then we study on woven angle-ply laminates ((0 o ,±20 o )s, (0 o ,±20 o 2)s, (0 o ,±30 o )s<br />
and (0 o , ±30 o 2)s).<br />
In case <strong>of</strong> woven 0 o -ply laminate, twill 2/2 weave has the same number <strong>of</strong> yarns in both directions<br />
such as fill ( x1 ) and warp ( x2 ) direction to provide balanced bi-directional properties in fabric plane.<br />
Fig. 2 shows the schema <strong>of</strong> woven fabrics. The unit cell is a square and composed <strong>of</strong> 4x4 yarns<br />
corresponding to about 9.2x9.2 mm. For this study, we perform on a thick <strong>composite</strong> consisting <strong>of</strong><br />
several layers, this result that many different patterns were occurred in 0 o -ply laminates. In order to<br />
simplify in this study, we can classify in three significant cases such in-phase (IP), out-<strong>of</strong>-phase (OP)<br />
and intermediate phase (T90) (Fig. 2).<br />
In the case <strong>of</strong> angle-ply woven laminates, each ply is supposed to be a homogenous material.<br />
Fig. 1. (a) Scheme <strong>of</strong> the 2x2 twill weave architecture; (b) three elements <strong>of</strong> woven fabrics; (c) weave architecture – top view and (d) unit cells.
P Nimdum, J Renard. / Experimental analysis and modelling <strong>of</strong> fatigue <strong>behaviour</strong> <strong>of</strong> thick woven laminated <strong>composite</strong>s<br />
Fig. 2. Different pattern possibilities in woven 0 o -ply laminates: (a) in-phase (IP); (b) out-<strong>of</strong>-phase (OP) and (c) T90.<br />
2.2 Experimental procedure<br />
<strong>Fatigue</strong> tension-tension <strong>loading</strong> was applied on hydraulic testing system (Fig. 3a). We chose to<br />
perform a load control mode. Axial extensometer is used to measure the longitudinal elongation. The<br />
changes in load and longitudinal displacement during fatigue tests are recorded.<br />
It is assumed that the material <strong>behaviour</strong> is linear to avoid strain rate effects consideration (or<br />
frequency effect). <strong>Fatigue</strong> tension-tension tests was performed with: (i) the difference <strong>of</strong> maximum<br />
applied stress ( max<br />
) from which woven 0 o -ply laminate will be performed at . 3<br />
R<br />
0 . 7<br />
R while woven angle-ply laminates will be performed at . 4<br />
R<br />
211<br />
0 , 0 . 5<br />
R and<br />
0 , 0 . 5<br />
R and 0 . 6<br />
R where R<br />
is the ultimate stress ; (ii) the ratio minimum to maximum stress (R), also called the load ratio, in a cycle<br />
was 0.1, (ii) the frequency (f) is 1 Hz, and (iii) all tests are performed at room temperature.<br />
(a) (b)<br />
Fig. 3. Experimental setup: (a) hydraulic machine; (b) pr<strong>of</strong>ile <strong>of</strong> tensile-tensile fatigue tests.<br />
All specimens were cut from plates using the diamond wheel saw and were bonded with glass/epoxy<br />
or aluminium tabs onto each specimen end. During fatigue tests, the specimen surface (length 65 mm) is<br />
recorded at <strong>loading</strong> less than the maximum applied stress (Fig. 3b) with a digital CCD camera <strong>under</strong><br />
white light illumination.<br />
3. Experimental analysis <strong>under</strong> fatigue <strong>loading</strong><br />
3.1 Experimental analysis on 0 o -ply laminates<br />
3.1.1 Damage mechanism
212<br />
Fifth International Conference on <strong>Fatigue</strong> <strong>of</strong> Composites<br />
Fig. 4-6 shows that the main fatigue damage mechanisms are ply-cracking, also called transverse<br />
cracking, (see “a” in Fig. 4) and the intralaminar delamination (see “b” in Fig. 4). Generally, these<br />
delaminations are initiated at the edges <strong>of</strong> the specimen (“a” in Fig. 5). However, the observation <strong>of</strong><br />
surface perpendicular to <strong>loading</strong> direction using ZEISS optical microscopy, show that intralaminar<br />
delamination does not only appear at free edges, but also inside <strong>of</strong> the specimens where the adjacent<br />
fills yarns bundles meet (see “c” in Fig. 6). These delaminations increase with the number <strong>of</strong> cycles (see<br />
“b” in Fig. 5 and 6). It should be noted that the delaminations propagate following a curved yarn and<br />
then interface between neighbouring yarns (warp/warp, warp/fill and fill/fill). This result corresponds<br />
with the final failure surface showing that most layers have been separated by intralaminar<br />
delaminations developed upon the interface <strong>of</strong> yarns without crossing them.<br />
Fig. 4. Types <strong>of</strong> damages during fatigue tests: (a) OP case at ζmax = 0.5ζR;<br />
(b) IP case at ζmax = 0.5ζR and (c) second form <strong>of</strong> IP case at ζmax = 0.7ζR.<br />
Fig. 5. <strong>Fatigue</strong> damage progression in woven 0 o -ply laminates.<br />
Fig. 6. Intralaminar delamination and its progression path on free-edge and inside surface <strong>of</strong> specimen.
P Nimdum, J Renard. / Experimental analysis and modelling <strong>of</strong> fatigue <strong>behaviour</strong> <strong>of</strong> thick woven laminated <strong>composite</strong>s<br />
With increasing <strong>of</strong> number <strong>of</strong> plies, intralaminar delamination will become more significant and<br />
earlier to occur (“a” for OP case and “b” for IP case in Fig. 7). On the other hand, transverse cracks are<br />
still locally in the surface layer <strong>of</strong> the specimen and their density remains relatively low.<br />
The observations show that for different maximum applied stress the fatigue damage mechanisms are<br />
identical with more rapidly damage evolution when the maximum applied stress increases.<br />
Fig. 7. Damage mechanisms in 4 layers . (<strong>Fatigue</strong> <strong>loading</strong> at ζmax = 0.7ζR)<br />
3.1.2 Damage evolution and stiffness degradation in 0 o -ply laminates<br />
If we consider the damage mechanism versus the number <strong>of</strong> cycles, we found that the damage<br />
evolution can be divided into two steps: (i) the initial damage with a threshold number <strong>of</strong> cycles depend<br />
on the pattern <strong>of</strong> neighbours layers (IP, OP and T90), the maximum applied stress and the number <strong>of</strong><br />
plies (thickness effect) (ii) then, a rapid increase in density damages and then (iii) finally, saturation <strong>of</strong><br />
damage density until ending <strong>of</strong> specimen fracture.<br />
If we now considered the stiffness reduction due to damage evolution as a function <strong>of</strong> number <strong>of</strong><br />
cycles, we can identify three stages (Fig. 8) (i) a stage I in which a rapid stiffness reduction. This stage<br />
corresponds to the delaminations onsets, the multiplication <strong>of</strong> delaminations until their saturation<br />
density and then (ii) a slow decrease stiffness reduction to nearly stabilization. The results <strong>of</strong><br />
experimental observation show that the regions <strong>of</strong> intersection <strong>of</strong> two fills yarn, also called out-<strong>of</strong>-phase<br />
regions, are a preferential position for intralaminar delamination onset.<br />
The fatigue tests in woven 0 o -ply laminates with 2, 4, 7 layers for different maximum applied stress<br />
show that the effect <strong>of</strong> the thickness for damage density can be neglected when the number <strong>of</strong> plies is<br />
greater than four (n > 4) (Fig. 9). The initiation and progression <strong>of</strong> damages are more rapidly for<br />
thin-plies. Nevertheless, all specimens give close to saturation level <strong>of</strong> damage density. Reasonably,<br />
with increasing maximum applied stress, the saturation density state is still similar but it is reached<br />
more quickly due to the initiation <strong>of</strong> damages and their progress are more rapidly.<br />
The reduction <strong>of</strong> rigidity is still related to the damage evolution. In stage II <strong>of</strong> quasi-stability state <strong>of</strong><br />
stiffness reduction in which a stiffness reduction <strong>of</strong> 20-25% occurs whatever the thickness and the<br />
maximum applied stress.<br />
It can be seen that the correlation between transverse cracking density and intralaminar delamination<br />
density is given. The numerical results, more detail in next section (§4.3), allow to deduce that the onset<br />
<strong>of</strong> intralaminar delamination <strong>of</strong>ten leads to the transverse cracking.<br />
213
214<br />
Fifth International Conference on <strong>Fatigue</strong> <strong>of</strong> Composites<br />
Fig. 8. Normalised stiffness property and damage evolution <strong>of</strong> woven 0 o -ply laminates as a function <strong>of</strong> number <strong>of</strong> cycles.<br />
(a) (b)<br />
Fig. 9. Damage density as a function <strong>of</strong> number <strong>of</strong> cycles for different layer at ζmax = 0.7ζR: (a) transverse cracking density (df) and (b)<br />
intralaminar delamination density (dd).<br />
3.2 Experimental analysis on angle-ply laminates<br />
3.2.1 Damage mechanism<br />
We now consider the case <strong>of</strong> the woven angle-ply laminates, ( 0,<br />
20n<br />
) s and ( 0<br />
, 30n<br />
) s with n =<br />
1 and 2. In generally, due to edge effect lead to free-edge stress singularity at interface <strong>of</strong> adjacent layers<br />
and result in the onset <strong>of</strong> delamination, also called interlaminar delaminattion. First, the experimental<br />
results illustrate the onset delamination at interface + 20 n<br />
/ - 20n<br />
and + 30 n<br />
/ - 30n<br />
(Fig. 10).<br />
These delaminations are not straight (plan) but bended. They propagate to follow the interface <strong>of</strong><br />
adjacent yarns and the crimp yarns. These delaminations are considered as shear mode (mode II and III).<br />
Then when the number <strong>of</strong> cycles increases, another mode <strong>of</strong> delamination appeared at the other<br />
interfaces <strong>under</strong> a mixed-mode <strong>of</strong> delamination. This result is also a good correlation with static tensile<br />
test [5]. It should be noted that this study is only interest in the delamination onset.
P Nimdum, J Renard. / Experimental analysis and modelling <strong>of</strong> fatigue <strong>behaviour</strong> <strong>of</strong> thick woven laminated <strong>composite</strong>s<br />
3.2.2 Stiffness degradation<br />
Fig. 10. Damage mechanism at ζmax = 0.6ζR versus number <strong>of</strong> cycles in (0 o ,±30)S laminate<br />
After the interlaminar delamination appeared, we investigate on stiffness degradation and find that<br />
the modulus decrease can be divided into three stages (Fig. 11): (i) initial region (stage I) with a slightly<br />
decrease stiffness reduction <strong>of</strong> about 2.5%. However, we note that the precision <strong>of</strong> stiffness reduction<br />
measurement related with the observation techniques and then, (ii) an intermediate region (stage II), in<br />
which an additional about 10% stiffness reduction occurs in an approximately linear fashion with<br />
respect to the number <strong>of</strong> cycles. Predominant damage mechanisms are the multiplication and<br />
development <strong>of</strong> interlaminar shear delaminations and (iii) the final region (stage III) with a rapid<br />
decrease <strong>of</strong> stiffness (about 40%), and then the stiffness reduction become unstable and lead to the final<br />
failure <strong>of</strong> specimen. Note that increasing <strong>of</strong> max only accelerates to the stiffness degradation (Fig.<br />
12).<br />
Fig. 11. Stiffness degradation as a function <strong>of</strong> number <strong>of</strong> cycles<br />
215
216<br />
3.2.3 Delamination onset<br />
Fifth International Conference on <strong>Fatigue</strong> <strong>of</strong> Composites<br />
(a) (b)<br />
Fig. 12. Stiffness degradation for different ζmax (to compare with ζR) as a function <strong>of</strong> number <strong>of</strong> cycles :<br />
(a) (0 o ,±20)S laminate and (b) (0 o ,±30)S laminate<br />
In order to propose the criterion for prediction the onset <strong>of</strong> delamination <strong>under</strong> fatigue <strong>loading</strong>, we<br />
need to determine the relationship among the maximum applied stress ( max ), onset <strong>of</strong> delamination<br />
stress <strong>under</strong> tensile <strong>loading</strong> test ( onset ) and the number <strong>of</strong> cycles to delamination onset ( N a ). Then, in<br />
this study we use four stacking sequences (two different families <strong>of</strong> laminates each family has two<br />
different thicknesses). By experimental results, the number <strong>of</strong> cycles to delamination onset as a function<br />
<strong>of</strong> the ratio <strong>of</strong> max to onset is illustrated in Fig. 13. If the ratio <strong>of</strong> max to onset is increase, the<br />
early delamination onset is observed. In order that compatible with static test, the ratio <strong>of</strong> max to<br />
onset is equal to 1, is taken into account. To determine by curve fitting to experimental results (Fig. 13),<br />
the nonlinear relation between ratio <strong>of</strong> max to onset and N a can then be expressed as<br />
<br />
<br />
max<br />
R<br />
=<br />
( K )<br />
K<br />
-(<br />
N -1)<br />
2<br />
1<br />
where K 1 and K 2 are two constant parameters, these parameters are independent<br />
on i.e. the stacking sequence and number <strong>of</strong> plies (thickness) but depend on the <strong>composite</strong> material<br />
study.<br />
This expresion allow to propose the fatigue delamination onset criterion base on quasi-static<br />
delamination onset criterion in previous research [5].<br />
Fig. 13. A number <strong>of</strong> cycles to delamination onset (Na) in different stacking sequences
4. FEM analysis<br />
4.1 Configuration<br />
P Nimdum, J Renard. / Experimental analysis and modelling <strong>of</strong> fatigue <strong>behaviour</strong> <strong>of</strong> thick woven laminated <strong>composite</strong>s<br />
In first part (§4.2), the 3D finite element model <strong>of</strong> the twill-weave unit cell consists <strong>of</strong> three-phases<br />
(Fig. 14): the matrix phase, the warp and fill yarns. This 3D-mesh taken into account the effects <strong>of</strong> yarns<br />
interlacing and orientation <strong>of</strong> adjacent layers, the geometry <strong>of</strong> yarns in woven structure is measured<br />
directly using optical microscopy observation (Table 1.). Note that due to the complicated structure <strong>of</strong><br />
weave-fabric, in particularly for crimp region, hence many numbers <strong>of</strong> finite elements are required.<br />
Fig. 14. 3D finite element mesh.<br />
Table 1. Parameters characterizing the twill-weave geometry (variables are defined in Fig. 14 dimensions in mm)<br />
a=b c R<br />
9.2 0.65 4.15<br />
The mechanical response <strong>of</strong> a yarn is determined and validated by tensile tests. The yarn (straight<br />
region) was assumed transversely isotropic and linear elastic and is given in Table 2, while the property<br />
<strong>of</strong> the epoxy matrix is isotropic elastic with Young's modulus equal to 3.1 GPa and Poisson‟s ratio equal<br />
to 0.39.<br />
However, the second part (§4.3), the 3D finite element model <strong>of</strong> woven ply (heterogeneous periodic<br />
material) are took place by equivalent homogenous ply. Their material behavior determined by<br />
homogenization method, as detailed in section 4.2 and 4.3, is show in Table 3. The mesh near the<br />
interface corner <strong>of</strong> free-edge is refined in order to represent the stresses singularity due to the free-edge<br />
effect.<br />
Table 2. Mechanical properties <strong>of</strong> a fill and a warp yarn T800s where 1 refers to the fiber direction; 2 refer to transversal direction <strong>of</strong> fiber<br />
E11 (GPa) E22 = E33 (GPa) G23 (GPa) G12 = G13 (GPa) v23 v12 = v13<br />
210.00 9.250 3.7 4.7 0.25 0.33<br />
Table 3. Mechanical properties <strong>of</strong> an equivalent homogeneous ply <strong>of</strong> twill-woven fabrics<br />
E11= E22 (GPa) E33 (GPa) G23=G13 (GPa) G12 (GPa) v23 = v13 v12<br />
60.53 7.795 2.685 3.231 0.489 0,03<br />
4.2 Numerical analysis <strong>of</strong> damage mechanism<br />
In order to study the effect <strong>of</strong> curved shape <strong>of</strong> the reinforcing yarns (weaving structure effect) and<br />
adjacent layers, also called ply nesting effect, 3D finite elements model <strong>of</strong> two layers <strong>of</strong> twill woven<br />
36<br />
217
218<br />
Fifth International Conference on <strong>Fatigue</strong> <strong>of</strong> Composites<br />
0 o -ply laminate <strong>under</strong> tensile <strong>loading</strong> in the fill direction with periodic boundary condition (see in Eq.(1))<br />
are applied. The computational results demonstrate that the weaving structure effect provoke the local<br />
bending due to the fill yarn bundles try to straighten. Moreover, the presence <strong>of</strong> neighboring layers<br />
affects to change the local bending direction along the x 3<br />
-axis. The deformed <strong>of</strong> local symmetrical<br />
bending occurred in case <strong>of</strong> out-<strong>of</strong>-phase, otherwise non-symmetrical occurred in case <strong>of</strong> in-phase and<br />
T90 (Fig. 15). These results are a good correlation with the experimental observations in previous<br />
section.<br />
(a) (b) (c)<br />
Fig. 15. Deformed mesh <strong>of</strong> 3D finite element model <strong>under</strong> un<strong>loading</strong> and <strong>loading</strong>: (a) in-phase; (b) out-<strong>of</strong>-phase and (c) T90.<br />
Moreover, the local bending provokes local stress (or strain) concentrations which depend on the ply<br />
nesting. The main purpose <strong>of</strong> this paper is to be interested by investigation <strong>of</strong> out-<strong>of</strong>-phase case since<br />
the damage mechanisms are earlier to occur and in consequence a rapid decrease <strong>of</strong> stiffness. Fig. 16<br />
shows that high strain 11 occurred in the matrix phase and warp yarns nearly the region <strong>of</strong> undulation<br />
<strong>of</strong> fill yarns, while, the shear strains<br />
23 and 31 remain relatively homogeneous. On the other hand,<br />
non homogeneous strain 33 distribution can be observed with this maximum strain nearly the region<br />
<strong>of</strong> adjacent fill yarns meet. Besides that increasing <strong>of</strong> maximum 33 can be induced with increasing <strong>of</strong><br />
the number <strong>of</strong> plies. Nevertheless, if woven 0 o -ply laminate is more than four-layers ( n 4 ), the<br />
thickness effect can be neglected.<br />
Fig. 16. Stress-strain distribution on out-<strong>of</strong>-phase case.
P Nimdum, J Renard. / Experimental analysis and modelling <strong>of</strong> fatigue <strong>behaviour</strong> <strong>of</strong> thick woven laminated <strong>composite</strong>s<br />
4.3 Degradation in 0 o -ply laminates<br />
In this section we investigate each damage mechanism, considering at critical or saturation <strong>of</strong> damage<br />
density, affect on the macroscopic mechanical <strong>behaviour</strong> <strong>of</strong> the material. Fig. 6 was used to describe the<br />
geometry <strong>of</strong> damage to provide the determination <strong>of</strong> degradation <strong>of</strong> material due to intralaminar<br />
delamination by using 3D finite elements method which enable to simulate the delamination developed<br />
in the resin epoxy and at the interface <strong>of</strong> adjacent yarns (Fig. 17). The numerical homogenization<br />
procedure is used to determine the global mechanical properties and the periodic boundary conditions in<br />
<br />
x - x direction were applied. We assume small deformation assumption, therefore the volume<br />
1<br />
2<br />
variation is quietly small. The microscopic stress Σ ij<br />
~ and strain E ij<br />
~ tensors must be the averages <strong>of</strong> the<br />
microscopic corresponding quantities (see in Eq.(1)). In order to simplify the study, we are also assumed<br />
that the macroscopic behavior is isotropic in longitudinal and transverse ( x1 and x , 2<br />
<br />
respectively).<br />
Besides, this study neglects the friction contact problem when intralaminar delamination appeared.<br />
div<br />
= 0<br />
<br />
= c:<br />
on <br />
<br />
u = E <br />
. x + v with v x1-x2 periodic<br />
<br />
u = E <br />
. x or t = <br />
<br />
. n on in x3<br />
direction<br />
<br />
<br />
.<br />
n x1-x2 anti-periodic on <br />
<br />
<br />
<br />
= Σ or = E<br />
Fig. 18 shows the strains fields in unit cell before and after the intralaminar appeared. The good<br />
agreement <strong>of</strong> two approaches in term <strong>of</strong> experimental observation and numerical result for damage<br />
deformed (Fig. 6 and 18). It should to be <strong>under</strong>line that the redistribution <strong>of</strong> strains after delamination<br />
appeared can be observed (Fig. 18b and 18d). The concentration <strong>of</strong> strain on vicinity <strong>of</strong> yarns<br />
33<br />
crimping and nearly at interface <strong>of</strong> two fill yarns and in matrix on vicinity warp yarns inside<br />
11<br />
specimen are vanished, on the other hand, the concentration <strong>of</strong> on warp surface yarns is increased to<br />
11<br />
allow to <strong>under</strong>stand why the transverse cracks appear immediately on surface warp yarns when the<br />
intralamina delamination onset and why their crack is never appeared inside the specimen.<br />
Consequently, a good agreement <strong>of</strong> two damages developed can be observed as an illustration in<br />
previous section.<br />
(a) (b)<br />
Fig. 17. (a) Intralaminar delamination embedded in matrix, fill and warp yarns and (b) mesh configuration <strong>of</strong> intralaminar delamination<br />
219<br />
(1)
220<br />
Fifth International Conference on <strong>Fatigue</strong> <strong>of</strong> Composites<br />
(a) (b)<br />
(c) (d)<br />
Fig. 18. Strains fields: ε11 before (a) and after (b) intralaminar delemination onset. ε33 before (c) and after (d) intralaminar delemination onset.<br />
The numerical results provide to determine the elastic coefficients <strong>of</strong> homogeneous ply equivalent<br />
with damaged and non-damaged state to be shown in Table 4. The stiffness reduction, both in tensile<br />
and shear modulus by the presence <strong>of</strong> intralaminar delamination are evident. The absence <strong>of</strong> constraint<br />
on local bending movement due to intralamina delamination onset allow the stretching <strong>of</strong> fill yarns<br />
bundle to become easy, in consequence, the stiffness is considerably reduced. The stiffness reduction <strong>of</strong><br />
19.3% is close to experimental results. In order to obviously compare with experimental test, we also<br />
simulated the case <strong>of</strong> transverse cracking. The homogenized response shows that stiffness reduction is<br />
slightly and can be neglect. In summary, the intralaminar delamination is predominant on the stiffness<br />
reduction in woven 0 o -ply laminate.<br />
Macroscopic behavior in unit cell<br />
Table 4. Damages dominants in global stiffness reduction<br />
Non-damage<br />
(GPa)<br />
Damage<br />
(GPa)<br />
E11 60,53 48.854 19.3<br />
E22 60,53 48.854 19.3<br />
E33 7.795 1.487 80.93<br />
G23 2.685 1.068 60.3<br />
G13 2.685 1.068 60.3<br />
G12 3.231 3.14 2.08<br />
4.4 Prediction <strong>of</strong> delamination onset <strong>under</strong> fatigue <strong>loading</strong><br />
4.4.1 Introduction<br />
Stiffness reduction<br />
(%)<br />
In order to predict the fatigue life and degradation in the <strong>composite</strong> material, the three categories in<br />
previous studies are proposed: (i) empirical approach, also so-called macroscopic failure theories [6-8],<br />
base on static strength criteria modified to account for cyclic <strong>loading</strong>; (ii) strength or stiffness<br />
degradation fatigue criteria [9,10] which strength or stiffness are evaluated as a function <strong>of</strong> number <strong>of</strong><br />
cyclic <strong>loading</strong>; (ii) finally actual damage mechanics fatigue theory is base on the modelling <strong>of</strong> intrinsic<br />
defects in the <strong>composite</strong> material [11-14].<br />
The first approach is presented in the empirical method and has found widespread use in fatigue
P Nimdum, J Renard. / Experimental analysis and modelling <strong>of</strong> fatigue <strong>behaviour</strong> <strong>of</strong> thick woven laminated <strong>composite</strong>s<br />
analysis although it does not account for plastic deformation during the cyclic <strong>loading</strong>. This approach is<br />
usually plotted in term <strong>of</strong> S/N diagram where S is the applied cyclic stress and N is the number <strong>of</strong><br />
cycles.<br />
The second approach <strong>of</strong> fatigue life is defined by the modified static failure criteria [15] which take<br />
on a similar form to the Tsai-Hill criterion and can be written:<br />
= <br />
N<br />
1 1<br />
2 2<br />
2 12<br />
1<br />
N + N =<br />
212 N N<br />
where 1 , 2 and 12 are the in-plane normal, transverse and shear stress, respectively. 1 , 2<br />
N<br />
and 12 are the in-plane normal, transverse and shear fatigue strength as a function given in Eq. (3).<br />
R R<br />
Where 1 , 2<br />
respectively.<br />
and<br />
= f ( , R, N)<br />
N R<br />
1 1 1 max<br />
= f ( , R, N)<br />
N R<br />
2 2 2 max<br />
= f ( , R, N)<br />
N R<br />
12 12 12 max<br />
R<br />
12 represent the in-plane normal, transverse and shear static strength,<br />
Final approach describes the evolution <strong>of</strong> material <strong>behaviour</strong> throughout fatigue cyclic <strong>loading</strong> using<br />
damage progressive model. This approach based on damage mechanics is used to model both the<br />
quasi-static and fatigue <strong>loading</strong> by using the variation <strong>of</strong> the state function, also called free energy<br />
function.<br />
The main aim <strong>of</strong> this paper is to propose <strong>of</strong> delamination onset criterion <strong>under</strong> fatigue <strong>loading</strong> base on<br />
the second approach using the strength degradation, or residual strength. In order to simplify the<br />
problem, in this study, stiffness and strength reduction due to intralaminar delamination onset will be<br />
neglected and the equivalent homogenous ply is used with in-plan isotropic <strong>behaviour</strong> (Table 3)<br />
4.4.2 Delamination onset criterion <strong>under</strong> fatigue <strong>loading</strong><br />
The edge effect generally leads to the stress singularities near free-edge interface which occur when<br />
we use the finite element analysis method. Consequently the use <strong>of</strong> local criterion, for delamination<br />
onset depends on the mesh size in the free-edge area. In order to avoid the mesh-dependent <strong>of</strong> finite<br />
element approximation, the delamination onset criterion should not only take account <strong>of</strong> point stress but<br />
also their distributions. As a result, many non-local stress criteria have been developed. We can classify<br />
them into two categories.<br />
The first category <strong>of</strong> criteria [16-19] is based on the average stress, <strong>of</strong>ten using an integral method,<br />
over an area or a line. In this study non-local stress criteria corresponding to the three anti-plane stresses<br />
which are defines as<br />
y0<br />
1<br />
( y ) = ( ) d<br />
(4)<br />
ij 0<br />
ij<br />
y0<br />
0<br />
221<br />
(2)<br />
(3)
222<br />
Fifth International Conference on <strong>Fatigue</strong> <strong>of</strong> Composites<br />
where and represent three local anti-plane stresses and average anti-plane stresses at interface,<br />
ij<br />
ij<br />
respectively. y is the critical length over which three average stresses are determined.<br />
0<br />
Then, the second categories <strong>of</strong> criterions represented the gradient <strong>of</strong> stress singularities using the<br />
weight function which allow to evaluate the weight changes in quantities [20,21]. In this study, we have<br />
been selected based on the average stress and their gradients in the vicinity <strong>of</strong> singular point. The<br />
gradient effect is taken into account by the first order derivative. The non-local stresses are then defined<br />
as:<br />
<br />
ij<br />
if y = 0<br />
<br />
ij = ij ij <br />
(5)<br />
ij<br />
<br />
ij + h ( + + ) if y 0<br />
x y z<br />
where h is characteristic length for taking into account the gradient effect. Note that h depends on the<br />
constituents, their geometries (lamina, woven-fabrics) <strong>of</strong> <strong>composite</strong>s studied.<br />
However, due to the main aim <strong>of</strong> this paper, we will investigate the delamination onset at interface <strong>of</strong><br />
adjacent layers. As a result, we can suppose that the gradient effects have been only evaluated along the<br />
interface. The Eq. (5) can then be rewritten as:<br />
ij if y = 0<br />
<br />
ij = <br />
ij<br />
(6)<br />
<br />
ij + hif y 0<br />
y<br />
To summarize that, the average non-local stresses ( ij<br />
~ ) which take into the effect <strong>of</strong> gradient on a<br />
neighborhood are determined upon the critical length.<br />
The criterion that we proposed to prediction the delamination onset <strong>under</strong> fatigue <strong>loading</strong> is based on<br />
an extension <strong>of</strong> delamination onset criteria <strong>under</strong> quasi-static <strong>loading</strong> [5]. <strong>Fatigue</strong> tests <strong>of</strong> woven-fabrics<br />
angle-ply laminates were performed in previous section. The interface <strong>of</strong> delamination onset and the<br />
number <strong>of</strong> cycles to delamination onset have been recorded. We assume that each ply remains<br />
undamaged until the onset <strong>of</strong> delamination and the interlaminar tensile and shear strength <strong>of</strong> the<br />
interface, which consist <strong>of</strong> three modes (I, II, III) and are determined by static tests, are damaged <strong>under</strong><br />
fatigue <strong>loading</strong>. This degradation is related as a function <strong>of</strong> max , R , N and frequency (f) . The<br />
delamination onset criterion <strong>under</strong> fatigue <strong>loading</strong> is then introduced as:<br />
F3 +<br />
2<br />
F1 + k1 F3 -<br />
2<br />
F2 + k2 F3<br />
-<br />
2<br />
<strong>Fatigue</strong><br />
T ( ,f , , max) <strong>Fatigue</strong><br />
1 ( ,f , , max) <strong>Fatigue</strong><br />
2 ( ,f , , max)<br />
<br />
+ + = 1<br />
Y N R S N R S N R <br />
<br />
In this study, R and f are constant at 0.1 and 1 Hz, respectively, to be able to simplify the equation<br />
above and to be rewritten as:<br />
where<br />
<strong>Fatigue</strong><br />
Y T ,<br />
<strong>Fatigue</strong><br />
S1 and<br />
+<br />
2<br />
-<br />
2<br />
-<br />
2<br />
3 1 + 1 3 2 + 2 3<br />
F F k F F k F <br />
+ + = 1<br />
Y f ( N, ) S f ( N, ) S f ( N,<br />
) <br />
T 1 max 1 2 max 2 3 max <br />
<strong>Fatigue</strong><br />
S 2 represent the intralaminar tensile (mode I) and shear (mode II and<br />
III) strengths <strong>under</strong> cyclic <strong>loading</strong>, respectively, while YT S and S de II and III) are the intralaminar<br />
1<br />
2<br />
(7)<br />
(8)
P Nimdum, J Renard. / Experimental analysis and modelling <strong>of</strong> fatigue <strong>behaviour</strong> <strong>of</strong> thick woven laminated <strong>composite</strong>s<br />
tensile (mode I) and shear (mode II and II) <strong>under</strong> quasi-static, respectively. f N,<br />
) , f N,<br />
)<br />
1(<br />
max<br />
2 ( max<br />
and f N,<br />
) are the degradation function <strong>of</strong> interlaminar strengths as mode I, II and III,<br />
3 ( max<br />
respectively. Assume that three modes are the same rate <strong>of</strong> degradation. In the same way as for static<br />
<strong>loading</strong>, two modes <strong>of</strong> interlaminar shear strength were assumed to be identical ( S )<br />
can then be rewritten as:<br />
+<br />
2<br />
-<br />
2<br />
-<br />
2<br />
3 1 + 1 3 2 + 2 3<br />
F F k F F k F <br />
+ + =<br />
Y S S <br />
T <br />
1<br />
( f( N,<br />
) )<br />
max<br />
2<br />
223<br />
S = . The Eq. (8)<br />
In order to determine the degradation function, woven angle-ply laminate chosen are represented the<br />
predominant shear mode (III) to allow to neglect both mode I and mode II. Consequently, the criteria in<br />
the Eq. (9) can be simplified as:<br />
where 13 is the nonlocal stress,<br />
13<br />
<br />
<br />
S <br />
Non local<br />
= f( N,<br />
)<br />
max<br />
2<br />
(9)<br />
(10)<br />
13 and ~ 13 , at interface <strong>of</strong> delamination onset while S is the<br />
static interlaminar shear strength which are determined by non local method. Due to undamaged and<br />
in-plane isotropic behavior assumption until the delamination onset, it is useful to be able to determine<br />
the relation in Eq. (10) by the experimental results (macroscopic stress), (Fig. 13). The degradation<br />
function <strong>of</strong> interlaminar strength <strong>under</strong> fatigue <strong>loading</strong> is given as:<br />
<br />
S Non local<br />
max<br />
= = f N =<br />
onset Macroscopic<br />
( ) 1,032 N<br />
1<br />
-( -1)<br />
3<br />
By substituting Eq. (11) into Eq. (9), we obtain the criterion for free-edge specimens as:<br />
+<br />
2<br />
-<br />
2<br />
-<br />
2<br />
1<br />
3 1 1 3 2 2 3 -( -1)<br />
3<br />
1,032 N<br />
F F + k F F + k F <br />
+ + =<br />
Y <br />
<br />
T<br />
S S <br />
<br />
In order to apply this criterion in Eq. (10) to circular-hole specimens, the interlaminar tensile and<br />
shear strengths in static case are modified. The transformation <strong>of</strong> coordinates as a function <strong>of</strong> angle <strong>of</strong><br />
is used. is defined as illustrated in Fig. 19. The delamination onset criterion during fatigue<br />
<strong>loading</strong> applied to circular-hole specimens is therefore shown in Eq. (13).<br />
Fig. 19. Configuration <strong>of</strong> circular-hole specimens.<br />
2<br />
(11)<br />
(12)
224<br />
Fifth International Conference on <strong>Fatigue</strong> <strong>of</strong> Composites<br />
+<br />
2<br />
-<br />
2<br />
- -<br />
( F3 ) ( F3 ) F F ( cos + sin ) F F ( cos -sin<br />
)<br />
+ + +<br />
Y S / (2 k ) S / (2 k) S / (2 k)<br />
2 3 1 3<br />
2<br />
T<br />
2 2 2 2<br />
( F ) ( F )<br />
2 2<br />
1<br />
2<br />
2<br />
1<br />
2<br />
-( N -1)<br />
3<br />
1,032<br />
<br />
+ + = <br />
S S <br />
5. Prediction <strong>of</strong> delamination onset in circular-hole specimens<br />
2<br />
This section an overview <strong>of</strong> the experimental tests and numerical simulations in circular-hole<br />
specimens is in order to validate the delamination onset criterion which was identified in previous<br />
section <strong>under</strong> cyclic <strong>loading</strong>.<br />
5.1 Experimental procedure<br />
The specimen geometry for the open hole fatigue test had a hole diameter ( ) <strong>of</strong> 10 mm, a length ( L )<br />
<strong>of</strong> 270 mm and a width ( l ) <strong>of</strong> 30 mm. The maximum applied stress at 0.<br />
6<br />
R<br />
0 , 30<br />
, at 0.<br />
65<br />
R<br />
and ( ) s<br />
max = for ( 2 ) s<br />
0 , 30<br />
and at 0.<br />
7<br />
R<br />
(13)<br />
0 , 20<br />
max = for ( ) s<br />
0 , 20<br />
were<br />
max = for ( 2)<br />
s<br />
preformed. The circular hole specimens polished prior to testing are observed at different number <strong>of</strong><br />
cycles level i.e. 100, 500,1000, 5000, 1000, … etc. with the mirror which allow its to rotate around the<br />
axe (Fig. 20a, 20b). The angle observation ( ) is defined in Fig. 20c. The = 0<br />
is parallel to the<br />
applied load direction.<br />
5.2 Damage mechanism<br />
(a) (b) (c)<br />
Fig. 20. (a) Experimental setup; (b) Scheme <strong>of</strong> observation method; (c) Observation zone defined.<br />
The experimental observations <strong>of</strong> fatigue tests show that all specimens, whether the different<br />
thickness layers and stacking sequences, consist <strong>of</strong> three major damage (Fig. 21): intra-ply cracking<br />
(“a”), the intra-ply delamination (“b”) and finally inter-ply delamination (“c” and “d”). The effect <strong>of</strong><br />
stacking sequence and thickness layer on the typical damages can then be neglected. Several intra-ply
P Nimdum, J Renard. / Experimental analysis and modelling <strong>of</strong> fatigue <strong>behaviour</strong> <strong>of</strong> thick woven laminated <strong>composite</strong>s<br />
cracks firstly occur in the surface yarns. Then, the interlaminar delaminations occur in both interfaces,<br />
and finally their developed will joined with the intralaminar delamination which generally occur to<br />
follow along the curved yarns in ply (lamina).<br />
It should be <strong>under</strong>line that typical damage mode <strong>of</strong> delaminage at the interfaces + 20 /<br />
-20<br />
and + 30 /<br />
-30<br />
is more difficult to observe due to interlaminar shear mode (mode III) representing the<br />
crack edges sliding without open mode. Consequently, the number <strong>of</strong> cycles to delamination onset<br />
determined in experimental testing remains uncertain. Thickness effect is no significant for delaminate<br />
onset location and the number <strong>of</strong> cycles to delamination onset, as shown in Table 5. On the other hand,<br />
we have found to affect significantly on the number <strong>of</strong> cycles to delamination onset with increasing the<br />
maximum stress level.<br />
Stacking sequence Interfaces<br />
(0,±20)S<br />
(0,±202)S<br />
(0,±30)S<br />
(0,±302)S<br />
Table 5. Experimental results during fatigue <strong>loading</strong><br />
Position <strong>of</strong> delamination<br />
onset (α o )<br />
0/+20 92 à 125 2000 – 3000<br />
±20 83 à 97 260 - 700<br />
0/+202 98 - 120 1660 - 3050<br />
±202 84 - 100 125 - 450<br />
0/+30 94 - 121 340 – 800<br />
±30 82 - 100 215 – 600<br />
02/+302 85 - 127 587 - 1250<br />
±302 85 -95 50 – 220<br />
Number <strong>of</strong> cycles to delamination<br />
onset (Nd)<br />
While, the interfaces 0 / + 20<br />
and 0 / + 30<br />
, the delamination occur as a mixed mode<br />
representing not only crack edge sliding but also crack edge opening. The open mode is generally easier<br />
to observe because delaminations propagation, after their initiation, are spontaneous and rapid to allow<br />
clearly visualize.<br />
(a)<br />
(b)<br />
Fig. 21. Damages mechanisms <strong>of</strong> fatigue <strong>loading</strong> for different stacking sequences: (a) (0 o ,±30 o ) at 3000 cycles and (b) (0 o ,±30 o 2)S at 2000 cycles<br />
225
226<br />
Fifth International Conference on <strong>Fatigue</strong> <strong>of</strong> Composites<br />
5.3 Delamination onset prediction: location and number <strong>of</strong> cycles<br />
In order to carry out an in-depth <strong>under</strong>standing <strong>of</strong> damage mechanisms at edge <strong>of</strong> circular hole, the<br />
finite element method has been use. A uniform tensile stress, also called the macroscopic stress<br />
simulated, was applied along the direction <strong>of</strong> x1 -axis (longitudinal axis) <strong>of</strong> circular test specimen. All<br />
specimens show that the same regions <strong>of</strong> stress/strain distributions are illustrated. Fig. 22, in case <strong>of</strong><br />
, 20<br />
) s laminate, shows high concentrations <strong>of</strong> 11 and 11<br />
( 0 <br />
can be observed at = 90<br />
around free-edge and nearly circular area (Fig. 22a). Then we can also observe the strong stress<br />
singularities <strong>of</strong> 33,<br />
23 and 13 at the interface between adjacent layers as shown in Fig. 22b, c<br />
and d, respectively. These stresses relate directly to the delamination onset as explained in previous<br />
section.<br />
(a) (b)<br />
(c) (d)<br />
Fig. 22. Distributions <strong>of</strong> stress-strain for (0 o ,±20 o )S laminates around a free-edge and nearly circular hole area (-90 o ≤α≤90 o ) (0 o ,±20 o )S:<br />
(a) ε11; (b) ζ33; (c) ζ23; and (d) ζ13.<br />
The numerical results <strong>of</strong> all stacking sequences <strong>of</strong> a laminate <strong>composite</strong> show the good accuracy <strong>of</strong><br />
location predictions to delamination onset compared with the experimental results, as example illustrate<br />
in Fig. 23 for ( 0 , 30)<br />
s laminate case. The two approaches criterion, with and without gradients,<br />
predict to the same location <strong>of</strong> delamination onset. The numerical results show also a good correlation<br />
in term <strong>of</strong> damage mode (I, II and III) with experimental results.<br />
For the prediction <strong>of</strong> number <strong>of</strong> cycles to delamination onset, there is a good correlation between the<br />
numerical results and experimental observations. The close predictions obtained for 0 / 20<br />
and<br />
0 / 30<br />
interfaces while the slight prediction error <strong>of</strong> + 20 /<br />
-20<br />
and + 30 /<br />
-30<br />
interfaces can<br />
be found (Table 6). We suppose that the slight prediction error is caused by a typical mode III-type <strong>of</strong><br />
delamination onset which is dominant in these interfaces. Consequently, this mode <strong>of</strong> delamination<br />
onset is more difficult to observe due to the closing mode. To overcome this problem, high accuracy<br />
observation techniques like acoustic emission are necessary.
P Nimdum, J Renard. / Experimental analysis and modelling <strong>of</strong> fatigue <strong>behaviour</strong> <strong>of</strong> thick woven laminated <strong>composite</strong>s<br />
Stacking sequence Interfaces<br />
(0,±20)S<br />
(0,±202)S<br />
(0,±30)S<br />
(0,±302)S<br />
Table 6. Numerical result for prediction <strong>of</strong> delamination onset <strong>under</strong> fatigue <strong>loading</strong><br />
Numerical results <strong>of</strong> number <strong>of</strong> cycle to delamination onset<br />
h = 0,0 h = 0,01 h = 0,02 h = 0,03<br />
0/+20 3280 3800 10800 11500<br />
+20/-20 150 600 2100 2900<br />
0/+202 3200 3700 9010 9600<br />
+202/-202 0 18 350 560<br />
0/+30 250 450 2000 2400<br />
+30/-30 17 135 375 650<br />
02/+302 370 600 1950 2350<br />
+302/-302 0 0 2 15<br />
(a)<br />
(b)<br />
(c)<br />
Fig. 23. Delamination onset in (0 o ,±30 o )S laminate around a free-edge circular hole: (a) experimental observed; (b) and (c) numerical prediction<br />
at interface 0 o /30 o and +30 o /-30 o , respectively<br />
6. Conclusions<br />
An experimental investigation and FEM in two families, unidirectional and angle-ply 2/2 twill weave<br />
227
228<br />
Fifth International Conference on <strong>Fatigue</strong> <strong>of</strong> Composites<br />
T800 carbon/epoxy woven fabric <strong>composite</strong>s laminates, <strong>under</strong> fatigue <strong>loading</strong> have been presented in<br />
this paper. This study can be summarized as follow:<br />
(1) Unidirectional woven fabric <strong>composite</strong> laminates:<br />
Effect <strong>of</strong> thickness ( n 4 ) for variation <strong>of</strong> rigidities, the thresholds <strong>of</strong> damage in 0 o -ply<br />
laminate is neglect;<br />
Increasing the maximum applied stress accelerates the stiffness reduction and the damage<br />
evolution;<br />
The cracking in warp yarn and the intralaminar delamination are the major damage;<br />
The numerical simulation with FEM was used to investigate the woven effects on the<br />
out-<strong>of</strong>-phase case and show that the local bending provokes the local stress (or strain)<br />
concentrates which have a good correlation with the damage zone in experimental observation;<br />
The homogenization methods applied to the damaged material show that the stiffness reduction<br />
<strong>of</strong> 20% is caused by the delamination. This result is a good agreement with experimental<br />
testing.<br />
(2) Angle-ply woven fabric <strong>composite</strong> laminates:<br />
Due to the high interlaminar normal and interlaminar shear stress gradients at the free-edge<br />
region, the inter-ply delamination represent as the main damage to allow the stiffness reduction<br />
and final break. Increasing <strong>of</strong> number <strong>of</strong> plies (thickness effect) does not affect to the damage<br />
mechanism;<br />
The fatigue non-local criteria model (with and without gradient), which are identified the<br />
parameters by experimental Edge Delamination Tests (EDT), have been proposed to predict<br />
the delamination onset and to overcome the mesh-dependence problems;<br />
Validation criteria was applied on the circular-hole specimens and shown a good prediction the<br />
position <strong>of</strong> delamination onset. For the prediction <strong>of</strong> number <strong>of</strong> cycles to delamination onset,<br />
the close predictions obtained for 0 / 20<br />
and 0 / 30<br />
interfaces while the slight prediction<br />
error <strong>of</strong> + 20 /<br />
-20<br />
and + 30 /<br />
-30<br />
interfaces can be found due to precision error which<br />
occurs from the difficult observation <strong>of</strong> delamination onset in shear mode.<br />
We propose high accuracy observation techniques like the acoustic emission which allow more<br />
accurate monitoring and early detection <strong>of</strong> decohesion or slipping in shear mode within the material.<br />
Emission acoustic technique has many advantages such as in situ monitoring without removing the<br />
specimen and accuracy <strong>of</strong> damage detection. But the difficulty is to correlate between the acoustic<br />
signals and the typical damages.<br />
Acknowledgments<br />
We gratefully acknowledge ADEME (Agence de l‟Environnement et de la Maîtrise de l‟Energie) for<br />
support from ARMINES Centre des Matériaux, in the project LICOS and ALSTOM.
References<br />
P Nimdum, J Renard. / Experimental analysis and modelling <strong>of</strong> fatigue <strong>behaviour</strong> <strong>of</strong> thick woven laminated <strong>composite</strong>s<br />
[1] Nicoletto, G. et Riva, E., “Failure mechanisms in twill-weave laminates: FEM predictions vs. experiments”, Composites: Part A, vol. 35, p.<br />
787-795, 2004.<br />
[2] Kelkar, A.D., Tate, J.S. et Bolick, R., “Structural integrity <strong>of</strong> aerospace textile <strong>composite</strong>s <strong>under</strong> fatigue <strong>loading</strong>”, Material Science and<br />
Engineering B, vol. 132, p. 79-84, 2006.<br />
[3] Alif, N., Carlsson, L.A., et Boogh, L., “The effect <strong>of</strong> weave pattern and crack propagation direction on mode I delamination resistance <strong>of</strong><br />
woven glass and carbon <strong>composite</strong>s”, Composites:Part B, vol. 29B, p. 603-611, 1998.<br />
[4] Pandita, S. D., Huvsmans, G., Wevers, M., et Verpoest, I., “Tensile fatigue <strong>behaviour</strong> <strong>of</strong> glass plain-weave fabric <strong>composite</strong>s in on- and<br />
<strong>of</strong>f-axis directions”, Composites: Part A, vol. 32, p. 1533-1539, 2001.<br />
[5] Pongsak, N., “Dimensionnement en fatigue des structure ferroviaire en <strong>composite</strong>s épais”, PhD thèse, Ecole des Mines de Paris, 2009.<br />
[6] Fawaz, Z et Ellyin, F., “<strong>Fatigue</strong> failure model for fibre-reinforced materials <strong>under</strong> general <strong>loading</strong> conditions”, Journal <strong>of</strong> Composite<br />
Materials, vol. 28(15), p. 1432-1451, 1994.<br />
[7] Demers, C.E., “Tension-tension axial fatigue <strong>of</strong> E-glasse fibre-reinforced polymeric <strong>composite</strong>s : fatigue life diagram”, Construction and<br />
Building Materials, vol. 12, p. 303-310, 1998.<br />
[8] Bond, I.P., “<strong>Fatigue</strong> life prediction for GRP subjected to variable amplitude <strong>loading</strong>”, Composites: Part A, vol. 30, p. 961-970, 1999.<br />
[9] Philippidis, T.P. et Vassilopoulos, A.P., “<strong>Fatigue</strong> <strong>of</strong> <strong>composite</strong> laminates <strong>under</strong> <strong>of</strong>f-axis <strong>loading</strong>”, International Journal <strong>of</strong> <strong>Fatigue</strong>, vol. 21,<br />
p. 253-262, 1999.<br />
[10] Broutman, L.J. et Sahu, S., “A new theory to predict cumulative fatigue damage in fiber glass reinforced plastics”, Composite materials:<br />
testing and design, (2nd conference). ASTM STP, 497, p. 170-188, 1972.<br />
[11] Talreja, R., “<strong>Fatigue</strong> <strong>of</strong> polymer matrix <strong>composite</strong>s”. Comprehensive Composite Materials, Chapter 2.14, p. 529-552, 2003.<br />
[12] Thionnet, A. et Renard, J., “Laminated <strong>composite</strong>s <strong>under</strong> fatigue <strong>loading</strong> : a dammage development law for transverse cracking”,<br />
Composite Science Technology, vol. 52, p. 173-181, 1994.<br />
[13] Thionnet, A. et Renard, J., “Modelling <strong>of</strong> the fatigue <strong>behaviour</strong> <strong>of</strong> laminated <strong>composite</strong> structures” In : Degallaix, S., Bathias, C. et<br />
Fougères, R. (eds.). International Conference on fatigue <strong>of</strong> <strong>composite</strong>s. Proceedings, 3-5 June, Paris, Frace. La Société Français de<br />
Métallurgie et de Matériaux, pp. 363-369, 1997.<br />
[14] Caron, J.-F., “Modélisation de la cinétique de fissuration transverse en fatigue dans les stratifiés”, PhD thèse,Ecole Nationale des Ponts et<br />
Chaussées, 1993.<br />
[15] Hashin, Z. et Rotem, A., “A fatigue criterion for fibre reinforced <strong>composite</strong> materials”, Journal <strong>of</strong> Composite Material, vol. 7, p.448-464,<br />
1973.<br />
[16] Lorriot, Th., Marion, G., Harry, H., et Wargnier, H., “Onset <strong>of</strong> free-edge delamination in <strong>composite</strong> laminates <strong>under</strong> tensile <strong>loading</strong>”,<br />
Composites:Part B, vol. 34, p. 459-471, 2003.<br />
[17] Kim, R.Y., and Soni, S.R., “Experimental and Analytical Studies on the onset <strong>of</strong> delamination in laminated <strong>composite</strong>s”, Journal <strong>of</strong><br />
Composites Materials, vol. 18, p. 71-80, 1984.<br />
[18] Brewer, J.C. et Lagace, P.A., “Quadratic Stress Criterion for Initiation <strong>of</strong> delamination”, Journal <strong>of</strong> Composite Materials, vol. 22, p.<br />
1141-1155, 1988.<br />
[19] Joo, J.W., “A failure Criterion for laminates governed by free edge interlaminar shear stress”, Journal <strong>of</strong> Composite Materials, vol. 26(10),<br />
p. 1510-1522, 1992.<br />
[20] Bažant, Z.P. et Pijaudier-Cabot, G., “Nonlocal continuum damage, localization instability and convergence”, Journal <strong>of</strong> Applied<br />
Mechanics, vol. 55, p. 287-293, 1998.<br />
[21] Germain, N., Besson, J., Feyel, F. et Maire, J.F., “Méthodes de calcul non local appliquées au calcul de structures <strong>composite</strong>s”,<br />
Compiègne JNC14, vol. 2, p. 633-640, 2005.<br />
229
Abstract<br />
<strong>Fatigue</strong> life assessment via ply-by-ply stress analysis <strong>under</strong><br />
biaxial <strong>loading</strong><br />
F Schmidt *, T J Adam, P Horst<br />
Institute <strong>of</strong> Aircraft Design and Lightweight Structures, Technische Universität Braunschweig,<br />
Hermann-Blenk Straße 35, 38108 Braunschweig, Germany<br />
A new modelling approach for calculating the stress redistributions due to matrix cracking within the fatigue life <strong>of</strong> a<br />
slightly non-symmetric <strong>composite</strong> is presented. Thereby, a ply-by-ply stiffness degradation model and an analytical<br />
engineering approach allowing the layer-wise calculation <strong>of</strong> lamina stresses are applied. The result is a single<br />
lamina-based S-N curve <strong>of</strong> the critically stressed layer (predominant fibre-parallel stresses) indicating the overall<br />
laminate failure <strong>under</strong> fatigue <strong>loading</strong>. Using experimentally fatigue loaded tube specimens <strong>under</strong> biaxial <strong>loading</strong><br />
provides the fatigue damage information (crack densities depending on the biaxial stress ratio) adopted in the modelling<br />
approach. The application and a validation <strong>of</strong> the modelling approach are shown.<br />
Keywords: Polymer matrix <strong>composite</strong>s; <strong>multiaxial</strong> fatigue; fatigue modelling; stress analysis<br />
1. Introduction<br />
It is well known that the number and variety <strong>of</strong> applications <strong>of</strong> fibre-reinforced materials are<br />
increasing steadily. At the same time the demand for safety and design rules is growing. Due to the lack<br />
<strong>of</strong> reliable life-prediction methods, resulting uncertainties in fatigue life make the sizing <strong>of</strong> structural<br />
components exposed to dynamic loads quite problematic. The reason is the complexity <strong>of</strong> the fatigue<br />
process which involves several individual and interacting damage mechanisms such as matrix cracking,<br />
delamination and fibre fracture. Moreover, the occurrence and accumulation <strong>of</strong> these damage<br />
mechanisms strongly depend on certain load parameters as e.g. the stress amplitude, the <strong>multiaxial</strong>ity <strong>of</strong><br />
stresses, the stress ratio and the frequency. Several authors divide the main fatigue <strong>behaviour</strong> (stiffness<br />
degradation) as well as damage development into three phases [1-4]. The fatigue damage and stiffness<br />
scenarios show the initiation and progression <strong>of</strong> transverse cracks with sharp tips and a steep decrease in<br />
stiffness (stage I), the development <strong>of</strong> local delaminations caused by transverse cracks and an almost<br />
linear decline in stiffness (stage II) and the concurrence <strong>of</strong> resulting local delamination surfaces with the<br />
final failure (stage III). These damage mechanisms and fatigue <strong>behaviour</strong>s are used for fatigue models.<br />
Degrieck et al. [5] and Quaresimin et al. [6] review fatigue damage models and life assessment, where<br />
Quaresimin describes the fatigue <strong>behaviour</strong> <strong>under</strong> <strong>multiaxial</strong> <strong>loading</strong>s. Although most fatigue stress<br />
states in structural components possess a <strong>multiaxial</strong> nature, the fatigue <strong>behaviour</strong> <strong>under</strong> <strong>multiaxial</strong><br />
* Corresponding author. Tel.: 0049-531-391-9921; fax: 0049-531-391-9904.<br />
E-mail addresses: frank.schmidt@tu-bs.de (F Schmidt), tj.adam@tu-bs.de (tj.adam@tu-bs.de), p.horst@tu-bs.de (P Horst)
F Schmidt, T J Adam, P Horst. / <strong>Fatigue</strong> life assessment via ply-by-ply stress analysis <strong>under</strong> biaxial <strong>loading</strong><br />
conditions is far less investigated. That leads to further researches by Adden et al. [7] establishing a<br />
ply-by-ply stiffness degradation model. Concerning the major deterioration steps in <strong>composite</strong> fatigue<br />
depending on matrix cracking, delamination and fibre fracture, firstly the process <strong>of</strong> matrix cracking is<br />
taken into account. By adopting this model in the current work a theoretical bottom-up ply-by-ply<br />
approach for calculating the change <strong>of</strong> the internal stresses (assuming linear elasticity) <strong>of</strong> each layer<br />
caused by increasing crack densities is proposed. Using a lamina-based S-N curve <strong>of</strong> a critical stressed<br />
lamina – independent <strong>of</strong> the <strong>loading</strong> direction – leads to a prediction <strong>of</strong> the fatigue life <strong>of</strong> the overall<br />
laminate, whereas the local fibre-parallel stress in the layer serves as input parameter. Concerning the<br />
common denotation a lamina is defined to be a single unidirectional layer within the overall laminate.<br />
The required damage data for modelling validation is provided by fatigue experiments with NCF tube<br />
specimens and different biaxial and uniaxial load ratios. An important fact for the current modelling<br />
approach presented in this paper is, that NCFs can widely be treated like non-stitched laminates, when<br />
looking at their <strong>behaviour</strong> [8,9].<br />
2. Material and testing procedure<br />
The specimens used in the experiments are <strong>tubes</strong> made <strong>of</strong> glass-fibre (roving OC111A from OWENS<br />
CORNING) non-crimped-fabrics. Each layer <strong>of</strong> the NCF provided by SAERTEX consists <strong>of</strong> four<br />
sub-layers, whose lay-up and relative mass fractions are shown in table 1. Two <strong>of</strong> these<br />
non-crimped-fabric layers form the investigated slightly antisymmetric lay-up<br />
[0 o ,-45 o ,90 o ,45 o ,-45 o ,90 o ,45 o ,0 o ]. The sub-layers are tied together with a tricot-type <strong>of</strong> stitching whereas<br />
the material <strong>of</strong> the stitching yarn is poly-ether-sulfone (PES).<br />
Table 1. lay-up <strong>of</strong> the used non-crimped-fabric<br />
Orientation ( o ) Mass per unit area (g/m 2 ) Relative mass fraction (%)<br />
0 638 49<br />
-45 301 23<br />
90 63 5<br />
45 301 23<br />
Using the common resin/hardener combination RIM135/RIMH137 from HEXION, which is for<br />
example used in the rotor blade manufacturing <strong>of</strong> wind-energy plants, the specimens with a diameter <strong>of</strong><br />
46 mm and a length <strong>of</strong> 330 mm are manufactured by resin transfer moulding (RTM). Thereby, the tube<br />
specimens consist <strong>of</strong> two layers <strong>of</strong> the above mentioned NCF, which are wrapped around a mandrel with<br />
the inner and outer 0 o -angled plies <strong>of</strong> the NCF being parallel to the axial direction <strong>of</strong> the tube specimens.<br />
In further production steps, both ends <strong>of</strong> the tube specimens are reinforced by GFRP-doublers and<br />
bonded steel inserts <strong>of</strong> 70 mm length in order to prevent failure due to the fixing pressure <strong>of</strong> the testing<br />
machine. This type <strong>of</strong> specimens allows the investigation <strong>of</strong> biaxial loads with arbitrary load ratios and<br />
minimizes the so-called free-edge effect known from flat specimens. Moreover, the development <strong>of</strong><br />
matrix cracks due to different fibre orientations in the NCF is expected (caused by the high intra- and<br />
interlaminar occurring stresses). As a consequence <strong>of</strong> the matrix crack development the overall material<br />
stiffness <strong>of</strong> the tube specimens decreases, which leads to interlaminar stress redistributions.<br />
231
232<br />
Fifth International Conference on <strong>Fatigue</strong> <strong>of</strong> Composites<br />
The mechanical tests are performed with a servo-hydraulic tension-torsion machine. By using<br />
different ratios <strong>of</strong> axial forces and torsional moments arbitrary <strong>multiaxial</strong> load ratios can be applied. All<br />
fatigue tests are performed in a force-controlled manner with R=-1 and a frequency <strong>of</strong> 2 to 5 Hz. In<br />
order to distinguish different load cases, the biaxiality ratio (parameter β) is introduced as follows:<br />
β = arctan<br />
( τ )<br />
This is to say, the angle between the shear stress η and the tensile/compressive stress ζ indicates the<br />
different biaxial load cases. Hence, β=90 o means pure shear and β=0 o pure tension/compression loads.<br />
The other load cases are β=60 o (combination <strong>of</strong> tension/compression and torsion with a predominant<br />
shear part) and β=30 o (also a combination <strong>of</strong> tension/compression and torsion with the<br />
tension/compression part being dominant). For each load ratio fatigue testing is performed at different<br />
load amplitudes leading to low-cycle and high-cycle fatigue.<br />
σ<br />
Fig. 1. protocol <strong>of</strong> fatigue <strong>loading</strong>.<br />
In order to monitor the matrix crack development and to estimate the material stiffness, all fatigue<br />
tests are divided into three main steps (see Fig 1): the characterization step, the fatigue damage step and<br />
the discrete damage monitoring. The characterization steps are quasi-static tests conducted with<br />
force-controlled ramps (pure discrete tension/compression force and positive/negative torsion moments)<br />
in order to monitor the current material stiffness. These loads are chosen in a way that the <strong>loading</strong> is<br />
adequate for calculating the Young‟s and shear modulus, whereas it is considerably smaller than the<br />
applied cyclic load in the fatigue damage steps. Within the fatigue damage steps, cyclic loads (sinus<br />
wave form) with constant amplitudes and different biaxial load ratios are applied to introduce fatigue<br />
damages like matrix cracking, delaminations and fibre fracture. Matrix cracking indicated by the<br />
so-called crack density is the first occurring type <strong>of</strong> fatigue damage and is monitored stepwisely<br />
(discrete damage steps). Based on the nearly similar refraction indices <strong>of</strong> resin and glass fibre used for<br />
the tube specimens, the specimens are transparent and matrix cracks are observable via transmitted light<br />
method using an optical microscope (ZEISS Stemi 2000-C). Therefore, the fatigue tests are stopped
F Schmidt, T J Adam, P Horst. / <strong>Fatigue</strong> life assessment via ply-by-ply stress analysis <strong>under</strong> biaxial <strong>loading</strong><br />
after several fatigue damage steps and the specimens are taken out <strong>of</strong> the tension-torsion testing<br />
machine. Up to 15 different areas <strong>of</strong> the specimens are monitored and the matrix cracks are counted<br />
using photographically documented cracking states. Differentiating the visible cracks by their<br />
orientation angle leads to the numbers <strong>of</strong> cracks <strong>of</strong> each single-layer direction (0 o , -45 o , 90 o and 45 o ).<br />
These numbers <strong>of</strong> cracks are referred to the size <strong>of</strong> the digital picture to calculate the crack densities <strong>of</strong><br />
each layer direction. Then, all area- and layer-specific crack densities are averaged to obtain the overall<br />
layer-specific crack densities <strong>of</strong> each specimen.<br />
3. Modelling <strong>of</strong> stiffness degradation<br />
A finite-element-based analysis method to describe the stiffness degradation <strong>of</strong> a cracked<br />
unidirectional single-ply is developed by Adden et al. [7] and serves as a basis for further calculations <strong>of</strong><br />
stress redistributions in <strong>composite</strong>s <strong>under</strong> fatigue <strong>loading</strong> when linear-elastic <strong>behaviour</strong> is assumed.<br />
Using the technique <strong>of</strong> the representative volume element (RVE) leads to the computation <strong>of</strong> the<br />
stiffness degradation <strong>of</strong> one single-layer dependent on a parameter D. This so-called damage parameter<br />
D is a main result <strong>of</strong> the RVE approach and is equal to the product <strong>of</strong> crack density δ and ply thickness.<br />
It follows:<br />
D= t<br />
Concerning the set up <strong>of</strong> the model the RVE consists <strong>of</strong> two outer layers (0 o -orientation, no cracks) as<br />
supporting layers and one embedded single-ply (90 o -orientation) with two transverse cracks. Different<br />
crack densities δ are modelled by changing the RVE lengths while keeping all other dimensions and the<br />
number <strong>of</strong> cracks constant. By applying periodic boundary conditions by Garnich and Karami [10],<br />
energy-based homogenization methods and six different load cases (three normal stresses according to<br />
the ply axes and three corresponding shear stresses) the mechanical elasticity parameters <strong>of</strong> the inner<br />
cracked single-ply is calculated independently from the supporting layer. Furthermore, the relation<br />
between the damage parameter and the corresponding decline <strong>of</strong> stiffness is proposed to be expressed by<br />
the following degradation function:<br />
1<br />
1 c D =<br />
+ <br />
Here c and ξ are material parameters found by curve fitting. The application <strong>of</strong> this degradation<br />
function leads to the elasticity constants <strong>of</strong> a damaged unidirectional single-ply calculated for a given<br />
crack density. Adden et al. [7] show that transverse matrix cracks cause the degradation <strong>of</strong> five elastic<br />
parameters (E22, υ12, υ32, G23 and G12) <strong>of</strong> the cracked single-ply whereas the other components are not<br />
affected (see figure 2). This <strong>behaviour</strong> is transferred to other lay-ups in recent researches [11] and can<br />
be used for the specimen lay-up mentioned above.<br />
4. Laminate degradation modelling and ply-by-ply stress analysis<br />
As mentioned above, an analytical approach for calculating layer-wise average stresses in cracked<br />
laminates based on the single-ply stiffness degradation model by Adden et al. is presented. The basic<br />
idea consisting in modelling a multi-angle laminate by means <strong>of</strong> single-layer degradation and<br />
233
234<br />
Fifth International Conference on <strong>Fatigue</strong> <strong>of</strong> Composites<br />
experimentally observed crack densities is shown in figure 3. Subsequently, the global laminate<br />
<strong>behaviour</strong> is calculated using the single-layer degradation (described throughout the fatigue life) and a<br />
suitable laminate theory (comprising the single-layer orientations and thicknesses). In the current work<br />
the classical laminated plate theory (CLPT) is applied, whereas another research [11] shows the<br />
application <strong>of</strong> the described modelling approach for an extended three-dimensional laminated plate<br />
theory by Lin [12].<br />
Fig. 2. degradation <strong>of</strong> elasticity parameters.<br />
Fig. 3. laminate degradation modelling approach.<br />
When dealing with fibre-reinforced multi-layered <strong>composite</strong>s two different coordinate systems have<br />
to be distinguished. The first one is the global xy- or laminate coordinate system, where x denotes the<br />
length and y the width. The second coordinate system is the local or unidirectional 12-coordinate system.<br />
When describing the single-layer all properties are related to this local system. Thereby, 1 stands for the<br />
fibre-parallel direction and 2 for the in-plane fibre-normal direction. All properties follow a fixed<br />
notation rule, e.g. υ12 is a lateral contraction in direction 1 caused by a load along the 2-axis.
F Schmidt, T J Adam, P Horst. / <strong>Fatigue</strong> life assessment via ply-by-ply stress analysis <strong>under</strong> biaxial <strong>loading</strong><br />
Modelling assumptions and main calculation strategy<br />
For calculating the mechanical <strong>behaviour</strong> <strong>of</strong> damaged <strong>composite</strong>s with the analytical model, several<br />
assumptions have to be introduced. As mentioned above, the CLPT is applied in the current work and<br />
consequently only three elastic parameters (E22, υ12 and G12) <strong>of</strong> the modelling approach by Adden et al.<br />
[7] are considered for the calculation <strong>of</strong> the stiffness degradation and stress redistribution <strong>under</strong> fatigue<br />
loads. However, this simplification leads to sufficient results compared to the extended<br />
three-dimensional laminated plate theory [11]. Furthermore, it is assumed that linear elastic material<br />
<strong>behaviour</strong> is maintained throughout the fatigue life when considering discrete damage states. All<br />
discrete damage stages are characterized by the ply-specific damage parameter (calculated with the<br />
experimentally observed ply-specific crack density and the single-layer thickness) and a fixed <strong>loading</strong><br />
which is equivalent to the maximum amplitude <strong>of</strong> the cyclic <strong>loading</strong>. Using the experimental stress ratio<br />
<strong>of</strong> R=-1 for all <strong>multiaxial</strong> fatigue tests leads to two different maximum amplitudes <strong>of</strong> the global stress<br />
states <strong>of</strong> the same biaxial stress ratio, one in tension and one in compression. Therefore, the local stress<br />
components <strong>of</strong> each single-ply are either tensional or compressive depending on the global loads and<br />
the lamina orientation angle. This determination affects the suggested model. As the single-layer elastic<br />
modulus E22 only degrades depending on the transverse crack opening <strong>under</strong> tensile stress, no loss <strong>of</strong><br />
E22 is expected <strong>under</strong> compressive loads. Consequently, the transverse stresses ζ22,k <strong>of</strong> each lamina<br />
determine whether E22 has to be degraded or not.<br />
Furthermore, it is assumed that the stepwise damage state-based stress analysis <strong>of</strong> a continuously<br />
damaged material/load system reveals the processes <strong>of</strong> interlaminar stress redistributions. As a result <strong>of</strong><br />
stress redistributions a so-called critical layer (layer with maximum fibre-parallel normal stress or shear<br />
stresses) forms causing the whole laminate to fail. For this reason it is particularly important to take the<br />
stress redistributions caused by the matrix cracking into account for calculating S-N curves (just<br />
considering the critical layer and lamina-based S-N curves) <strong>of</strong> <strong>composite</strong>s <strong>under</strong> <strong>multiaxial</strong> fatigue<br />
loads.<br />
As schematized in figure 4 the main calculation strategy consists <strong>of</strong> four steps arranged on the meso<br />
(single-layer) and the macro (laminate) scale. The first step is the calculation <strong>of</strong> all undamaged and<br />
damaged single-layers with the rules <strong>of</strong> mixture (given in the German guideline VDI2014 [13]) as<br />
homogenization tool and so the full set <strong>of</strong> elastic moduli is obtained from the material properties (fibre<br />
and resin). By adopting the degradation model introduced in section 3 and by applying layer- and<br />
step-specific crack densities the elastic constants <strong>of</strong> the damaged single-layers (exponent D) are derived<br />
from the elastic constants <strong>of</strong> the undamaged single layers. Then the properties <strong>of</strong> the global laminate are<br />
calculated with the CLPT in step 2. Thereby, the multi-layer angle laminate is composed by coordinate<br />
transformation and homogenization leading to the laminate stiffness matrix ( ABD ). This overall<br />
stiffness matrix consists <strong>of</strong> the extensional stiffness matrix ( A ), the coupling stiffness matrix ( B ) and<br />
the bending stiffness matrix ( D ). Having the mechanical properties <strong>of</strong> the damaged laminate, the<br />
laminate and single-layer reactions along the global xy-coordinate system are determined in the third<br />
235
236<br />
Fifth International Conference on <strong>Fatigue</strong> <strong>of</strong> Composites<br />
step. Therefore an external load vector xy, L is designated and multiplied with the inverted laminate<br />
stiffness matrix<br />
D -1<br />
ABD to calculate the laminate strains xy, L . Due to the assumption <strong>of</strong> stress<br />
and displacement continuity at the interfaces <strong>of</strong> the laminas all layers have equal strains in the x- and<br />
y-direction. Thus, in a physical parallel connection the layer-wise strains xx, k are identical to the<br />
laminate strains xx, L . For the estimation <strong>of</strong> the single-layer stresses and the identification <strong>of</strong> critically<br />
stressed layers (step 4), the calculated strains xx, k<br />
have to be transformed for each lamina to OA, k<br />
(OA stands for local lamina coordinate system) using the transformation rule <strong>of</strong> the CLPT. Subsequently,<br />
the lamina-specific stress vector OA, k is calculated by multiplying the damaged lamina-specific<br />
stiffness matrix<br />
D<br />
S OA,<br />
k<br />
and the strain vector OA, k . With all lamina-specific stress states calculated for<br />
a discrete point <strong>of</strong> time (or more precisely for all lamina damage states belonging to a discrete number<br />
<strong>of</strong> load cycles) a maximum stressed lamina can be identified.<br />
Fig. 4. stepwise laminate degradation modelling and ply-by-ply stress analysis<br />
Furthermore, using experimentally obtained crack densities and repeating the complete operation for<br />
a series <strong>of</strong> discrete load cycles leads to the <strong>behaviour</strong> <strong>of</strong> moduli, strains and stresses throughout the<br />
fatigue life and over the number <strong>of</strong> cycles. Several conclusions on the processes <strong>of</strong> stress redistribution<br />
caused by fatigue damage and a critical layer formation can be shown by analyzing the results <strong>of</strong> the<br />
analytical modelling approach. Until now, fatigue life prediction approaches (stress-based S-N curves or<br />
strain-based fatigue life diagram) usually refer to the laminate <strong>behaviour</strong>, however, here the S-N method<br />
is proposed to be a universal lamina-based one just considering the critical layer.<br />
5. Experimental results<br />
As already mentioned, a ply-by-ply stress analysis for antisymmetric <strong>composite</strong> laminates <strong>under</strong>
F Schmidt, T J Adam, P Horst. / <strong>Fatigue</strong> life assessment via ply-by-ply stress analysis <strong>under</strong> biaxial <strong>loading</strong><br />
<strong>multiaxial</strong> fatigue <strong>loading</strong> is conducted. Thereby, all investigations are based on crack data obtained by<br />
several experimental fatigue tests <strong>of</strong> biaxially loaded (biaxial stress ratios β = 30 o , 60 o and 90 o ) tube<br />
specimens made <strong>of</strong> non-crimped-fabrics.<br />
Varying the biaxial loads leads to different crack developments for all layer orientations and to<br />
individual and layer specific crack densities [7]. Under tension loads the matrix cracking in the 45 o , -45 o<br />
and 90 o -layers shows a quite usual <strong>behaviour</strong>, i.e. a very rapid increase <strong>of</strong> the crack densities to the<br />
highest absolute values in the most damaged layers within approximately the first 10-15 % <strong>of</strong> the<br />
lifespan. A significant amount <strong>of</strong> cracks in 0 o -directions is not visible. Regarding the monitored matrix<br />
cracking <strong>under</strong> biaxial loads (predominant shear part) it can be shown that the crack densities reach<br />
lower absolute values and that matrix cracking develops in the 0 o -directions, as well. This obviously<br />
results from the intralaminar <strong>loading</strong> <strong>of</strong> the 0 o -layes. Thus, according to the layer-specific crack<br />
densities the experimental degradations <strong>of</strong> Young‟s and shear moduli are dependant on the biaxiality<br />
ratio.<br />
Each layer in the laminate is degraded according to the monitored discrete damage steps in the fatigue<br />
life using the modelling approach presented in section 4 and the experimentally obtained crack densities.<br />
Then, homogenizing all lamina stiffnesses leads to the fatigue <strong>behaviour</strong> <strong>of</strong> the overall laminate for<br />
different load cases. The experimentally observed laminate <strong>behaviour</strong> can be calculated by a<br />
single-layer degradation quite well [7] and comparable results are obtained for the current researches.<br />
After the validation <strong>of</strong> the stiffness degradation <strong>behaviour</strong> the laminate reactions are computed in the<br />
next step. Thereby, applying the biaxial load cases leads to the overall laminate strains which are<br />
transferred to the single layers. By means <strong>of</strong> the degraded lamina stiffness established in the first<br />
modelling step, the intralaminar stress states are calculated for each single-ply. Due to the different<br />
degradation <strong>behaviour</strong>s <strong>of</strong> the plies (dependent on the matrix cracking and the external biaxial load case)<br />
the initial lamina stress states change during the fatigue life and stress redistributions are expected. The<br />
ply-specific stress states and the changes in stresses (caused by the increasing matrix cracks in the layers)<br />
for a specimen subjected to a biaxial <strong>loading</strong> (β = 30 o ) are depicted exemplarily in figure 5. Here, a<br />
positive prefix marks tension and a negative prefix stands for compressive stresses. The initial stress<br />
state (ζ11, ζ22 and η12) <strong>of</strong> each ply is calculated for the undamaged laminate whereas the stress<br />
magnitudes depend on the external biaxial loads (here: a combination <strong>of</strong> tension and positive shear<br />
loads). Within the first 20-30 % <strong>of</strong> the life span matrix cracking increases rapidly and the highest rate <strong>of</strong><br />
stress redistributions can be observed. Afterwards, the crack densities reach saturation and the change <strong>of</strong><br />
lamina stresses decreases until final failure occurs. The highest fibre parallel tensional stresses ζ11 are<br />
obtained for the 45 o -layers, which increase about 19% during the first part <strong>of</strong> the fatigue life up to the<br />
final failure. Furthermore, the fibre parallel compressive stresses ζ 11 <strong>of</strong> the -45 o -layers (resulting from<br />
the transverse contraction <strong>of</strong> the laminate) increase by about 22 %, whereas the absolute value is<br />
significantly smaller than the value <strong>of</strong> the 45 o -layers. All other stress components <strong>of</strong> the 45 o - and<br />
-45 o -layers are small. Taking a closer look at the stress components <strong>of</strong> the 0 o -layers an increase <strong>of</strong> fibre<br />
parallel tensional stresses with progressive stiffness degradation is observed as well. In general, all fibre<br />
parallel lamina stress components ζ11, which are crucial for the final failure, increase due to the<br />
237
238<br />
Fifth International Conference on <strong>Fatigue</strong> <strong>of</strong> Composites<br />
decreasing lamina stiffness E22 and the resulting reduction <strong>of</strong> the transverse matrix stresses ζ22. Thus,<br />
the presented model approach allows to calculate the influence <strong>of</strong> matrix cracks on the stress<br />
development <strong>of</strong> each single-layer <strong>under</strong> fatigue loads. By means <strong>of</strong> the modelling approach the stress<br />
redistributions in any arbitrary <strong>composite</strong> with experimental crack densities can be analyzed.<br />
In figure 6 an explicit comparison <strong>of</strong> the initial stress state and the stress values at the end <strong>of</strong> the<br />
fatigue life is illustrated. Additionally, the differences <strong>of</strong> the single-layer stresses caused by external<br />
biaxial loads are shown. On the left hand side <strong>of</strong> figure 6 the change <strong>of</strong> stresses (caused by the matrix<br />
cracks) for a biaxially loaded specimen (β = 30 o ) is plotted. Due to the high tension part <strong>of</strong> this biaxial<br />
load ratio the 0 o -layers and the 45 o -layers reach the highest stress values. Considering the antisymmetric<br />
lay-up <strong>of</strong> the specimen the stress values <strong>of</strong> the single-layer depend on the relative position to the<br />
reference plane (see CLPT and the matrix <strong>of</strong> coupling stiffnesses). Thus, the stress values <strong>of</strong> the<br />
45 o -layers (and -45 o -layers) are different. In this example the highest fibre parallel stresses ζ11 are<br />
calculated for the inner 45 o -layer. As all shear stresses η12 are relatively small it can be assumed that the<br />
fibre parallel stresses ζ11 are crucial for the final failure <strong>of</strong> a single layer which leads to final failure <strong>of</strong><br />
the overall laminate. Additionally, the 45 o -layers show the highest increase caused by observed matrix<br />
cracking and the inner 45 o -layer is clearly identified as the maximum stressed and critical layer in<br />
fatigue. As schematized on the right hand side <strong>of</strong> figure 6 the highest stress values are reached in the<br />
inner 45 o -layer for the biaxial load ratio <strong>of</strong> β = 60 o as well.<br />
a) stresses <strong>of</strong> one 0 o -layer b) stresses <strong>of</strong> one 45 o -layer<br />
c) stresses <strong>of</strong> one 90 o -layer d) stresses <strong>of</strong> one -45 o -layer<br />
Fig. 5. stress redistribution <strong>of</strong> single layers during fatigue life <strong>of</strong> one specimen (biaxial load ratio β = 30 o ).
F Schmidt, T J Adam, P Horst. / <strong>Fatigue</strong> life assessment via ply-by-ply stress analysis <strong>under</strong> biaxial <strong>loading</strong><br />
a) biaxial load ratio β = 30 o b) biaxial load ratio β = 60 o<br />
Fig. 6. initial and end state stresses <strong>of</strong> specimens <strong>under</strong> different biaxial load ratios.<br />
Fig. 7. comparison <strong>of</strong> fibre-parallel stresses ζ11,45 o <strong>of</strong> the 45 o -layer for different biaxial load ratios.<br />
The presented ply-by-ply stress analysis and the calculation <strong>of</strong> the stress distribution are conducted<br />
for all specimens tested in the fatigue experiments. As an important result, all specimens show that the<br />
maximum fibre parallel stresses occur in the inner 45 o -layer. Consequently, the failure-critical layer is<br />
the same for all biaxiality ratios. Considering the assumption mentioned above (fibre-parallel stresses <strong>of</strong><br />
the critical layer determine the final failure <strong>of</strong> the global laminate) the fibre parallel normal stresses are<br />
proposed to be used for further fatigue life prediction. All calculated final stresses ζ 11,45 o <strong>of</strong> the critical<br />
layer are referred to the appertaining number <strong>of</strong> accomplished load cycles and plotted in the<br />
lamina-based S-N diagram shown in figure 7. This S-N curve reveals a similar trend <strong>of</strong> the final<br />
maximum internal fibre parallel stresses for the different biaxial load ratios. Other S-N relationships in<br />
biaxial fatigue normally consist <strong>of</strong> several S-N curves each belonging to a discrete biaxiality ratio.<br />
Using the presented lamina-based S-N diagram leads to a single curve for all biaxial load configurations<br />
when employing calculated stress distributions and critical layer data. Moreover, the calculated final<br />
stress values <strong>of</strong> biaxially loaded laminates can be better compared to the stress values <strong>of</strong> unidirectional<br />
flat specimens for establishing a relationship which allows the fatigue life prediction <strong>of</strong> complexly<br />
239
240<br />
Fifth International Conference on <strong>Fatigue</strong> <strong>of</strong> Composites<br />
loaded laminates by means <strong>of</strong> simple unidirectional fatigue tests. By applying the CLPT and the<br />
degradation function shown in section 3 the calculation <strong>of</strong> the final stress states is realisable for arbitrary<br />
symmetric and antisymmetric lay-ups provided that the discrete damage states (crack densities) are<br />
known. With respect to further research work a damage accumulation law for the development <strong>of</strong> cracks<br />
is the next step. Afterwards, this law can be integrated in the exiting modelling approach with the result<br />
that experimental data is no longer required.<br />
6. Conclusion<br />
A modelling approach for a ply-by-ply stress analysis <strong>of</strong> a slightly non-symmetric <strong>composite</strong><br />
subjected to <strong>multiaxial</strong> fatigue loads is explained. Thereby, applying a ply-by-ply stiffness degradation<br />
model and experimentally observed crack densities leads to analytical calculation for layer-wise stress<br />
distribution for multiple damage states in the fatigue life. In other words, the stress redistributions with<br />
increasing laminate degradation are calculated. Finally, the formation <strong>of</strong> a maximum stress loaded layer<br />
(critically stressed layer) is shown and used to set up a S-N diagram referring the maximum<br />
fibre-parallel normal stresses to the maximal number <strong>of</strong> cycles accomplished. All biaxially loaded<br />
specimens show a single lamina-based S-N curve not depending on the global ratio <strong>of</strong> biaxiality.<br />
Acknowledgements<br />
The authors gratefully acknowledge the support by the German Science Foundation (DFG) within the<br />
project PAK267 (Effects <strong>of</strong> Defects).<br />
References<br />
[1] Schulte K. Baron C., Neubert N.: Damage development in carbon fibre epoxy laminates: cyclic <strong>loading</strong>, Composites, 1985, pp. 281-285<br />
[2] Nairn J.A., Hu S.: The initiation and growth <strong>of</strong> delaminations induced by matrix microcracks in laminated <strong>composite</strong>s, International<br />
Journal <strong>of</strong> Fracture 57, 1992, pp. 1-24<br />
[3] Talreja R.: Damage and fatigue in <strong>composite</strong>s – a personal account, Composites Science and Technology 68, 2008, pp. 2585-2591<br />
[4] Ladeveze P., Lubineau G., Marsal D.: Towards a bridge between the micro- and mesomechanics <strong>of</strong> delamination for laminated <strong>composite</strong>s,<br />
Composites Science and Technology 66, 2006, pp. 698-712<br />
[5] Degrieck J., Paepegem W.V.: <strong>Fatigue</strong> damage modelling <strong>of</strong> fibre-reinforced <strong>composite</strong> materials: Review, Applied Mechanics Review 54<br />
No 4, 2001, pp. 279-300<br />
[6] Quaresimin M., Susmel L., Talreja R.: <strong>Fatigue</strong> <strong>behaviour</strong> and life assessment <strong>of</strong> <strong>composite</strong> laminates <strong>under</strong> <strong>multiaxial</strong> <strong>loading</strong>s,<br />
International Journal <strong>of</strong> <strong>Fatigue</strong> 32, pp. 2-16, 2010<br />
[7] Adden S., Horst P.: Stiffness degradation <strong>under</strong> fatigue in <strong>multiaxial</strong>ly loaded non-crimped-fabrics, International Journal <strong>of</strong> <strong>Fatigue</strong> 32,<br />
2010, pp. 108-122<br />
[8] Carvelli V., Corigliano A.: Transversal resistance <strong>of</strong> long-fibre <strong>composite</strong>s: Influence <strong>of</strong> the fibre-matrix interface, Proceeding <strong>of</strong> the 11<br />
ECCM, Rhodes, Greece, 2004<br />
[9] Carvelli V., Chi T., Larosa M., Lomov S., Poggi C., Angulo D., Verpoest I., Experimental and numerical determination <strong>of</strong> the mechanical<br />
properties <strong>of</strong> multi-axial multe-ply <strong>composite</strong>s, Proceeding <strong>of</strong> the 11 ECCM, Rhodes, Greece, 2004<br />
[10] Garnich, M. R., Karami, G., Finite Element Micromechanics for Stiffness and Strength <strong>of</strong> Wavy Fiber Composites, Journal <strong>of</strong> Composite<br />
Materials, Journal <strong>of</strong> Composite Materials 38, pp. 273 – 292, 2004<br />
[11] Schmidt F., Adam T. J., Horst P.: <strong>Fatigue</strong> modelling <strong>of</strong> a nominally defect-free GFRP <strong>composite</strong> <strong>under</strong> multi-axial <strong>loading</strong>, submitted to<br />
Composites Science and Technology, 2010<br />
[12] Lin, GF., Comparative Stress/Deflection Analyses <strong>of</strong> a Thick-Shell Composite Propeller Blade, ADA251080, David Taylor Research<br />
Center Bethesda MD Ship Hydromechanics DEPT, 1991<br />
[13] VDI 2014, Entwicklung von Bauteilen aus Faser-Kunstst<strong>of</strong>f Verbunden – Blatt 1, published by VDI
Abstract<br />
<strong>Fatigue</strong> Damage initiation <strong>of</strong> a PA66/glass fibers <strong>composite</strong><br />
material<br />
B Esmaeillou, P Fereirra, V Bellenger *, A Tcharkhtchi<br />
PIMM, Arts & Métiers ParisTech, 151, Boulevard de l’Hôpital, 75013 Paris, France<br />
<strong>Fatigue</strong> damage initiation <strong>of</strong> a PA66/glass fiber <strong>composite</strong> material is studied with broken tests carried out with an<br />
"alternative bending device" and a small applied strain. During the damage initiation period, no change <strong>of</strong> macroscopic<br />
properties, density, cristallinity ratio, glass transition temperature, flexural elastic modulus is observed. Polysequential<br />
tests are carried out with 3 rest times differing by their length. These rest times allow the relaxation <strong>of</strong> macromolecular<br />
chains in the region <strong>of</strong> the microdefects and increase the number <strong>of</strong> cycles at fracture. The most efficient break is the one<br />
just before the final fracture. The comparison <strong>of</strong> the fatigue behavior <strong>of</strong> the <strong>composite</strong> and its neat matrix shows that the<br />
microdefects relaxed during the break are identical to those which initiate damage and final fracture.<br />
Keywords: PA66/glass fiber <strong>composite</strong>; damage initiation; fatigue broken test; fatigue polysequential test<br />
1. Introduction<br />
The fatigue behavior <strong>of</strong> <strong>composite</strong> materials with short fibers is still a key problem despite the<br />
progress in material science. For many molded parts, the lifetime prediction is crucial. In the automotive<br />
industry, pressures and temperatures in engines are inclined to go up, which makes critical the fatigue<br />
properties <strong>of</strong> these parts. A fatigue curve displays the variation <strong>of</strong> the induced stress versus the number<br />
<strong>of</strong> cycles for a given strain and frequency. Generally, these curves display three parts: 1 o ) A fast decay <strong>of</strong><br />
the induced stress due to the setting up <strong>of</strong> a thermal regime: an increasing temperature involves a<br />
decreasing elastic modulus; 2 o ) A long plateau (period 2) during which the induced stress decreases only<br />
slightly without any significant temperature change; 3 o ) A sudden stress reduction corresponding to the<br />
coalescence <strong>of</strong> microdefects followed by the sample fracture. For PA66/glass fibers, several research<br />
works [1-3] report that damage is initiated by the build-up <strong>of</strong> microdefects at fiber ends. Damage<br />
initiation occurs during the period 2 <strong>of</strong> stress stabilization. For unnotched samples <strong>of</strong> amorphous<br />
polymers, no significant change in macroscopic properties [4] (macroscopic compliance, cristallinity<br />
ratio, transition temperatures) is observed during this period. The aim <strong>of</strong> this work is to study damage<br />
initiation by the way <strong>of</strong> broken fatigue tests and polysequential fatigue tests. Broken fatigue tests are<br />
carried out and during every rest time, dogbone samples are analysed by Differential Scanning<br />
Calorimetry (melting temperature Tm, cristallinity ratio xc), density measurements, mechanical testing<br />
(Dynamic Mechanical Analysis, flexural modulus, ultimate stress). With polysequential fatigue tests,<br />
* Corresponding author. Tel.: +33 1 4424 6308; fax: +33 1 4424 6382.<br />
E-mail address: veronique.bellenger@paris.ensam.fr
242<br />
Fifth International Conference on <strong>Fatigue</strong> <strong>of</strong> Composites<br />
the effect <strong>of</strong> the rest time and break location on the fatigue lifetime is investigated.<br />
2. Material and methods<br />
The matrix is a thermoplastic Polyamide 66 reinforced by short glass fibres. The fraction<br />
crystallinity xc is determined by DSC experiments using the ratio<br />
value <strong>of</strong> melting enthalpy and<br />
c<br />
Hm<br />
H<br />
H<br />
m<br />
c<br />
m<br />
where Hm is the experimental<br />
the melting enthalpy <strong>of</strong> the 100% crystalline polymer.<br />
H =<br />
192 J/g [5]. Sample surface is observed in the most constrained part by optical microscopy with an<br />
Olympus BH2 or by scanning electron microscopy with a Hitachi S-4800 apparatus at an accelerating<br />
potential <strong>of</strong> 0.8 kV. Samples are not metallised before analysis. The loss modulus E” is measured by<br />
viscoelasticimetry on a NETZSCH DMA 242 apparatus. The test is performed in 3 points bending<br />
mode at a 10 Hz frequency, with a static force <strong>of</strong> 4 N and a dynamic force <strong>of</strong> 2N. The heating rate is<br />
5 o C/min. The initial mechanical properties are determined at 23 o C and 50% HR in bending mode with<br />
an INSTRON 4502. The strain rate is 2 mm/min and the bending length is 60 mm.<br />
The fatigue test [1] is performed in a flexural alternate bending device at a frequency <strong>of</strong> 10 Hz with a<br />
<br />
R=<br />
<br />
min<br />
max<br />
value equal to -1, at 23 o c and 50% RH. The applied strain is 0.013 for broken fatigue tests<br />
and 0.017 for polysequential fatigue tests. The most constrained part <strong>of</strong> the sample is determined by a<br />
linear elastic calculation [6], it is located at a distance <strong>of</strong> 18mm from the embedded part. The surface<br />
temperature in this area is measured during the test by a RAYTEK infrared camcorder.<br />
3. Results and discussions<br />
Broken fatigue tests are performed at 10 Hz with an applied strain <strong>of</strong> 0.013. The physico-chemical<br />
and mechanical properties, density, critallinity ratio, loss modulus, flexural modulus and ultimate stress<br />
are measured after 300 000 and 500 000 <strong>loading</strong> cycles. The values reported in Table 1 show that<br />
these properties are not modified during the damage initiation period. It does not mean that there is no<br />
defect build-up but their size/concentration is too small to induce a variation <strong>of</strong> the macroscopic<br />
properties. The loss modulus E" measured at 42 o C (the maximum value corresponding to T is 55 o C)<br />
seems to be constant except near the fracture (500 000 cycles) where it decreases when microdefects are<br />
generated. Before 500 000 cycles, the size <strong>of</strong> sub-micron defects, Fig 1, in the most constrained area is<br />
smaller than 0.2 µm. Between 0 and 500 000 cycles, flexural properties are unchanged taking into<br />
account the standard deviation. The last one reflects the heterogeneity <strong>of</strong> 500 000 <strong>loading</strong> cycle samples,<br />
heterogeneity which is also noticed for density and cristallinity ratio measurements.<br />
Polysequential fatigue tests are carried out at 10 Hz frequency and a strain = 0.017. The Fig 2<br />
displays the induced stress and the temperature versus the number <strong>of</strong> cycles. A first decrease <strong>of</strong> the<br />
induced stress from 85 MPa to 60 MPa is observed between 500 and 3000 cycles. It goes with an<br />
increasing temperature from 27 o C to 53 o C, then the temperature keeps on increasing but more slowly.<br />
This temperature increase induced by self-heating is smaller than the one reported before for another<br />
c<br />
m
B Esmaeillou, P Fereirra, V Bellenger, A Tcharkhtchi. / <strong>Fatigue</strong> Damage initiation <strong>of</strong> a PA66/glass fibers <strong>composite</strong> material<br />
PA66/glass fiber <strong>composite</strong> material [1]. The main difference between both <strong>composite</strong>s is the sizing <strong>of</strong><br />
glass fibers which is specific to PA66 whereas in the previous study, the sizing <strong>of</strong> glass fibers is<br />
unknown and probably much less efficient. The low mechanical resistance <strong>of</strong> the interface favors crack<br />
initiation and as a consequence an excess <strong>of</strong> self-heating temperature rise. This behavior can be<br />
explained by an increasing value <strong>of</strong> the loss modulus E" as shown by the viscoelastic spectrum, Fig 3,<br />
performed at the same frequency, 10 Hz. The dissipated heat at each mechanical cycle is equal to<br />
1<br />
= - ω E" where is the angular frequency, 0 the applied strain and E" the loss modulus.<br />
2 0<br />
Q ε 2<br />
For optical microscopy observation at the rest time, Surface sample is polished in the most constrained<br />
part before the test. After observation, the fatigue strain is again applied on the same sample. The time<br />
<strong>of</strong> break is at most 10 minutes. These successive breaks do increase the fatigue lifetime (65 000 cycles<br />
instead <strong>of</strong> 60 000 cycles at break). By optical microscopy, no damage is observed before 30 000 cycles,<br />
Fig 4(a). From this number <strong>of</strong> cycles, some pull out fibers appear near the surface but only in the most<br />
constrained part, Fig 4 (b,c) and just before the break Fig 4 (d), no microvoid/crack is visible.<br />
Fig. 1. SEM <strong>of</strong> the most constrained area <strong>of</strong> a specimen tested at 10 Hz and = 0.013 (broken test).<br />
Table 1. physico-chemical and mechanical properties <strong>of</strong> PA66/GF vs number <strong>of</strong> <strong>loading</strong> cycles<br />
Density (kg/m 3 ) xc (%) E‟‟42 o C (MPa) E (MPa) r (MPa)<br />
0 cycle <strong>loading</strong> 1409±13 35±4 343 6680 ± 200 190 ± 7<br />
300 000 cycle <strong>loading</strong> 1374±22 36±3 340 6860 ± 70 193 ± 8<br />
500 000 cycle <strong>loading</strong> 1404±8 38±5 290 6148 ± 612 204 ± 19<br />
243
244<br />
Fifth International Conference on <strong>Fatigue</strong> <strong>of</strong> Composites<br />
Fig. 2. Induced stress and temperature vs number <strong>of</strong> cycles <strong>of</strong> a fatigue test at 10 Hz and = 0.017<br />
Fig. 3. viscoelastic spectrum <strong>of</strong> PA66/glassfiber at 10 Hz, between -10 o C and 130 o C.<br />
Then the study is carried on with an unpolished sample by using scanning electron microscopy. After<br />
1000 cycles, some fiber ends are pulling out near the surface and initiate the skin fracture, Fig 5. This<br />
damage is nanoscale size that is why we call it nano cracks. It is very difficult to stop the fatigue test<br />
just before the sample break because the last phase <strong>of</strong> crack propagation is very fast. Cracks propagate<br />
first in zones where the fiber concentration is high, then in the matrix until the final fracture, Fig 6.<br />
This scenario recalls the work about the Essential Work <strong>of</strong> Fracture (EWF) <strong>of</strong> polyamide 66 filled with<br />
TiO2 nanoparticles [7]. Individual nanoparticles act as stress concentration points which promote tiny<br />
cavitations which coalesce into sub-micron ones, then rapidly grow into microvoids and initiate cracks<br />
due to the high level stress concentration.
B Esmaeillou, P Fereirra, V Bellenger, A Tcharkhtchi. / <strong>Fatigue</strong> Damage initiation <strong>of</strong> a PA66/glass fibers <strong>composite</strong> material<br />
(a) (b)<br />
(c) (d)<br />
Fig. 4. Optical microscopy observation <strong>of</strong> the most contrained part <strong>of</strong> a specimen tested at 10 Hz and = 0.017 (polysequential test) (a): initial, (b)<br />
30 000cycles, T=57 o C, (c) 45 000cycles, T=60 o C, (d) 60 000cycles, T=62 o C.<br />
(a) (b)<br />
245
246<br />
Fifth International Conference on <strong>Fatigue</strong> <strong>of</strong> Composites<br />
(c) (d)<br />
Fig. 5. SEM <strong>of</strong> the most constrained and polished area <strong>of</strong> a specimen tested at 10 Hz and = 0.017 (polysequential test) (a): initial, (b)<br />
1 000cycles, T=35 o C, (c) 5 000cycles, T=52 o C, (d) 10 000cycles, T=55 o C.<br />
Fig. 6. SEM <strong>of</strong> the most constrained and unpolished area <strong>of</strong> a specimen tested at 10 Hz, just before fracture (62 000 cycles).<br />
For polysequential fatigue tests, the first break occurs at 30 000 <strong>loading</strong> cycles and the rest time<br />
varies between 2 and 30 minutes. Then the same approach is done for a break at 45 000 <strong>loading</strong> cycles<br />
and for a break at 60 000 <strong>loading</strong> cycles close to the final sample fracture. For these test conditions, the<br />
number <strong>of</strong> cycles at fracture is 65000. The fatigue lifetime is the highest when the break occurs close to<br />
the final fracture, Fig 7, where the crack size is in a micron scale. It means that relaxation <strong>of</strong> defect<br />
build-up at the end <strong>of</strong> the damage initiation period is more efficient than the relaxation <strong>of</strong> defects<br />
build-up earlier. Fig 8 shows that an increasing rest time up to 20 minutes does increase the fatigue<br />
lifetime. Afterwards, between 20 minutes and 2 hours, the number <strong>of</strong> cycles at fracture remains constant,<br />
about equal to 110 000 cycles. That means that for an applied strain, 0 = 0.017, a rest time <strong>of</strong> 20<br />
minutes is enough for microdefects relaxation. When a rest time <strong>of</strong> 5 min is applied close to the final<br />
fracture, the mean stress induced is equal to 63 MPa, hence a 21 MPa gap with the initial induced stress.<br />
If the rest time is equal to 20 min, the mean stress induced (82 MPa) is practically equal to the initial<br />
induced stress (84 MPa). Now, the question is: what is the nature <strong>of</strong> the microdefects relaxed during the<br />
fatigue test break? Are they conformational changes in the amorphous phase? Robertson [8] considered<br />
for polystyrene and polymethyl methacrylate, a molecular model in which a shear stress field induced<br />
rotational conformations <strong>of</strong> backbone bonds, enough numerous to break up the rigidity and allow flow.<br />
The calculated properties agree reasonably well with experimental available results <strong>of</strong> cold drawing
B Esmaeillou, P Fereirra, V Bellenger, A Tcharkhtchi. / <strong>Fatigue</strong> Damage initiation <strong>of</strong> a PA66/glass fibers <strong>composite</strong> material<br />
experiments. Could they be packing density defects, for instance at the interphase crystalline/amorphous<br />
phases? An amorphous polymer can stand for a disorganized arrangement <strong>of</strong> structural units [9], each<br />
unit being located in a cage built up by the neighbor structural units. A "quasi punctual defect" is a spot<br />
made up by a structural unit and her first neighbors (the cage cited above) <strong>of</strong> which the free enthalpy<br />
level is higher than the mean value <strong>of</strong> the whole group <strong>of</strong> structural units. These "quasi punctual<br />
defects" correspond to local density fluctuations existing in the liquid state and which are frozen in the<br />
glassy state. <strong>Fatigue</strong> craze initiation was investigated in Polycarbonate [10]. The disentanglement <strong>of</strong><br />
polymer chains plays an important role in void-like structures or "protocrazes" with a size <strong>of</strong> ~ 50nm.<br />
Could the same phenomenon occur in the amorphous phase <strong>of</strong> Polyamide 66? Are these defects,<br />
preplasticized domains again in the matrix? The pre-yield and yield behavior <strong>of</strong> amorphous polymers<br />
has been described with a metallurgical approach [11]. Some new mechanical data were analyzed in<br />
terms <strong>of</strong> dislocation-like defects involved by deformation in the macromolecular chain arrangement.<br />
The comparison <strong>of</strong> the fatigue behavior <strong>of</strong> the <strong>composite</strong> and its neat matrix gives interesting<br />
information. Fig 9 shows the evolution <strong>of</strong> the induced stress vs. the number <strong>of</strong> <strong>loading</strong> cycles for the<br />
<strong>composite</strong> and the neat matrix strained at 10 Hz frequency with an applied strain 0= 0.019. The induced<br />
stress is 3 times higher for the <strong>composite</strong> than for the neat matrix and <strong>of</strong> course the fatigue lifetime is<br />
much shorter. The first reason is the difference in elastic modulus value but the second one is the<br />
difference in self-heating. The surface temperature in the most constrained part <strong>of</strong> the specimen is<br />
recorded during the test, Fig 10. The temperature rise <strong>of</strong> the <strong>composite</strong> is higher and starts before the<br />
one <strong>of</strong> the neat matrix. Nano crack build-up at fiber ends, precursors <strong>of</strong> microcracks, induces an<br />
increasing damping and thus a higher temperature increase. The gap between the number <strong>of</strong> cycles<br />
corresponding to these two rises <strong>of</strong> temperature, means that the crack build-up at fiber ends play a key<br />
role in damage initiation. Are these defects relaxed during the break, identical to the microcracks which<br />
coalesce in zones where the fiber concentration is high? It is reasonable to answer positively because at<br />
the end <strong>of</strong> a rest time <strong>of</strong> 20 minutes just before the final fracture, the induced stress when the strain is<br />
again applied, is equal to the maximum and initial induced stress. The matrix is in a rubbery state and<br />
the temperature is high enough to induce the closing/deletion <strong>of</strong> microcracks.<br />
Fig. 7. Variation <strong>of</strong> the cycle number at fracture vs the number <strong>of</strong> <strong>loading</strong> cycles before the test break and for various rest times. 0 = 0.017, 90<br />
MPa, =10 Hz,RH = 50.<br />
247
248<br />
Fifth International Conference on <strong>Fatigue</strong> <strong>of</strong> Composites<br />
Fig. 8. Variation <strong>of</strong> the cycle number at fracture vs the rest time for 3 values <strong>of</strong> the number <strong>of</strong> <strong>loading</strong> cycles before the test break. 0 = 0.017,<br />
90 MPa, =10 Hz,RH = 50.<br />
Fig. 9. Induced stress <strong>of</strong> the neat matrix (——) and <strong>of</strong> the <strong>composite</strong> (------) versus the number <strong>of</strong> <strong>loading</strong> cycles, tested at a 10 Hz frequency, 0 =<br />
0.019 and ,RH = 50.<br />
Fig. 10. Surface temperature <strong>of</strong> the neat matrix (——) and <strong>of</strong> the <strong>composite</strong> (------) versus the number <strong>of</strong> <strong>loading</strong> cycles, tested at a 10 Hz<br />
frequency, 0 = 0.019 and ,RH = 50.
B Esmaeillou, P Fereirra, V Bellenger, A Tcharkhtchi. / <strong>Fatigue</strong> Damage initiation <strong>of</strong> a PA66/glass fibers <strong>composite</strong> material<br />
4. Conclusions<br />
A fatigue curve displays 3 zones, <strong>of</strong> which the second one is very long, nearly 80% <strong>of</strong> the fatigue life,<br />
when the applied strain is low; during this period, damage initiation occurs but the size/concentration <strong>of</strong><br />
microdefects build-up is too small to involve a change in macroscopic properties such as density,<br />
cristallinity, flexural elastic modulus… At the beginning <strong>of</strong> the third zone which is short compared to<br />
the second one, cracks propagation first occurs in zones where the fiber concentration is high, then in<br />
the matrix until the final fracture. The fatigue lifetime is higher during polysequential tests than during<br />
non-stop tests. The most efficient break is just before fracture. There is an optimum rest time for<br />
microdefects relaxation which is equal to 20 minutes for our material and testing conditions. The nature<br />
<strong>of</strong> these relaxed microdefects was investigated by comparing the fatigue behavior <strong>of</strong> the neat matrix and<br />
<strong>of</strong> the <strong>composite</strong>. For identical testing conditions, the self-heating <strong>of</strong> the <strong>composite</strong> is higher and<br />
occurs before the one <strong>of</strong> the neat matrix. It means that nano cracks build-up at fiber ends, precursors<br />
<strong>of</strong> microcracks, play the key role. The comparison <strong>of</strong> the initial induced stress and the induced stress<br />
after a rest time just before the specimen fracture seems to indicate that these micro-cracks are closed<br />
during the rest period.<br />
Acknowledgments<br />
Many Thanks to Gilles Robert for helpful discussion and Rhodia Co for providing PA66/glass fiber<br />
compounds.<br />
References<br />
[1] Bellenger V., Tcharkhtchi A., Castaing Ph., Thermal and mechanical fatigue <strong>of</strong> a PA66/glass fibers <strong>composite</strong> materials. International<br />
Journal <strong>of</strong> <strong>Fatigue</strong> 2006; 28: 1348-52.<br />
[2] Noda K. <strong>Fatigue</strong> failure mechanism <strong>of</strong> short glass-fiber reinforced Nylon 66 based on non linear dynamic viscoelastic measurement.<br />
Polymer 2001; 42: 5803-11.<br />
[3] Horst J.J., Spoomaker J.L., <strong>Fatigue</strong> fracture mechanisms and fractography <strong>of</strong> short-glass fibre-reinforced polyamide6. J. Mater Sci 1997;<br />
32; 3641-51.<br />
[4] Baltenneck F., Trotignon J-P, Verdu J., Kinetics <strong>of</strong> fatigue failure <strong>of</strong> polystyrene. Polym Eng Sci 1997; 37 (10): 1740-47.<br />
[5] Mark J.E. Polymer data handbook, Oxford University press; 1999. p. 195.<br />
[6] Barbouchi S., Bellenger V., Tcharkhtchi A ., Castaing Ph, Jollivet T. Effect <strong>of</strong> water on the fatigue behavior <strong>of</strong> a PA66/glass fibers<br />
<strong>composite</strong> material. J Mater Sci 2007; 42; 2181-88.<br />
[7] Yang J., Zhang Z., Zhang H. The essential work <strong>of</strong> polyamide 66 filled with TiO2 nanoparticles. Comp. Sci. Technol. 2005; 65; 2374-79.<br />
[8] Robertson R.E. Theory for the plasticity <strong>of</strong> glassy polymers. J. Chem. Phys. 1966 ;44 ; 3950-56.<br />
[9] Perez J., Physique et mécanique des polymères amorphes. Technique et documentation Lavoisier; 1992. p. 34-35.<br />
[10] Hristov H.A., Yee A.F., Gidley D.W. <strong>Fatigue</strong> craze initiation in polycarbonate: study by transmission electron microscopy. Polymer, 1994;<br />
35; 3604-11.<br />
[11] Escaig B. A metallurgical approach to the preyield and yield behavior <strong>of</strong> glassy polymers. Polym. Eng. Sci. 1984; 24 (10); 737-49.<br />
249
<strong>Fatigue</strong> life prediction <strong>of</strong> <strong>of</strong>f-axis unidirectional laminate<br />
F Q Wu *, W X Yao<br />
Key Laboratory <strong>of</strong> Fundamental Science for National Defense-Advanced Design Technology <strong>of</strong> Flight Vehicle, Nanjing University <strong>of</strong> Aeronautics<br />
and Astronautics Nanjing 210016, China<br />
Abstract<br />
The prediction method <strong>of</strong> fatigue life <strong>of</strong> unidirectional laminate with the special ply fatigue life is an important support<br />
to build the prediction model <strong>of</strong> fatigue life <strong>of</strong> any lay-up laminate based on the special ply fatigue life. In this paper, the<br />
fundamental mechanical hypothesis <strong>of</strong> the fatigue failure criterion <strong>of</strong> unidirectional laminate, which is developed from<br />
the static failure criterion <strong>of</strong> laminate, has been analyzed. Based on the investigation on the fatigue failure regularities <strong>of</strong><br />
the different unidirectional laminates, a phenomenon has been found that the location <strong>of</strong> unidirectional laminate S-N<br />
curve is monotonously decreasing with the increasing <strong>of</strong> ply orientation angle in the same coordinate. Then, a function<br />
has been proposed to describe the phenomenon. To analyze the mathematical characteristic <strong>of</strong> the function deeply, a<br />
fatigue life prediction model, which the fatigue life <strong>of</strong> unidirectional laminate can be predicted with the fatigue lives <strong>of</strong><br />
longitudinal and transverse laminates, has been proposed by means on a special material S-N curve function. Based on<br />
the model, the fatigue life <strong>of</strong> any unidirectional laminate can be predicted by the S-N curves <strong>of</strong> two arbitrary<br />
unidirectional laminates. Twelve sets <strong>of</strong> experimental data <strong>of</strong> five kinds <strong>of</strong> laminates were employed to verify the model,<br />
and the results show that predicted fatigue life is in agreement with the experiment ones.<br />
Keywords: <strong>composite</strong>; fatigue; <strong>of</strong>f-axis unidirectional laminate; fatigue life prediction<br />
1. Introduction<br />
The laminate is the general <strong>composite</strong> material in engineering structure. To change the fiber volume<br />
fraction, ply orientation angle and ply stacking sequence <strong>of</strong> laminate, the different mechanical<br />
characteristic <strong>composite</strong> can be gotten easily, which satisfies the engineering necessity commendably.<br />
Because <strong>of</strong> the designability <strong>of</strong> material, the <strong>composite</strong> laminate has been used widely in aeronautics,<br />
astronautics, transportation, architecture and energy fields. The structural form <strong>of</strong> laminate decides the<br />
<strong>composite</strong> laminate is anisotropy material. The properties characteristic causes the mechanical analysis<br />
method <strong>of</strong> laminate is more complicated than the analysis method <strong>of</strong> isotropic material. The static<br />
mechanical theories <strong>of</strong> laminate are mature now, but the fatigue analysis method is imperfect, which<br />
need be developed. The usual method to get the fatigue S-N curve <strong>of</strong> laminate is by the fatigue<br />
experiment in engineering. The structure type is infinite about laminate with the same component<br />
material. If the fatigue lives <strong>of</strong> any type laminate with the same component material were gotten by the<br />
fatigue experiment, the cost and consumed time will be very high in engineering. Therefore, it is<br />
satisfied with the engineering requirement to build a fatigue life prediction model, which the fatigue life<br />
<strong>of</strong> laminate can be predicted by the fatigue lives <strong>of</strong> longitudinal and transverse laminates. Because the<br />
* E-mail address: stonewu@nuaa.edu.cn, Tel.: 86-25-84895717
F Q Wu, W X Yao. / <strong>Fatigue</strong> life prediction <strong>of</strong> <strong>of</strong>f-axis unidirectional laminate<br />
ply is the basic element <strong>of</strong> laminate, the first step <strong>of</strong> the model is to solve the fatigue life prediction <strong>of</strong><br />
ply with special laminate, like the analysis method <strong>of</strong> the static mechanics property <strong>of</strong> laminate.<br />
The unidirectional laminate is the orthotropic material and the ply orientation angle is the angle<br />
between fiber orientation and load orientation. Because <strong>of</strong> the simple structural form, the fatigue failure<br />
modes are simple in the unidirectional laminate. According to a great deal <strong>of</strong> the experimental<br />
investigations, the modes are matrix cracking, interfacial debonding and fiber breakage. The<br />
unidirectional laminate is the basic element <strong>of</strong> laminate. The fatigue life prediction model <strong>of</strong><br />
unidirectional laminate is the foundation <strong>of</strong> the laminate fatigue life prediction method with special<br />
laminate fatigue life. To solve the fatigue life prediction <strong>of</strong> unidirectional laminate, many research<br />
investigations had been done. To develop the static failure criterion <strong>of</strong> laminate, Hashin [1] , Brogdon [2] ,<br />
Awerbuch [3] and Jen [4] built the prediction model, which predicts the fatigue life <strong>of</strong> <strong>of</strong>f-axis<br />
unidirectional laminate with the fatigue lives <strong>of</strong> longitudinal, transverse and shear laminates. But the<br />
calculated results are not good agreement with the experimental data. Kadi [5] , Plumtree [6,7] , Shokrieh [8]<br />
and A Varvani-Farahani [9] researched the relationship between the strain energy and the fatigue life <strong>of</strong><br />
the unidirectional laminate <strong>under</strong> the fatigue <strong>loading</strong> and thought the relationship is linear function.<br />
According to the research, they built the prediction model, which predicts the fatigue life <strong>of</strong> the <strong>of</strong>f-axis<br />
unidirectional laminate with the special laminate. Ellyin [10] analyzed the relationship <strong>of</strong> S-N curves <strong>of</strong><br />
the different unidirectional laminates and proposed a prediction model by means on statistics, which<br />
predicts the fatigue life <strong>of</strong> the <strong>of</strong>f-axis unidirectional laminate with a reference laminate. Kawai [11]<br />
thought the relationship between the fatigue strength and the fatigue life <strong>of</strong> the unidirectional laminate is<br />
satisfied with the exponential relationship. To fit the function by the experimental data, the fatigue life<br />
<strong>of</strong> the <strong>of</strong>f-axis unidirectional laminate has been predicted. But the predicted result is not satisfactory.<br />
Many investigations to analyze the relationship <strong>of</strong> fatigue life among the different unidirectional<br />
laminates had been done by researchers. Many describing model has been proposed to predict the<br />
fatigue life <strong>of</strong> the <strong>of</strong>f-axis unidirectional laminate with the special laminate. But there are bigger errors<br />
between calculated results and experimental data. In this paper, the fatigue failure mechanics <strong>of</strong><br />
unidirectional laminate had been analyzed. Then, a prediction model had been proposed to predict the<br />
fatigue life <strong>of</strong> the <strong>of</strong>f-axis unidirectional laminate with the fatigue lives <strong>of</strong> longitudinal and transverse<br />
laminates.<br />
2. <strong>Fatigue</strong> life prediction model<br />
2.1 Stress analysis<br />
When the <strong>of</strong>f-axis unidirectional laminate is subjected to <strong>loading</strong>, the <strong>loading</strong> will be distributed on<br />
the on-axis <strong>of</strong> unidirectional laminate based on the balance principle <strong>of</strong> mechanics, as shown in Fig.1.<br />
There are quantitative relations among these stresses<br />
251
252<br />
Fifth International Conference on <strong>Fatigue</strong> <strong>of</strong> Composites<br />
2<br />
1 = xcos<br />
<br />
2<br />
<br />
2 = xsin<br />
<br />
12 = x sin cos<br />
<br />
Fig. 1. The stresses <strong>of</strong> unidirectional laminate.<br />
where the subscript 1 denotes the parallel fiber direction or the longitudinal direction, the subscript 2<br />
denotes the vertical fiber direction or the transverse direction, ζ1 is the longitudinal stress, ζ2 is the<br />
transverse stress, η12 is the in-plane shear stress, θ is the ply orientation angle, which is the angle<br />
between fiber direction and load direction. Based on the stresses in equation (1), there are many model<br />
had been proposed to describe the static failure <strong>of</strong> laminate. The Tsai-Hill criterion is used in<br />
engineering usual. To analyze the stresses <strong>of</strong> laminate <strong>under</strong> static <strong>loading</strong>, the Tsai-Hill function can be<br />
gotten. It is<br />
f<br />
2 2 2<br />
1 1 2 2 12<br />
x = - + + (2)<br />
2 2 2 2<br />
X X Y S<br />
( )<br />
where the X is the static longitudinal strength, the Y is the static transverse strength, the S is the static<br />
in-plane shear strength and the ζX is the stress on <strong>loading</strong> direction. When the unidirectional laminate<br />
fractures <strong>under</strong> static <strong>loading</strong>, the f(ζX) is equal to 1 and the ζX is equal to ζθ,ult. Substituting Eq. (1) into<br />
Eq.(2) yields<br />
<br />
4 2 2 4 2 2<br />
cos - cos sin sin cos sin <br />
= 1<br />
+ + (3)<br />
X Y S<br />
,ult 2 2 2<br />
where ζθ,ult is the static strength <strong>of</strong> the <strong>of</strong>f-axis unidirectional laminate on <strong>loading</strong> direction.<br />
Many laminate fatigue failure criterions were developed from the static failure criterion, as shown in<br />
the references [1-4] . In the developed criterions, a same mechanical hypothesis has been complied, which<br />
is the fatigue <strong>loading</strong> is processed as the quasi-static <strong>loading</strong>, the material properties degrade<br />
progressively and the laminate is identified with the new material at every cycle. Then, the static<br />
strength is substituted by the residual strength in the laminate static failure criterion. Based on the<br />
hypothesis, Brogdon [2] developed the laminate fatigue failure criterion from the Tsai-Hill model, as<br />
(1)
F Q Wu, W X Yao. / <strong>Fatigue</strong> life prediction <strong>of</strong> <strong>of</strong>f-axis unidirectional laminate<br />
2 2 2<br />
1 1 2 2 12<br />
- + + = 1<br />
(4)<br />
2 2 2 2<br />
X N X N Y N S N<br />
( ) ( ) ( ) ( )<br />
where N is the fatigue life. X(N), Y(N) and S(N) are the longitudinal fatigue strength, transverse fatigue<br />
strength and in-plane shear fatigue strength <strong>of</strong> laminate at fatigue life N, respectively. These values can<br />
be gotten from the correlated laminate S-N curves. For the θ angle <strong>of</strong>f-axis unidirectional laminate, the<br />
fatigue strength is ζθ(N) at fatigue life N. Then, substituting Eq.(1) into Eq.(2) yields<br />
4 2 2 4 2 2<br />
<br />
cos - cos sin sin cos sin 2<br />
+ + 2 2 2 (<br />
N ) = 1<br />
X ( N ) Y ( N ) S ( N ) <br />
<br />
Eq.(5) describes the relationship between the fatigue strength <strong>of</strong> θ angle <strong>of</strong>f-axis unidirectional laminate<br />
and the fatigue strengths <strong>of</strong> longitudinal, transverse and in-plane shear laminates. When the S-N curves<br />
<strong>of</strong> longitudinal, transverse and in-plane shear laminates had been gotten, the S-N curve <strong>of</strong> θ angle<br />
<strong>of</strong>f-axis unidirectional laminate can be calculated by Eq.(5).<br />
2.2 Failure analysis<br />
From longitudinal laminate to transverse laminate, the ply orientation angle <strong>of</strong> the <strong>of</strong>f-axis<br />
unidirectional laminate increases and the laminate strength decreases, monotonously. When the angle is<br />
smaller, the fiber is the main load bearing structure and the corresponding failure mode is fiber breakage.<br />
When the angle is larger, the matrix is the main load bearing structure and the corresponding failure<br />
mode is matrix cracking. The arrangement order <strong>of</strong> <strong>of</strong>f-axis unidirectional laminate S-N curves reflects<br />
the performance characteristics. The location <strong>of</strong> <strong>of</strong>f-axis unidirectional laminate S-N curve is<br />
monotonously decreasing with the increasing <strong>of</strong> ply orientation angle in the same coordinate. The<br />
longitudinal laminate S-N curve is the upper limit and the transverse laminate S-N curve is the lower<br />
limit. A lot <strong>of</strong> fatigue experimental investigations [1,3,5,12,13] reflect the rule, as shown in Fig 2.<br />
Fig. 2. The S-N curves <strong>of</strong> unidirectional laminates.<br />
253<br />
(5)
254<br />
Fifth International Conference on <strong>Fatigue</strong> <strong>of</strong> Composites<br />
To analyze the fatigue length relationship between <strong>of</strong>f-axis laminate and longitudinal and transverse<br />
laminate, a fatigue strength ratio has been defined, as<br />
( )<br />
K N<br />
( N ) Y ( N )<br />
( ) - ( )<br />
-<br />
=<br />
X N Y N<br />
According to the mechanics significance <strong>of</strong> variables, the fatigue strength size order is Y(N) ≤ ζθ(N) ≤<br />
X(N) in Eq.(6). Therefore, the value range <strong>of</strong> fatigue strength ratio is 0 ≤ K(N) ≤ 1. Substituting Eq.(5) to<br />
Eq.(6) yields<br />
( )<br />
K N<br />
=<br />
4 2 2 4 2 2<br />
cos - cos sin sin cos sin <br />
1 + + - Y N<br />
( ) ( ) ( )<br />
X ( N ) - Y ( N )<br />
2 2 2<br />
X N Y N S N<br />
where the fatigue strengths X(N), Y(N) and S(N) are the functions about the fatigue life N. which are the<br />
S-N curve functions <strong>of</strong> the unidirectional laminates. The Eq.(7) shows that the fatigue strength ratio<br />
K(N) is the function about the fatigue life N and the ply orientation angle θ <strong>of</strong> <strong>of</strong>f-axis unidirectional<br />
laminate. To analyze the mechanics meaning <strong>of</strong> K(N), the boundary conditions <strong>of</strong> Eq.(7) are gotten, as<br />
1) when the fatigue life N equals 1, the K(N) equals K0,<br />
2) when the θ equals 0°, the K(N) equals 1;<br />
3) when the θ equals 90°, the K(N) equals 0.<br />
2.3 prediction model<br />
K<br />
0<br />
,ult -Y<br />
= ;<br />
X -Y<br />
The S-N curves <strong>of</strong> the longitudinal and transverse laminates can be gotten by the fatigue experiment.<br />
But the cast is high and the accuracy is low to get the S-N curve <strong>of</strong> the in-plane shear laminate by<br />
experiment. To analyze mathematically, there are other functions describing or approximating the<br />
relationship between K(N) and N, θ, which the function form is different from the Eq.(7). The function<br />
is defined as<br />
( ) ( ,<br />
)<br />
( )<br />
K N = g N<br />
(8)<br />
The larger the fatigue <strong>loading</strong> is, the more the done work and the fatigue damage <strong>of</strong> laminate are, the<br />
less the fatigue life is. The fatigue strength <strong>of</strong> the <strong>of</strong>f-axis unidirectional laminate is monotonously<br />
decreasing with the laminate fatigue life increasing, which is shown in many experiment results. Fig.3<br />
describes the mathematic characteristic <strong>of</strong> the change, as<br />
(6)<br />
(7)
F Q Wu, W X Yao. / <strong>Fatigue</strong> life prediction <strong>of</strong> <strong>of</strong>f-axis unidirectional laminate<br />
Fig. 3. The fatigue strength ratio K(N).<br />
It is clear that the K(N) changes with the change fatigue life N in the Fig.3. But the quantitative relation<br />
between K(N) and lgN is unclear. The relation is considered a linear relationship based on the change<br />
trend <strong>of</strong> the laminate S-N curve in this paper. The unidirectional laminate strength is decreasing with the<br />
ply orientation angle increasing. The larger the fatigue strength is, the smaller the ply orientation angle<br />
at the same fatigue life N, as shown in Fig.2. So, the fatigue strength ratio K(N) is decreasing with the<br />
angle θ increasing, as shown in Fig.3. According to the function g(θ,N) meaning and purpose, the Eq.(8)<br />
should have the same change characteristics and boundary conditions with Eq.(7). Therefore, the<br />
function g(θ,N) has been proposed as<br />
( ) ( )<br />
( ,ult -Y)( X -,ult)<br />
K N = g , N = K - <br />
lg N<br />
( X - Y)<br />
0 2<br />
where the parameter ζ is the proportional coefficient, which can be gotten by fitting experiment data.<br />
When the experiment data are lacked, ζ = YT/XT is commended, which XT is the static tensile strength <strong>of</strong><br />
longitudinal laminate and YT is the static tensile strength <strong>of</strong> transverse laminate. Substituting Eq.(6) into<br />
Eq.(9) yields<br />
-Y X -<br />
<br />
<br />
<br />
X -Y X -Y<br />
,ult ,ult<br />
( N ) = Y ( N ) + 1- lg N ( X ( N ) -Y<br />
( N ) )<br />
Eq.(10) describes the quantitative relationship between the fatigue strength <strong>of</strong> the <strong>of</strong>f-axis unidirectional<br />
laminate and the fatigue strengths <strong>of</strong> the longitudinal and transverse laminates. When the S-N curves <strong>of</strong><br />
the longitudinal and transverse laminates have been gotten, the S-N curve <strong>of</strong> the <strong>of</strong>f-axis unidirectional<br />
laminate can be calculated by Eq.(10). To analyze the Eq.(10) deeply, it is found that the fatigue life <strong>of</strong><br />
the <strong>of</strong>f-axis unidirectional laminates can be calculated with any two known unidirectional laminate S-N<br />
curves.<br />
The S-N curve model is used to describe the unidirectional laminate S-N curve. The model has been<br />
chosen in this paper, which is proposed by reference [14] , as<br />
255<br />
(9)<br />
(10)
256<br />
Fifth International Conference on <strong>Fatigue</strong> <strong>of</strong> Composites<br />
( )<br />
a<br />
N lg N <br />
= 1+ mexp<br />
--1 <br />
ult<br />
b <br />
<br />
where ζ(N) is the material fatigue strength, ζult is the material static strength on the <strong>loading</strong> orientation,<br />
a, b and m are the experimental parameters. The model can describe all regions <strong>of</strong> the material S-N<br />
curve.<br />
3. Verification<br />
According to the experimental data <strong>of</strong> unidirectional laminate, the S-N curves <strong>of</strong> longitudinal and<br />
transverse laminates was gotten by the Eq.(11). To fit the experimental data, the parameters a, b and m<br />
were gotten by the least square method. Then, substituting the characteristic values <strong>of</strong> X, Y, S and θ <strong>of</strong><br />
unidirectional laminate into Eq.(10) yields the S-N curve <strong>of</strong> the laminate. Based on Eq.(10), the fatigue<br />
life <strong>of</strong> the <strong>of</strong>f-axis unidirectional laminate is predicted finally. The comprehensive experimental data<br />
published in Refs.[1,3,5,12,13] were used to validate the proposed fatigue life prediction model.<br />
According to the proposed algorithm, the fatigue life <strong>of</strong> the <strong>of</strong>f-axis unidirectional laminate is calculated.<br />
The property values, S-N curve parameters and predicted results <strong>of</strong> laminates <strong>of</strong> this work are presented<br />
in Tables 1, 2 and Figures 4-15, respectively.<br />
Composite<br />
Table 1. Static mechanical properties <strong>of</strong> <strong>composite</strong><br />
Longitudinal tensile<br />
strength X (MPa)<br />
Transverse tensile<br />
strength Y (MPa)<br />
Shear strength<br />
S (MPa)<br />
Glass/Epoxy [1] 1234.8 28.4 37.9<br />
Graphite/Epoxy [3] 1836 56.9 93<br />
E-Glass/Epoxy [5] 778.7 44.7 55<br />
T800H/2500 [12] 2472 48 60<br />
Carbon/PEEK [13] 2128 93 133<br />
Fig. 4. The predicted lives and experimental lives <strong>of</strong> Glass/Epoxy unidirectional laminates (R = 0.1).<br />
(11)
Composite<br />
Glass/Epoxy [1]<br />
Graphite/Epoxy [3]<br />
E-Glass/Epoxy [5]<br />
T800H/2500 [12]<br />
Carbon/PEEK [13]<br />
F Q Wu, W X Yao. / <strong>Fatigue</strong> life prediction <strong>of</strong> <strong>of</strong>f-axis unidirectional laminate<br />
Table 2. The parameters <strong>of</strong> S-N curves <strong>of</strong> unidirectional laminates<br />
Unidirectional<br />
laminate<br />
Stress Ratio R a b m<br />
0° 0.1 2.6446 5.5829 0.7636<br />
60° 0.1 2.0031 8.1227 1.0<br />
[0]16 0.1 1.5021 7.1003 1.0<br />
[90]16 0.1 2.7437 4.3002 0.6001<br />
[0]10<br />
[90]20<br />
[0]16<br />
[90]16<br />
0.5 3.8535 4.271 0.3423<br />
0 3.4582 6.07 0.743<br />
-1 1.1282 6.858 1.0<br />
0.5 1.026 16.117 1.0<br />
0 1.3967 4.6964 0.865<br />
-1 2.7525 3.904 0.6735<br />
0.5 2.1484 5.2880 0.8001<br />
0.1 1.7504 3.2907 0.5590<br />
0.5 2.6767 2.4422 0.4201<br />
0.1 2.5921 3.4316 0.6246<br />
-1 2.1949 3.3457 0.7267<br />
[10]16 -1 1.7092 2.9149 0.6372<br />
[0]16<br />
[90]16<br />
0.2 1.8192 9.7871 1.0<br />
0 2.6042 4.8671 0.4551<br />
5 1.6166 8.8254 1.0<br />
-∞ 1.7204 8.1263 1.0<br />
0.2 1.6781 7.0601 1.0<br />
0 1.6251 5.0772 0.8102<br />
5 1.4771 6.5589 1.0<br />
-∞ 1.3349 6.2166 1.0<br />
257
258<br />
Fifth International Conference on <strong>Fatigue</strong> <strong>of</strong> Composites<br />
Fig. 5. The predicted lives and experimental lives <strong>of</strong> Graphite/Epoxy unidirectional laminates (R = 0.1).<br />
Fig. 6. The predicted lives and experimental lives <strong>of</strong> E-Glass/Epoxy unidirectional laminates (R = 0.5).<br />
Fig. 7. The predicted lives and experimental lives <strong>of</strong> E-Glass/Epoxy unidirectional laminates (R = 0).
F Q Wu, W X Yao. / <strong>Fatigue</strong> life prediction <strong>of</strong> <strong>of</strong>f-axis unidirectional laminate<br />
Fig. 8. The predicted lives and experimental lives <strong>of</strong> E-Glass/Epoxy unidirectional laminates (R = -1).<br />
Fig. 9. The predicted lives and experimental lives <strong>of</strong> T800H/2500 unidirectional laminates (R = 0.5).<br />
Fig. 10. The predicted lives and experimental lives <strong>of</strong> T800H/2500 unidirectional laminates (R = 0.1).<br />
259
260<br />
Fifth International Conference on <strong>Fatigue</strong> <strong>of</strong> Composites<br />
Fig. 11. The predicted lives and experimental lives <strong>of</strong> T800H/2500 unidirectional laminates (R = -1).<br />
Fig. 12. The predicted lives and experimental lives <strong>of</strong> Carbon/PEEK unidirectional laminates (R = 0.2).<br />
Fig. 13. The predicted lives and experimental lives <strong>of</strong> Carbon/PEEK unidirectional laminates (R = 0).
F Q Wu, W X Yao. / <strong>Fatigue</strong> life prediction <strong>of</strong> <strong>of</strong>f-axis unidirectional laminate<br />
Fig. 14. The predicted lives and experimental lives <strong>of</strong> Carbon/PEEK unidirectional laminates (R = 5).<br />
Fig. 15. The predicted lives and experimental lives <strong>of</strong> Carbon/PEEK unidirectional laminates (R = -∞).<br />
The results show that Eq.(10) predicts reasonably the fatigue life <strong>of</strong> the <strong>of</strong>f-axis unidirectional<br />
laminate and the predicted results <strong>of</strong> large angle laminate are better than ones <strong>of</strong> small angle laminate.<br />
4. Discussion and Conclusions<br />
The laminate S-N curve is one <strong>of</strong> the important mechanics data in <strong>composite</strong> engineering structure<br />
design. To get the laminate S-N curve, the main engineering approach is fatigue experiment, now. But<br />
the laminate structure type with the same material is infinite because <strong>of</strong> its designability. It is<br />
unacceptable that every kind laminate S-N curve is gotten by the fatigue experiment. Therefore, the<br />
efficient analysis method should be built to obtain the laminate fatigue life, which has practical<br />
engineering value. Many investigations had been done and a promising ideal is developed, that is to<br />
build an analysis approach as the classical laminate theory, which the fatigue life <strong>of</strong> laminate can be<br />
predicted by the fatigue life <strong>of</strong> the special laminate. The first problem <strong>of</strong> the approach is how to predict<br />
261
262<br />
Fifth International Conference on <strong>Fatigue</strong> <strong>of</strong> Composites<br />
the fatigue life <strong>of</strong> the unidirectional laminate by the special laminate fatigue life. To resolve the problem,<br />
the internal relations among the laminates should be investigated.<br />
In this paper, the unidirectional laminate fatigue failure mechanics is analyzed and the mechanical<br />
hypothesis is accepted. Based on the hypothesis, the fatigue failure criterion is developed from the static<br />
failure criterion in laminate. To analyze the phenomenon, the location <strong>of</strong> the <strong>of</strong>f-axis laminate S-N curve<br />
is monotonously decreasing with the increasing <strong>of</strong> ply orientation angle in the same coordinate.<br />
According to the mechanical investigation and the function mathematics analyzing, the fatigue life<br />
prediction model had been proposed, which predicts the <strong>of</strong>f-axis unidirectional laminate S-N curve by<br />
the S-N curves <strong>of</strong> the longitudinal and transverse laminates or any two known unidirectional laminate.<br />
Twelve sets <strong>of</strong> experimental data <strong>of</strong> five kinds <strong>of</strong> laminates are employed to verify the model and the<br />
results show the model is reasonable.<br />
The proposed model function describes the relationship between the fatigue life and the fatigue<br />
strength <strong>of</strong> the <strong>of</strong>f-axis unidirectional laminate. But the description is not perfect. The ζ is the important<br />
parameter to affect the fatigue life prediction accuracy in the proposed model. However, the value <strong>of</strong> ζ is<br />
the fitting value <strong>of</strong> the experimental data and lacks the mechanical theory basis. Maybe, it is the<br />
important reason <strong>of</strong> causing the error between the predicted values and the experimental data.<br />
Acknowledgements<br />
The authors would like to acknowledge financial support from scientific research foundation<br />
(No.1001-909328) and research Innovation Foundation (No.1001-XCA10008) <strong>of</strong> Nanjing University <strong>of</strong><br />
Aeronautics and Astronautics, National defense research foundation <strong>of</strong> China (No.1001-I110018).<br />
References<br />
[1] Z Hashin, A Rotem. A fatigue failure criterion for fiber-reinforced materials. Journal <strong>of</strong> Composite Materials, 1973, 7(4): 448~464.<br />
[2] D F Sims, V H Brogdon. <strong>Fatigue</strong> behavior <strong>of</strong> <strong>composite</strong>s <strong>under</strong> different <strong>loading</strong> modes. K L Reifsnider, K N Lauraitis, editors. <strong>Fatigue</strong> <strong>of</strong><br />
filamentary <strong>composite</strong> materials, ASTM STP 636. 1977, 185~205.<br />
[3] Awerbuch Jonathan, Hahn H T. Off-axis fatigue <strong>of</strong> graphite/epoxy <strong>composite</strong>. <strong>Fatigue</strong> <strong>of</strong> fibrous <strong>composite</strong> materials, ASTM STP 723.<br />
1981, 243~273.<br />
[4] M H R Jen, C H Lee. Strength and life in thermoplastic <strong>composite</strong> laminates <strong>under</strong> static and fatigue loads. Part II: formulation.<br />
International journal <strong>of</strong> fatigue.1998, 20(9): 617~629.<br />
[5] H E Kadi, F Ellyin. Effect <strong>of</strong> stress ratio on the fatigue <strong>of</strong> unidirectional glass fibre/epoxy <strong>composite</strong> laminae. Composites, 1994, 25(10):<br />
917~924.<br />
[6] A Plumtree, G X Cheng. A fatigue damage parameter for <strong>of</strong>f-axis unidirectional fibre-reinforced <strong>composite</strong>s. International journal <strong>of</strong><br />
fatigue. 1999, 21(8): 849~856.<br />
[7] J Petermann, A Plumtree. A unified fatigue failure criterion for unidirectional laminates. Composites: Part A. 2001, 32(1): 107~118.<br />
[8] M Shokrieh Mahmood, F Taheri-Behrooz. A unified fatigue life model based on energy method. Composite Structures. 2006, 75(1-4):<br />
444~450.<br />
[9] A Varvani-Farahani, H Haftchenari, M Panbechi. A fatigue damage parameter for life assessment <strong>of</strong> <strong>of</strong>f-axis unidirectional GRP<br />
<strong>composite</strong>s. Journal <strong>of</strong> Composite Materials. 2006, 40(18): 1659~1670.<br />
[10] Z Fawaz, F Ellyin. <strong>Fatigue</strong> failure model for fibre-reinforced materials <strong>under</strong> general <strong>loading</strong> conditions. Journal <strong>of</strong> Composite Materials,<br />
1994, 28(15): 1432~1451.<br />
[11] M Kawai. A phenomenological model for <strong>of</strong>f-axis fatigue behavior <strong>of</strong> unidirectional polymer matrix <strong>composite</strong>s <strong>under</strong> different stress<br />
ratios. Composite Part A. 2004, 35(7-8): 955~963.<br />
[12] M Kawai, H Suda. Effects <strong>of</strong> non-negative mean stress on the <strong>of</strong>f-axis fatigue behavior <strong>of</strong> unidirectional Carbon/Epoxy <strong>composite</strong>s at<br />
room temperature. Journal <strong>of</strong> Composite Materials, 2004, 38(10): 833~854.
F Q Wu, W X Yao. / <strong>Fatigue</strong> life prediction <strong>of</strong> <strong>of</strong>f-axis unidirectional laminate<br />
[13] M H R Jen, C H Lee. Strength and life in thermoplastic <strong>composite</strong> laminates <strong>under</strong> static and fatigue loads. Part I: experimental.<br />
International journal <strong>of</strong> fatigue.1998, 20(9): 605~615.<br />
[14] Wu Fuqiang, Yao Weixing. A new model <strong>of</strong> the fatigue life curve <strong>of</strong> materials. China Mechanical Engineering. 2008, 19(13): 1634~1637.<br />
263
Post-Impact <strong>Fatigue</strong> Damage Monitoring using Fiber Bragg<br />
Grating Sensors<br />
Abstract<br />
C S Shin *, S W Yang<br />
Department <strong>of</strong> Mechanical Engineering, National Taiwan University, No.1, Sec.4, Roosevelt Road, Taipei 10617, Republic <strong>of</strong> China<br />
Foreign object impact on <strong>composite</strong> may cause insidious damages that may grow to catastrophic failure <strong>under</strong> service<br />
<strong>loading</strong>. On using embedded fiber Bragg grating (FBG) to monitor these damage evolution in Graphite/Epoxy <strong>composite</strong>s,<br />
we found the characteristic FBG spectrum gradually submerged against a rise <strong>of</strong> background intensity. By skipping the<br />
impact, directing the impact to positions away from the FBG and examining the extracted fibers, we concluded the above<br />
changes are due solely to damages in the <strong>composite</strong> initiated by the impact and aggravated by fatigue <strong>loading</strong>. Evolution<br />
<strong>of</strong> the grating spectrum reflects qualitatively the development <strong>of</strong> the incurred damages.<br />
Keywords: graphite epoxy <strong>composite</strong>; post-impact fatigue; structural health monitoring; fiber Bragg grating; damage evolution monitoring<br />
1. Introduction<br />
Composite structures such as aircraft wings or wind turbine blades are vulnerable to impact damage<br />
due to tool drop, bird-strike and hailstorm. The damages caused are <strong>of</strong>ten not evident on the surface and<br />
involved a number <strong>of</strong> different failure mechanisms such as delamination, debonding and matrix<br />
cracking [1] . However, on subsequent cyclic service <strong>loading</strong>, these microstructural defects may grow and<br />
eventually lead to catastrophic failures. Current non-destructive examination techniques are only<br />
sensitive to some <strong>of</strong> these failure mechanisms and are responsive only when the defect reaches a certain<br />
size. It is <strong>of</strong>ten impracticable to use these techniques for close monitoring <strong>of</strong> the development <strong>of</strong> these<br />
defects. Recently, there are general interests in the development <strong>of</strong> smart sensors integrated into<br />
structures to ensure continuous structural integrity monitoring. Fiber Bragg Grating (FBG) is one <strong>of</strong><br />
such sensor element that finds increasing applications [2-6] . Optical fiber sensors have been shown to be<br />
able to monitor impact event occurrence [7, 8] and detect impact damages in <strong>composite</strong>s [9, 10] . Optical<br />
fiber has a small diameter, long fatigue life and may be embedded inside a <strong>composite</strong> material and<br />
literally come into contact or at least into very close proximity <strong>of</strong> the internal defects. The output from<br />
an FBG is the shifting and changing shape <strong>of</strong> its characteristic reflected spectrum. There is no simple<br />
correlation between the spectrum changes and the damage mechanism involved. In the current work, we<br />
investigated the feasibility <strong>of</strong> employing fiber Bragg gratings (FBG) sensor to monitor the growth <strong>of</strong><br />
post-impact fatigue defects.<br />
* Corresponding author. Tel.: 886-2-23622160<br />
E-mail address: csshin@ntu.edu.tw
2. Experimental procedures<br />
C S Shin, S W Yang. / Post-Impact <strong>Fatigue</strong> Damage Monitoring using Fiber Bragg Grating Sensors<br />
Quasi-isotropic laminates with T300/3501 Graphite/Epoxy prepreg stacked in the sequence<br />
[0/45/90/-45]s were cut into specimen coupons (200mm25.4mm1mm). FBG sensors were embedded<br />
in the two outer 0 o laminae along the axial <strong>loading</strong> direction as shown in Fig.1a. Each <strong>of</strong> the fibers was<br />
<strong>of</strong>fset by 3mm from the centerline <strong>of</strong> the specimen. The fibers are led into the specimen coupon at one<br />
side and terminate inside the specimen at some distance short <strong>of</strong> the gripping position at the other side,<br />
as shown in Fig.1b. FBGs were fabricated in a Ge–B co-doped single mode fiber by side writing using a<br />
phase mask with a period <strong>of</strong> 1.05 m. The sensing length <strong>of</strong> the FBGs was about 10 mm. The<br />
reflectivity <strong>of</strong> the resulting FBG was about 99%, and the peak wavelengths were from 1550 and<br />
1551nm. The FWHM (full width half maximum) <strong>of</strong> the FBGs was about 0.175 nm. Impacts were<br />
made at one <strong>of</strong> the three locations designated A, B and C in Fig.1b, using a 260g aluminum falling<br />
weight from a height <strong>of</strong> 140cm with an apparatus that conforms to ASTM D5628. Positions A and C are<br />
respectively 30mm upstream and downstream <strong>of</strong> B as shown. The fiber on the side that faces the impact<br />
is designated L1 and the one on the back surface L4. After impact the coupons were subjected to cyclic<br />
<strong>loading</strong> from 0.5-5 kN at a frequency <strong>of</strong> 5Hz using an MTS servo-hydraulic test machine. The reflected<br />
spectra from the FBGs were interrogated periodically using an Anritsu optical spectrum analyzer<br />
(MS9710C OSA) <strong>under</strong> the load-free condition. Ultrasonic C-scan was also employed to examine the<br />
impact damage before and after the fatigue test. The above tests have also been repeated on specimens<br />
without <strong>under</strong>going any impact to serve as control. Fiber extraction was attempted in order to examine<br />
the integrity <strong>of</strong> the FBG after the impact and fatigue <strong>loading</strong>.<br />
Fig. 1. (a) Lay out <strong>of</strong> the prepreg stacking and the embedded optical fiber sensors; (b) positions <strong>of</strong> impact relative to the fiber sensor.<br />
3. Basic properties <strong>of</strong> fiber Bragg grating sensors<br />
When a broadband light is coupled into an optical fiber with a uniform Bragg grating, a single peak<br />
with wavelength satisfying the Bragg diffraction criterion will be reflected while the other<br />
wavelengths will be transmitted through:<br />
= 2neL (1)<br />
where ne is the effective refractive index and Λ is the periodicity <strong>of</strong> the grating. If the uniformity <strong>of</strong> the<br />
grating period is perturbed, the single peak reflected spectrum will broaden or chirped. When either or<br />
both <strong>of</strong> the ne and Λ change, the center wavelength <strong>of</strong> the reflected spectrum shifts. Λ will be changed if<br />
the FBG is subjected to a deformation. Such deformation may be caused by mechanical or thermal<br />
strains. ne will be affected by variation in temperature and the three-dimensional stress state acting on<br />
265
266<br />
Fifth International Conference on <strong>Fatigue</strong> <strong>of</strong> Composites<br />
the fiber. In general, the reflected wavelength will shift by ~1pm <strong>under</strong> a strain <strong>of</strong> 1 or a temperature<br />
change <strong>of</strong> 0.1 o C. If temperature variation is negligible, then the change in the spectrum basically reflects<br />
a change in the stress/strain status along the FBG.<br />
4. Results and Discussion<br />
Impact at position B<br />
Fig.2 shows the FBG spectra just before and after impact for the fibers L1 and L4. Originally each <strong>of</strong><br />
the FBG spectra has a single sharp peak. On embedding, curing and cutting into testing coupons, a shift<br />
in peak wavelength together with slight widening and splitting <strong>of</strong> the peak occurred as is evident in the<br />
solid lines in fig.2. This may be attributed to residual stresses that arose during the <strong>composite</strong><br />
fabrication process. After the impact damage, the original peaks widened even more and split heavily<br />
into a number <strong>of</strong> distinct peaks (broken lines in fig.2). The above phenomena are more prominent in the<br />
spectrum from the L1 fiber. Such a change in the spectra suggests the strain distribution along the FBG<br />
has changed from roughly uniform to highly non-uniform. The latter is probably caused by the impact<br />
induced internal defects that have perturbed the residual stress field near the FBG.<br />
Fig.2. FBG spectra before and after impact damage.<br />
The impact damaged specimen was then subjected to cyclic <strong>loading</strong>. Fig.3 compares the impact<br />
damage visualized by ultrasonic C-scan before and after 200,000 fatigue cycles. Slight enlargement <strong>of</strong><br />
the delaminated area can be seen. The extents <strong>of</strong> damage at a number <strong>of</strong> sections (1-1 through 4-4 in<br />
Fig.3) were examined <strong>under</strong> an optical microscope. Fig.4 shows typical observation at section 2-2. Note<br />
that the specimen in Fig.4a is different from that in Fig.4b as this examination is destructive.<br />
Delamination and matrix cracking occurred extensively in the lower half <strong>of</strong> the section. Marked<br />
aggravation <strong>of</strong> these damages is evident in Fig.4b during the cyclic <strong>loading</strong>. No significant damage is<br />
seen in the 1-1 and 4-4 sections.
C S Shin, S W Yang. / Post-Impact <strong>Fatigue</strong> Damage Monitoring using Fiber Bragg Grating Sensors<br />
Fig.3. Ultrasonic C-scan images <strong>of</strong> post impact damage at 0 cycle and 200000 cycles.<br />
Fig.4. Optical micrograph <strong>of</strong> the section 2-2 showing the positions <strong>of</strong> the fiber sensor and the extent <strong>of</strong> post-impact damage<br />
(a) just after impact; (b) after 200,000 cycles.<br />
The FBG spectra at various <strong>loading</strong> cycles are shown in Fig.5. On cycling, the peaks in the L1<br />
spectrum continued to widen gradually. The intensity <strong>of</strong> the background wavelengths tends to rise. At<br />
the end <strong>of</strong> 200,000cycles, the original peaks can still be recognized though they are not as distinct as<br />
before due to the rise in intensity <strong>of</strong> the background wavelengths. For the L4 spectrum, the intensity rise<br />
<strong>of</strong> the wavelengths surrounding the original peak occurred rapidly and at end <strong>of</strong> 200,000cycles, no peak<br />
is discernible in the spectrum. A possible cause <strong>of</strong> the gradual widening and submersion <strong>of</strong> the spectra<br />
peaks is the continuous development <strong>of</strong> the original impact damage in the <strong>composite</strong> that perturbs the<br />
strain field and caused steep strain gradient in the vicinity <strong>of</strong> the FBGs. If this is the case, then<br />
development <strong>of</strong> the FBG spectra may be employed to monitor the aggravation <strong>of</strong> the impact damage in<br />
a qualitative manner. However, the lost <strong>of</strong> reflection peak may also be caused by one or more <strong>of</strong> the<br />
following mechanisms: (1) fracture <strong>of</strong> the optical fiber, the flat smooth end <strong>of</strong> a nicely cleaved fiber may<br />
sometimes act as mirror which reflect lights without discrimination on the wavelength. If this fracture<br />
occurs somewhere within the FBG section, it may give spectra similar to that in Fig.5. (2)<br />
microcracking in the fiber causes stress concentration which alters the refractive index through the<br />
photoelastic effect, thus degrading the periodicity <strong>of</strong> the grating. The high temperature and pressure in<br />
the curing process, the impact <strong>loading</strong> and the soaking in water during C-scan examination may all be<br />
liable to induce defects that lead to microcracking in the optical fiber. The subsequent cyclic <strong>loading</strong>,<br />
alone or with the help from the former, may bring about fracture or microcracking. A number <strong>of</strong><br />
267
268<br />
Fifth International Conference on <strong>Fatigue</strong> <strong>of</strong> Composites<br />
experiments have therefore been designed to differentiate the responsible mechanisms.<br />
Impact at positions A or C<br />
Fig.5. Spectra changes from embedded FBGs in (a) L1 and (b) L4 with various fatigue cycles<br />
<strong>under</strong> a 140cm drop height and impact at position B.<br />
By keeping all aspects <strong>of</strong> the above experiment the same except the position <strong>of</strong> the impact damage,<br />
we may be able to test the micro-cracking and the fractured FBG hypotheses. By impacting at position<br />
A, any microcracks induced in this section <strong>of</strong> the optical fiber will not be able to affect the FBG<br />
downstream. If eventually fracture <strong>of</strong> the optical fiber occurred, the reflected spectra will either be<br />
extinguished or reflect all wavelength without discrimination. During the development <strong>of</strong> the fracture,<br />
severe weakening <strong>of</strong> the FBG peak will occur as the incident light is cut down. A gradual submersion <strong>of</strong><br />
the FBG peak may also occur if part <strong>of</strong> light is reflected at the crack. If this occurs, we expect the<br />
process to develop quickly as the rise in the background intensity is complemented by a drop in the<br />
FBG peak intensity. Following the same line <strong>of</strong> reasoning, the above outcomes, except extinguishment<br />
<strong>of</strong> signal and weakening <strong>of</strong> the FBG peak, will also hold if impact is made at position C.<br />
For impact at either position, the resulting FBG spectra in the L1 fibers indeed maintained more or<br />
less the same Bragg reflection peak throughout the 200,000 fatigue <strong>loading</strong> cycles. However, that in the<br />
L4 showed the gradual peak submersion with the rise in intensity <strong>of</strong> the surrounding wavelengths<br />
(Fig.6). This renders the degradation <strong>of</strong> FBG periodicity by microcracks in the optical fiber hypothesis<br />
unlikely. A subtle difference between Figs 5 and 6 is that the submersion <strong>of</strong> the FBG peaks is delayed or<br />
occurring at a slower rate in the latter. For impact at position A, the FBG peak submersion occurred<br />
early but is still discernible after 200,000 cycles (Fig.6a). Since there is no significant reduction in the<br />
peak intensity, fiber fracture is unlikely the cause. For impact at position C, the FBG peak is maintained<br />
up to 160,000 cycles and submersion started to occur at 200,000 cycles (Fig.6b). The fiber fracture<br />
hypothesis cannot be conclusively ruled out here.<br />
A further possibility is the impact or the subsequent fatigue may have induced some matrix cracking<br />
at position B. Such cracking, if existed, will be rare as it is at a distance from the impact. This may<br />
explain the slower submersion <strong>of</strong> the FBG peaks in Fig.6. Moreover, if such cracking is induced by the<br />
original impact, it is unlikely to occur on the compressive side. This may explain the observation that
C S Shin, S W Yang. / Post-Impact <strong>Fatigue</strong> Damage Monitoring using Fiber Bragg Grating Sensors<br />
the FBG spectra in the L1 fibers remained more or less intact.<br />
<strong>Fatigue</strong> without impact<br />
Fig.6. Spectra from embedded FBGs in L4 with fatigue cycles for impact at positions (a) A and (b) C.<br />
Fig.7 shows the development <strong>of</strong> FBG spectra in a specimen that has <strong>under</strong>gone all the treatments as<br />
above except that no impact has been made. It can be seen that the curing process, the soaking into<br />
water for C-scan examination and the subsequent fatigue <strong>loading</strong> has not caused observable degradation<br />
<strong>of</strong> the FBG spectra during the 200,000 cycles <strong>of</strong> <strong>loading</strong>. The FBG peaks retained their shapes but<br />
drifted to longer wavelengths. This suggests that the current level <strong>of</strong> fatigue <strong>loading</strong> alone did not cause<br />
the defects that induce submersion <strong>of</strong> the FBG spectra as observed in Figs. 5 and 6. Such defects must<br />
have been initiated by the pre-fatigue impact and fatigue <strong>loading</strong> only aids their development and<br />
propagation.<br />
Fig.7. Spectra development from embedded FBGs in (a) L1 and (b) L4 with fatigue cycles in specimen without impact.<br />
Extracting and examining the FBG from the post-impact fatigued specimens<br />
269
270<br />
Fifth International Conference on <strong>Fatigue</strong> <strong>of</strong> Composites<br />
Although the above tests have identified that the root cause <strong>of</strong> the FBG spectra changes during<br />
post-impact fatigue is the defects initiated by the impact, it is still inconclusive that whether such<br />
damages are induced in the <strong>composite</strong> or in the optical fiber or both. To clarify this, we soaked the<br />
post-impact fatigued specimens in acetone for 1 day, hoping to dissolve the resin and extract the optical<br />
fibers for examination. It was found that soaking has s<strong>of</strong>tened the resin to a great extent but did not<br />
dissolve it altogether. However, the Bragg spectrum has partially been restored after soaking. By<br />
carefully dissecting the s<strong>of</strong>tened specimens to draw out the optical fibers, we find that the fiber appeared<br />
intact and its characteristic FBG spectrum has been restored (Fig.8).<br />
Fig.8. Comparison <strong>of</strong> FBG spectra (i) before embedded in the <strong>composite</strong> specimen; (ii) after post impact fatigue for 200,000 cycles and (iii) after<br />
fiber extraction from the post impact fatigued <strong>composite</strong> specimen.<br />
Finally, to check whether there is any defect or microcracks induced in the optical fiber, the above<br />
extracted fiber was stuck on a thin spring steel strip. The later was bent to different curvatures while the<br />
FBG spectra were monitored. A strain gage stuck alongside the FBG recorded the strain at each<br />
curvature. Fig.9 shows the FBG spectra at different applied strain. It can be seen that the Bragg<br />
reflection peak shift to the right in proportion to the applied tensile strain. The shape <strong>of</strong> the peak<br />
maintained the same without any distortion or rising <strong>of</strong> the background intensity. This proves beyond<br />
doubt that the FBG sensor is defect-free and that the submersion <strong>of</strong> the reflection peaks in Fig.5 and 6<br />
can only be attributed to the steep strain gradient in the <strong>composite</strong> specimen in the vicinity <strong>of</strong> the FBGs.<br />
Such steep strain gradient has to be caused by the growing damages initiated by the impact and<br />
aggravated by the cyclic <strong>loading</strong>.
C S Shin, S W Yang. / Post-Impact <strong>Fatigue</strong> Damage Monitoring using Fiber Bragg Grating Sensors<br />
Fig. 9. Comparison <strong>of</strong> FBG spectra (i) before embedded in the <strong>composite</strong> specimen; (ii) after post impact fatigue for 200,000 cycles and (iii) after<br />
fiber extraction from the <strong>composite</strong> specimen.<br />
We may conclude that the fiber Bragg grating sensor successively survive a low velocity impact and<br />
the subsequent fatigue <strong>loading</strong>. The fading <strong>of</strong> the FBG peak in Fig.5 may be explained by the initial<br />
damage has developed to such an extent that it is approaching the FBG and has exerted steep strain<br />
gradients on the matrix surrounding the FBG, despite the fact that C-scan indicated otherwise. Thus,<br />
evolution <strong>of</strong> the grating spectrum reflects qualitatively the development in severity and proximity <strong>of</strong> the<br />
incurred damages. Quantitative correlation is deemed impracticable as the damages involved are<br />
complicated and may vary from case to case. Nevertheless, with suitably placed FBG (say on the back<br />
surface opposite an impact), one may be able to monitor status <strong>of</strong> structural health and give an alarm<br />
when the damage has grown beyond a certain size. The current tool will be especially helpful if one<br />
wants to monitor the effectiveness and long-term durability <strong>of</strong> a patch repair <strong>of</strong> the impact damage.<br />
More works are <strong>under</strong>taken in these directions.<br />
5. Conclusion<br />
Embedded fiber Bragg gratings have been employed to monitor the post-impact fatigue damage<br />
development. It has been found that the fiber Bragg grating sensor can survive a low velocity impact<br />
and the subsequent fatigue <strong>loading</strong>. Evolution <strong>of</strong> the grating spectrum reflects qualitatively the<br />
development in severity and proximity <strong>of</strong> the damages incurred in the <strong>composite</strong> material.<br />
Acknowledgement<br />
This work was carried out with support <strong>of</strong> the National Science Council projects<br />
(NSC96-2628-E-002-223-MY3). We are also indebted to Pr<strong>of</strong>. S. K. Liaw <strong>of</strong> Department <strong>of</strong> Electronic<br />
Engineering <strong>of</strong> National Science and Technology University for some <strong>of</strong> the equipment support.<br />
271
272<br />
References<br />
Fifth International Conference on <strong>Fatigue</strong> <strong>of</strong> Composites<br />
[1] Ramesh Talreja. <strong>Fatigue</strong> <strong>of</strong> <strong>composite</strong> Materials. Technomic Publishing Co. Inc. Lancater. Penn. U.S.A.: 1987: 3-58.<br />
[2] Takeda, Nobuo; Mizutani, Tadahito; Hayashi, Kentaro; Okabe, Yoji. Application <strong>of</strong> fiber Bragg grating sensors to real-time strain<br />
measurement <strong>of</strong> cryogenic tanks. Proceedings <strong>of</strong> SPIE - The International Society for Optical Engineering 2003: 5056: 304-311<br />
[3] Skontorp, Arne. Structural integrity <strong>of</strong> quasi-isotropic <strong>composite</strong> laminates with embedded optical fibers. Journal <strong>of</strong> Reinforced<br />
Plastics and Composites 2000: 19(13):1056-1077<br />
[4] Hadzic, R.; John, S.; Herszberg, I. Structural integrity analysis <strong>of</strong> embedded optical fibres in <strong>composite</strong> structures. Composite Structures<br />
1999: 47( 1): 759-765<br />
[5] Hadzic, R.; John, S.; Herszberg, I. Structural integrity analysis <strong>of</strong> embedded optical fibres in <strong>composite</strong> structures. Composite Structures<br />
1999: 47( 1): 759-765<br />
[6] C.S. Shin and C.C. Chiang, ”<strong>Fatigue</strong> Damage Monitoring in Polymeric Composites using multiple Fibre Bragg Gratings,” International<br />
Journal <strong>of</strong> <strong>Fatigue</strong>.Vol.28, No.10, pp.1315-1321, (2006)<br />
[7] B. L. Chen, C. S. Shin, 2010, “Fiber Bragg Gratings Array for Structural Health Monitoring”, Special issue on Sensors, Actuators and<br />
Intelligent Processing, Materials and Manufacturing Process, 25:1-4, DOI:10.1080/10426910903426414. (2010)<br />
[8] C. S. Shin, B. L. Chen, J. R. Cheng and S. K. Liaw, 2010, “Impact response <strong>of</strong> a wind turbine blade measured by distributed FBG sensors”,<br />
Special issue on Sensors, Actuators and Intelligent Processing, Materials and Manufacturing Process, 25:1-4,<br />
DOI:10.1080/10426910903426448. (2010)<br />
[9] Chambers A.R., “Evaluating impact damage in CFRP using fibre optic sensors,” Composites Science and Technology 67, pp. 1235-1242,<br />
(2007)<br />
[10] Takeda S., “Delamination monitoring <strong>of</strong> laminated <strong>composite</strong>s subjected to low-velocity impact using small-diameter FBG sensors,”<br />
Composites, Part A 36, pp. 903-908, (2005)
Delamination detection in CFRP laminates using A0 and S0<br />
Lamb wave modes<br />
N Hu a, *, Y L Liu a , H Fukunaga b,† , Y Li a<br />
a Department <strong>of</strong> Mechanical Engineering, Chiba University, Chiba 263-8522, Japan<br />
b Department <strong>of</strong> Aerospace Engineering, Tohoku University, Sendai 980-8579, Japan<br />
Keywords: Lamb wave; CFRP laminates; delamination; damage detection<br />
1. Introduction<br />
The structural monitoring techniques based on Lamb waves have been explored by many researchers<br />
in recent years, and the S0 and A0 Lamb wave modes have been widely employed for CFRP laminates<br />
with various damages, such as delamination [1,2] . However, there has been no comprehensive study on<br />
the different capabilities and features <strong>of</strong> the techniques based on these two modes for delamination<br />
detection. Moreover, when using the reflection from the delamination to detect it, it is unclear what kind<br />
<strong>of</strong> Lamb wave parameters, such as excitation frequency, is best for generating the strongest reflection<br />
from the delamination. The present work will focus on the above two key issues. From the present<br />
results, it can be found that the S0 Lamb mode is suitable for long-distance delamination detection due<br />
to its very small attenuation. However, it is difficult to detect small delamination. Furthermore, for the<br />
delamination located on or close to the mid-plane <strong>of</strong> laminates along the through-thickness direction,<br />
the S0 Lamb mode is not efficient. On the other hand, the A0 Lamb mode is suitable for various cases,<br />
no matter where the delamination is located or no matter what kind <strong>of</strong> stacking sequence <strong>of</strong> CFRP is<br />
used. Furthermore, the A0 Lamb mode is more efficient for detecting very short delamination, compared<br />
with that detecting long delamination. However, due to its high attenuation, its detection range is quite<br />
limited. Through extensive explorations, finally, it is found that the optimal excitation frequencies <strong>of</strong><br />
actuator for obtaining strong reflections from delamination are close to the natural frequencies <strong>of</strong> the<br />
local delaminated portion, which implies that the strong reflections from delamination is caused by the<br />
resonance phenomenon <strong>of</strong> the local delaminated portion.<br />
2. Delamination detection using S0 Lamb wave mode<br />
First, the capability and characteristics <strong>of</strong> delamination monitoring technique based on the S0 Lamb<br />
wave mode is investigated. As shown in Fig 1, two CFRP laminated <strong>composite</strong> beams <strong>of</strong> stack<br />
sequences <strong>of</strong> [010/906/906/010] and [012/04/04/012] are used. The length, width and thickness <strong>of</strong> beam are<br />
1005mm, 10mm and 4.8mm, respectively. An artificial delamination is made at the interface between<br />
* E-mail address: huning@faculty.chiba-u.jp. Tel.: 81-43-2903204.<br />
† E-mail address: fukunaga@ssl.mech.tohoku.ac.jp. Tel.: 81-22-7956997.
274<br />
Fifth International Conference on <strong>Fatigue</strong> <strong>of</strong> Composites<br />
two plies by inserting a Teflon sheet <strong>of</strong> thickness <strong>of</strong> 25m. Four delamination cases are considered,<br />
which are [010//906/906/010], [010/906//906/010], [012//04/04/012] and [012/04//04/012], where the symbol “//”<br />
denotes the position <strong>of</strong> delamination along the through-thickness direction. The distance from the right<br />
end <strong>of</strong> the delamination to the right end <strong>of</strong> beam is 200 mm. In our experiments, three kinds <strong>of</strong><br />
delamination lengths are employed, i.e., 30 mm, 20 mm and 10 mm, respectively. A circular PZT<br />
actuator (Fujiceramics, C6) is attached on the top surface <strong>of</strong> the left end <strong>of</strong> beam using a kind <strong>of</strong> very<br />
strong adhesive. In this case, the generated waves from the actuator merge into the reflected waves from<br />
the left end <strong>of</strong> beam directly, and the complex reflection pattern from both ends <strong>of</strong> the beam can be<br />
avoided. A same PZT sensor is attached on the top surface <strong>of</strong> the beam between the delamination and<br />
the actuator to pick up the reflected wave from the delamination. The diameter <strong>of</strong> PZT sensor and<br />
actuator is 10 mm and the thickness is 0.5 mm. Its material properties are: E11=62 GPa, E33=49 GPa,<br />
d33=472 pC/N, and d31=-210 pC/N. A PCI board <strong>of</strong> wave signal generation (National Instruments, NI<br />
PCI-5411) is used to generate the wave signal, which is amplified by an amplifier<br />
z<br />
Fig. 1. Schematic view <strong>of</strong> delaminated beam ([010//906/906/010]) with actuator and sensor (S0 mode).<br />
Table 1. Material properties <strong>of</strong> CFRP beams<br />
E [GPa] G [GPa] [kg/m 3 ]<br />
E11=115<br />
E22=E33=9<br />
G12=G23=G13=3<br />
12=13=0.3<br />
23=0.45<br />
(Krohn-Hite, Model-7500). After the signal is received by the sensor, it is amplified by a charge<br />
amplifier (FEMTO, DLPCA-200), and then sent into an oscilloscope (Tektronix, TDS3034B) for<br />
analysis. Finally, the obtained data from the oscilloscope are processed in a computer. By employing<br />
Hanning window, a signal <strong>of</strong> 5 cycles and 100 kHz is generated by applying 50 V voltage on the<br />
actuator as follows,<br />
Actuator アクチュエータ(PZT) (PZT) Sensor センサ(P (PZT) ZT) Delamination 擬似はく離(10/11層目)<br />
between<br />
10 th and 11 th plies<br />
x<br />
1005m m mmm<br />
455<br />
320<br />
1600<br />
0.5[1<br />
-cos(2 ft / N)]sin(2 ft), t N / f<br />
Pt () = <br />
<br />
0, t N / f<br />
4.8<br />
z<br />
where f is the central frequency in Hz and N is the number <strong>of</strong> sinusoidal cycles within a pulse.<br />
Here, the propagation speed <strong>of</strong> S0 Lamb mode is much higher than that <strong>of</strong> A0 Lamb mode, e.g.,<br />
around 4 times higher in our case. For instance, in our experimental results, before the arrival <strong>of</strong><br />
incident A0 Lamb mode at the sensor from the left to the right, the reflected S0 modes from the<br />
delamination and the right end <strong>of</strong> beam, which travel from the right to the left, already arrive at the<br />
30<br />
200<br />
10<br />
y<br />
(1)
N Hu, Y L Liu, H Fukunaga, Y Li. / Delamination detection in CFRP laminates using A0 and S0 Lamb wave modes<br />
sensor in advance. Therefore, in our sampling time domain for obtaining sensor signals, there is<br />
completely no A0 Lamb mode, and then it is easy to explain S0 modes only. Moreover, in this work, a<br />
large amount <strong>of</strong> the finite element method (FEM) simulations using a three-dimensional hybrid brick<br />
element proposed by the authors [3] combined with the explicit time integration algorithm have also<br />
been performed. The efforts for increasing the computational speed in our FEM code have been done. In<br />
computations, within one wavelength, at least ten elements are used. The material properties <strong>of</strong> PZT<br />
stated previously and material properties <strong>of</strong> CFRP in Table 1 are used. PZT actuator and sensor are<br />
modeled by a square shape <strong>of</strong> the edge length <strong>of</strong> 10 mm. In the delamination region, double nodes are<br />
set up at the top and bottom surfaces <strong>of</strong> delamination without consideration <strong>of</strong> contact effect at the<br />
interface for simplicity. To reduce the influence <strong>of</strong> sensor thickness on the wave propagation, which<br />
leads to the noise in the obtained computational wave signals, the small sensor thickness <strong>of</strong> 0.05 mm is<br />
continuously used in the following computations.<br />
For the case <strong>of</strong> [010//906/906/010], the comparisons <strong>of</strong> sensor signals obtained numerically and<br />
experimentally are shown in Fig 2. Both results are normalized by using the peak value <strong>of</strong> the incident<br />
wave. From Fig 2(a), it can be found that there is an obvious reflection from the delamination <strong>of</strong> 30 mm.<br />
The computational result agrees with the experimental one very well. For the case <strong>of</strong> 20 mm<br />
delamination, from Fig 2(b), the same reflection from the delamination can be identified. However,<br />
from the 10 mm delamination, in Fig 2(c), no clear reflection from the delamination in both results<br />
exists. Therefore, it means that for the cases <strong>of</strong> small delamination, the capability <strong>of</strong> S0 mode is<br />
questionable. It should be noted that there is completely no A0 mode in Fig 2 since it propagates too<br />
slowly and its incident wave from the actuator does not arrive at the sensor within 300 s as shown in<br />
Fig 2. Moreover, It is interesting to note that for other delamination cases defined previously, such as<br />
[010/906//906/010], [012//04/04/012] and [012/04//04/012], there is no obvious reflection from the<br />
delamination <strong>of</strong> various lengths. For the cases where the delamination is located on the mid-plane <strong>of</strong><br />
laminates, the reason <strong>of</strong> detection incapability <strong>of</strong> S0 mode may be from the symmetric deformation<br />
mode <strong>of</strong> S0 mode along the through-thickness direction. For the case <strong>of</strong> [012//04/04/012], the delamination<br />
is still located near to the mid-plane <strong>of</strong> the laminates. The results <strong>of</strong> [012//04/04/012] <strong>of</strong> 30 mm<br />
delamination are shown in Fig 2(d) for reference. These results imply that the S0 mode cannot be used to<br />
detect the delamination which is located on or near the mid-plane <strong>of</strong> laminates.<br />
For the case <strong>of</strong> [010//906/906/010] <strong>of</strong> 20 mm and 30 mm lengths, to identify the delamination location,<br />
the wave propagation speed <strong>of</strong> S0 mode is needed in advance. As shown in Fig 3, an intact CFRP<br />
cross-ply laminated beam <strong>of</strong> [010/906/906/010] is used in experiment and FEM numerical computation.<br />
Two sensors are used to get the wave incident signals. The wave speed can be estimated from the<br />
distance (420 mm) and the arrival time difference <strong>of</strong> two sensors. The arrival times <strong>of</strong> incident wave on<br />
two sensors are collected by using the time point corresponding to the peak amplitude <strong>of</strong> incident<br />
waveform in the time domain directly. Although recently it is quite popular to use the wavelet<br />
transformation to identify the arrival time [4] , we have found that it is sufficiently accurate to simply and<br />
directly employ the information <strong>of</strong> wave signal in the time domain. At 100 kHz, the experimentally<br />
obtained wave speed <strong>of</strong> S0 mode is 6210 m/s and the numerically obtained one is 6260 m/s. Furthermore,<br />
275
276<br />
Fifth International Conference on <strong>Fatigue</strong> <strong>of</strong> Composites<br />
based on the transfer matrix method [5] and material properties in Table 1 for cross-ply laminated beams,<br />
the theoretically obtained wave propagation speed <strong>of</strong> S0 Lamb mode in this beam at 100 kHz is 6467<br />
m/s, which is also close to our experimental result. The corresponding theoretical propagation speed <strong>of</strong><br />
A0 Lamb mode is 1506 m/s. Therefore, the wave propagation speed <strong>of</strong> S0 mode is around 4 times higher<br />
than that <strong>of</strong> A0 mode.<br />
Fig. 2. Waveforms for various delamination cases (S0 mode).<br />
Finally, by using the time difference between the arrival times <strong>of</strong> incident wave and reflected wave<br />
from the delamination, the position <strong>of</strong> delamination can be obtained easily with the help <strong>of</strong> the wave<br />
propagation speed. The identified delamination positions using both experimental and numerical<br />
techniques, which are marked by the symbol <strong>of</strong> “▼”, are shown in Fig 4. From this figure, we can find<br />
that the delamination position can be identified accurately, especially for the case <strong>of</strong> 30 mm<br />
delamination. For the case <strong>of</strong> 20 mm delamination, the error <strong>of</strong> identified positions is comparatively<br />
higher. As shown in Fig 2(b), the reason for this error is that the reflected signal from the delamination<br />
is partially overlapped with the reflection from the right end <strong>of</strong> beam, which causes the inaccuracy in<br />
the identification <strong>of</strong> arrival time <strong>of</strong> reflected wave from the delamination. Moreover, from the numerical<br />
simulations for the cases <strong>of</strong> very long delamination, we can clearly observe that the reflections occur at<br />
the two ends <strong>of</strong> delamination. We have found that the reflected S0 Lamb mode with a strong intensity,
N Hu, Y L Liu, H Fukunaga, Y Li. / Delamination detection in CFRP laminates using A0 and S0 Lamb wave modes<br />
which can be practically measured by the sensor with sufficient accuracy, actually starts from the right<br />
end <strong>of</strong> the delamination, but not from the left end <strong>of</strong> delamination. Therefore, in Fig 4, all identified<br />
delamination positions are located at the right region <strong>of</strong> the delamination.<br />
z<br />
アクチュエータ(PZT)<br />
Actuator (PZT)<br />
x<br />
z<br />
x<br />
センサ1(PZT) Sensor 1<br />
(PZT)<br />
205 420<br />
Fig. 3. An intact laminated beam ([010//906/906/010]) for measuring wave speed.<br />
(a) 剥離30mm 30 mm delamination<br />
(b) 剥離20mm 20 mm delamination<br />
Fig. 4. Identified delamination position ([010//906/906/010]).<br />
3. Delamination detection using A0 Lamb wave mode<br />
Sensor センサ2(PZT) 2<br />
(PZT)<br />
1005mm 10<br />
Num 解析 実験 Exp.<br />
.<br />
4.8<br />
z<br />
y<br />
アクチュエータ(PZT) Actuator (PZT) センサ(PZT) Sensor (PZT) Delamination<br />
擬似剥離<br />
1005mm 10<br />
455 350 200<br />
In this section, we will investigate the characteristics <strong>of</strong> delamination monitoring technique based on<br />
the A0 Lamb wave mode. The various delamination cases stated previously are used. From our<br />
experimental results, it is verified that the A0 mode cannot propagate a long distance due to its higher<br />
attenuation. As shown in Fig 5, two actuators are located near the delamination. For the A0 mode, two<br />
actuators are attached on the top and bottom surfaces <strong>of</strong> the beam with applied out-<strong>of</strong>-phase voltages, as<br />
shown in Fig 5. Although this arrangement can generate relatively pure A0 mode, there are still<br />
reflections in S0 mode due to the mode change caused by the scattering between the Lamb waves and<br />
1mm<br />
7mm<br />
32mm<br />
51mm<br />
拡大 Enlarged<br />
Num 解析 実験 Exp.<br />
.<br />
4.8<br />
z<br />
y<br />
277
278<br />
Fifth International Conference on <strong>Fatigue</strong> <strong>of</strong> Composites<br />
the delamination. To pick up the pure A0 mode, two PZT sensors are attached (Fig 5). The difference <strong>of</strong><br />
signals between the two sensors can produce the pure A0 mode. Naturally, the summation <strong>of</strong> two signals<br />
can yield the pure S0 mode. The same signal as shown in equation 1 is used for the A0 mode, and the<br />
frequency <strong>of</strong> the signal, i.e., f, is 50 kHz. Other conditions are identical to those in the S0 mode.<br />
Furthermore, to confirm our experimental results, the same FEM simulations for the A0 mode are also<br />
performed.<br />
Actuator (PZT) Sensor (PZT) Delamination<br />
-<br />
+<br />
(PZT)<br />
Fig. 5. Schematic view <strong>of</strong> delaminated beam with actuators and sensors (A0 mode).<br />
Fig. 6. Waveforms for various delamination cases (A0 mode).
N Hu, Y L Liu, H Fukunaga, Y Li. / Delamination detection in CFRP laminates using A0 and S0 Lamb wave modes<br />
アクチュエータ(PZT)<br />
Actuator (PZT)<br />
z<br />
x<br />
Fig. 7. Waveforms for various delamination cases (A0 mode).<br />
Sensor センサ1(PZT) 1 (PZT)<br />
センサ2(PZT) Sensor 2 (PZT)<br />
50 400<br />
Fig. 8. An intact laminated beam for measuring wave speed (A0 mode).<br />
First, to explore the capability <strong>of</strong> A0 mode for the cases where S0 mode fails, we have checked the<br />
case <strong>of</strong> [010/906//906/010] where the delamination is located on the mid-plane <strong>of</strong> laminates with three<br />
different lengths. As shown in Figs 6(a), 6(b) and 6(c), the clear reflection from the delamination can be<br />
identified for various delamination lengths when using A0 mode. Note that the results shown in these<br />
figures are the difference between the upper and lower sensors. It is also interesting to note that the<br />
reflection from the 10 mm delamination is the strongest one compared with those <strong>of</strong> 20 mm and 30 mm<br />
delamination cases, which may be caused by the overlapping <strong>of</strong> two reflections from the right and left<br />
ends <strong>of</strong> the delamination, when the delamination is short. Moreover, the A0 mode can be used for the<br />
delamination case <strong>of</strong> [010//906/906/010] where the S0 mode is capable for the 20 mm and 30 mm<br />
delamination. However, the A0 mode is more sensitive to the case <strong>of</strong> small delamination, e.g., 10 mm<br />
delamination where the S0 mode fails. For the stack sequence <strong>of</strong> [010/906/906/010], the influence <strong>of</strong> the<br />
delamination position along the through-thickness direction is small. For instance, the comparison <strong>of</strong><br />
two waveforms <strong>of</strong> 10 mm delamination for the cases <strong>of</strong> [010//906/906/010] and [010/906//906/010] is shown<br />
in Fig 6(d). From this figure, we can find that there is no significant difference in the amplitudes <strong>of</strong><br />
reflections from the delamination in the two waveforms.<br />
1005mm 10<br />
4.8<br />
z<br />
y<br />
For the cases <strong>of</strong> [012//04/04/012] and [012/04//04/012], the A0 mode is also very efficient. As shown in<br />
Figs 7(a) and 7(b), for 10 mm delamination and 20 mm delamination, we can clearly identify the<br />
reflections from the delamination in experimental results. Moreover, for short delamination, e.g., 10 mm<br />
delamination, similar to the results in Fig 6, the A0 mode is more efficient. Furthermore, from Figs 7(a)<br />
and 7(b), we can find that the influence <strong>of</strong> the delamination position along the through-thickness<br />
279
280<br />
Fifth International Conference on <strong>Fatigue</strong> <strong>of</strong> Composites<br />
direction is insignificant. Again, the reflection from 10 mm delamination is stronger than that <strong>of</strong> 20 mm<br />
delamination.<br />
A 30 mm delamination<br />
A 20 mm delamination<br />
A 10 mm delamination<br />
A 30 mm delamination<br />
A 20 mm delamination<br />
A 10 mm delamination<br />
Exp. Num.<br />
Num.<br />
Num. Exp.<br />
Num./Exp.<br />
Num.<br />
Fig. 9. Identified delamination position (A0 mode).<br />
To obtain the wave speed for the identification <strong>of</strong> delamination location, as shown in Fig 8, two intact<br />
CFRP laminated beams for the stack sequences <strong>of</strong> [010/906/906/010] and [012/04/04/012] are used in<br />
experiment and FEM numerical computation. Two sensor sets are used to receive the wave incident<br />
signals. The wave speed can be estimated from the distance (400 mm) and the arrival time difference <strong>of</strong><br />
two sensor sets. At 50 kHz, for the A0 mode, experimental and numerical wave speeds for<br />
[010/906/906/010] are 1555 m/s and 1401 m/s, respectively. For [012/04/04/012], experimental and<br />
numerical wave speeds are 1723 m/s and 1406 m/s, respectively. It can be found that the difference <strong>of</strong><br />
experimental wave speed and numerical one is higher in the case <strong>of</strong> [012/04/04/012]. This phenomenon<br />
may be caused by the comparatively lower material properties <strong>of</strong> CFRP in Table 1, which are used in<br />
Exp.<br />
Num. Exp.<br />
[010/906//906/010]<br />
[012/04//04/012]
N Hu, Y L Liu, H Fukunaga, Y Li. / Delamination detection in CFRP laminates using A0 and S0 Lamb wave modes<br />
FEM simulations. Especially, G23 and G13 may be lower than the practical ones. Finally, for various<br />
delamination cases, the delamination locations are identified experimentally and numerically. For<br />
[010/906//906/010] and [012/04//04/012], the identified delamination locations are shown in Figs 9(a) and<br />
9(b) as examples.<br />
4. Optimal excitation frequency <strong>of</strong> Lamb wave for delamination detection<br />
To improve the reliability <strong>of</strong> the damage detection techniques based on Lamb waves for CFRP<br />
<strong>composite</strong> laminates, we aims at excited wave signal features for obtaining the strongest reflected wave<br />
(or the weakest transmitted wave) from delamination in CFRP laminates. Especially, we focus on the<br />
effect <strong>of</strong> excitation frequency in Lamb wave signals. We only investigate the A0 mode here, however, as<br />
revealed later, the conclusion obtained in this research is a general one, which is also applicable to the<br />
case <strong>of</strong> S0 mode.<br />
Fig. 10. Computational model delamination detection using A0 mode.<br />
First, A0 mode propagation in CFRP delaminated beams, which is excited by two piezoelectric PZT<br />
actuators with out-<strong>of</strong>-phase applied voltages, is numerically simulated. The numerical method, based on<br />
a Chebyshev pseudospectral Mindlin plate element [6] proposed by present authors, is employed. The<br />
effectiveness <strong>of</strong> the numerical method for simulating the Lamb wave propagation in delaminated CFRP<br />
beams is verified by comparing the numerical results with experimental ones for the cases <strong>of</strong><br />
[010/906//906/010] and [010//906/906/010] in advance. It is found that the present numerical method can<br />
yield highly accurate results with very low computational cost, generally from ten times to twenty times<br />
lower than those <strong>of</strong> some conventional FEM.<br />
Then, as shown in Fig 10, we investigate the excitation frequency <strong>of</strong> PZT which can lead to the<br />
strong reflection from the delamination for both cases <strong>of</strong> [010/906//906/010] and [010//906/906/010]. The<br />
reflection intensity is defined in Fig 11, i.e., H1/H0, which is the ratio between the amplitude <strong>of</strong> the<br />
reflected wave and that <strong>of</strong> the incident wave.<br />
For 30 mm delamination <strong>of</strong> [010/906//906/010], the normalized wave signals at the excitation<br />
frequencies <strong>of</strong> 4 different frequencies are shown in Fig 11. From this figure, it can be found that there is<br />
a very strong reflected wave from the delamination at the excitation frequency <strong>of</strong> 42 kHz, whereas the<br />
reflected wave from the delamination is the weakest one at 80 kHz, which implies that a higher<br />
excitation frequency <strong>of</strong> shorter wavelength may not be more powerful for detecting a delamination<br />
regardless <strong>of</strong> signal-to-noise ratio problem. Furthermore, the result also suggests that the common sense<br />
281
282<br />
Fifth International Conference on <strong>Fatigue</strong> <strong>of</strong> Composites<br />
that the waves <strong>of</strong> smaller wavelength are more sensitive to defects, may not be absolutely correct, at<br />
least in our defined frequency range.<br />
Fig. 11. Waveforms <strong>of</strong> various excitation frequencies ([010/906//906/010]).<br />
For 30 mm delamination <strong>of</strong> [010//906/906/010], the normalized original wave signals <strong>of</strong> the beam at the<br />
excitation frequencies <strong>of</strong> 45 kHz and 80 kHz are shown in Fig 12(a). It can be found that the signals are<br />
seemingly irregular since there is S0 mode generated due to mode change caused by interaction <strong>of</strong> the<br />
delamination and A0 mode when the delamination is not located on the mid-plane <strong>of</strong> beams. By<br />
calculating the difference between the signal <strong>of</strong> top sensor and that <strong>of</strong> bottom sensor, the pure A 0 mode<br />
can be collected. Figure 12(b) presents the wave signals <strong>of</strong> pure A0 mode at the excitation frequencies <strong>of</strong><br />
45 kHz and 80 kHz. This figure demonstrates the same phenomenon as that in Fig 11, i.e., a higher<br />
excitation frequency generates a weaker reflection wave from the delamination.<br />
Finally, for various lengths <strong>of</strong> two cases <strong>of</strong> delamination, we investigate the reflection intensity<br />
H1/H0 corresponding to a wide frequency range, i.e., 15 kHz ~ 120 kHz. The results <strong>of</strong> [010//906/906/010]<br />
are plotted in Fig 13. From this figure, it is interesting to note that there are multiple peaks<br />
corresponding to the strong reflection. It means that there are multiple optimal excitation frequencies<br />
which can be used practically. High excitation frequency with smaller wavelength does not certainly<br />
lead to the strong reflection.<br />
To further explore the relationship between the delamination length and the excitation frequency,<br />
we pick up the multiple peaks corresponding to the optimal excitation frequencies in Fig 13 for the<br />
cases [010/906//906/010] and [010//906/906/010]. These results are plotted in Fig 14. From this figure, we<br />
can find that the optimal excitation frequencies <strong>of</strong> various orders decrease as the delamination length<br />
increases.<br />
To uncover the physical meaning <strong>of</strong> the above optimal excitation frequencies, we investigate the<br />
natural frequencies <strong>of</strong> the local delaminated regions in Fig 15 in detail. The models which only contain<br />
the upper or lower delaminated layers in beams as shown in Fig 16 are built up. In Fig. 16(a),<br />
for the case <strong>of</strong> [010/906//906/010], we only set up a half model along the through-thickness direction with
N Hu, Y L Liu, H Fukunaga, Y Li. / Delamination detection in CFRP laminates using A0 and S0 Lamb wave modes<br />
the lower delaminated layer since the delamination is located on the mid-plane <strong>of</strong> the beams. In Fig<br />
16(b), for the case [010//906/906/010], since the delamination is not located on the symmetrical plane, two<br />
models are built up. One is based on the upper delaminated layer, i.e., [010], and the other is based on the<br />
lower delaminated layer, i.e., [906/906/010]. In this vibration analysis, however, it is extremely difficult<br />
to model the true boundary conditions for the local delaminated region selected out. Only one point we<br />
can make sure is that the stiffness parameters <strong>of</strong> connection between the intact portion and the<br />
delaminated portions should be located between those provided by the fixed boundary condition and<br />
those provided by the pinned boundary condition. Therefore, the two common boundary conditions<br />
were used to estimate upper and lower limits <strong>of</strong> the natural frequencies <strong>of</strong> the local delaminated regions<br />
as shown in Fig. 16.<br />
Fig. 12. Waveform <strong>of</strong> various excitation frequencies ([010//906/906/010]).<br />
(a) delamination length: 10~20 mm<br />
283
284<br />
Fifth International Conference on <strong>Fatigue</strong> <strong>of</strong> Composites<br />
(b) delamination length: 20~30 mm<br />
Fig. 13. Reflection intensity corresponding to various excitation frequencies ([010//906/906/010]).<br />
Optimal frequency [kHz]<br />
Optimal frequency [kHz]<br />
120<br />
110<br />
100<br />
90<br />
80<br />
70<br />
60<br />
50<br />
40<br />
30<br />
20<br />
10<br />
60<br />
50<br />
40<br />
30<br />
20<br />
first peak<br />
second peak<br />
third peak<br />
fourth peak<br />
10 12 14 16 18 20 22 24 26 28 30 32<br />
Delamination length [mm]<br />
(a) [010/906//906/010]<br />
100 first peak<br />
second peak<br />
90<br />
third peak<br />
fourth peak<br />
80<br />
fifth peak<br />
sixth peak<br />
70<br />
10<br />
8 10 12 14 16 18 20 22 24 26 28 30 32<br />
Delamination Length [mm]<br />
(b) [010//906/906/010]<br />
Fig. 14. Optimal excitation frequency versus delamination length.
N Hu, Y L Liu, H Fukunaga, Y Li. / Delamination detection in CFRP laminates using A0 and S0 Lamb wave modes<br />
delamination delamination<br />
(a) [010/906//906/010] (b) [010//906/906/010]<br />
(a) 90/90 (b) 0/90<br />
Fig. 15. local delamination portion.<br />
fixed pinned<br />
upper part [0]<br />
lower part [90/90/0]<br />
(a) [010/906//906/010] (two boundary conditions)<br />
(b) [010//906/906/010] (two boundary conditions)<br />
Fig. 16. Model for natural vibration analysis.<br />
By using the delaminated models described above, we calculated their natural frequencies using an<br />
8-noded Mindlin plate element in ABAQUS. Surprisingly, it is found that the optimal excitation<br />
frequencies are located between the natural frequencies <strong>of</strong> models with the fixed boundary condition<br />
and ones <strong>of</strong> models with the pinned boundary condition. Taking 20 mm delamination ([010/906//906/010])<br />
as an example, we discuss the relationship between the optimal excitation frequency and the natural<br />
frequency <strong>of</strong> the local delaminated regions in detail. In this case, there are three optimal excitation<br />
frequencies (17 kHz, 44 kHz and 105 kHz) in our investigated frequency range. Figure 17(a) shows that<br />
the smallest optimal excitation frequency is located between the first natural frequency <strong>of</strong> model<br />
([010/906//906/010]) with fixed boundary and that with pinned boundary; the second optimal one is<br />
located between the second natural frequencies <strong>of</strong> two boundary conditions; and the third optimal one is<br />
close to the seventh natural frequencies <strong>of</strong> two boundary conditions. The vibration modes corresponding<br />
to the first, second and seventh natural frequencies are all pure flexural, which are presented in Fig 17.<br />
Moreover, it is interesting to note that the vibration modes <strong>of</strong> the third, fourth, fifth and sixth natural<br />
frequencies are not pure flexural, which include some other displacement components, such as the<br />
unsymmetric bending mode along the width direction <strong>of</strong> the plate. Therefore, our research results show<br />
that the optimal excitation frequencies have inherent relationships with some natural frequencies <strong>of</strong> the<br />
285
286<br />
Fifth International Conference on <strong>Fatigue</strong> <strong>of</strong> Composites<br />
local delaminated regions. Furthermore, those natural frequencies possess pure flexural vibration modes<br />
(A0 deformation mode). Therefore, when an excitation frequency <strong>of</strong> Lamb waves is close to these<br />
natural frequencies, resonance occurs which leads to a much higher reflection from the delamination. In<br />
this case, the excitation frequency becomes an optimal excitation frequency. Since there are many<br />
natural frequencies <strong>of</strong> the local delaminated region corresponding to pure flexural vibrations, there<br />
should be many optimal excitation frequencies correspondingly. The above finding is obviously<br />
inconsistent with the widely acknowledged common sense that the sensitivity <strong>of</strong> Lamb waves to<br />
damages increases as the frequency increases or the wavelength decreases, at least within the frequency<br />
range investigated here. This conclusion is also applicable to S0 mode where the resonant frequencies<br />
with the vibration modes corresponding to the deformation pattern <strong>of</strong> S0 mode, i.e., axial deformation,<br />
can be thought <strong>of</strong> as optimal excitation frequencies.<br />
The above finding is very helpful for designing a more appropriate wave signal when using Lamb<br />
waves in damage detections. For instance, a broad-band signal or a special designed signal pattern<br />
which is realized by emitting many individual narrow-band signals continuously one by one with a<br />
small frequency increment, should be used to guarantee the reliability <strong>of</strong> delamination detection.<br />
(a) Optimal excitation frequency<br />
Fig. 17. Optimal excitation frequency versus natural frequency (20 mm delamination [010/906//906/010]).
5. Conclusion<br />
N Hu, Y L Liu, H Fukunaga, Y Li. / Delamination detection in CFRP laminates using A0 and S0 Lamb wave modes<br />
In this report, we explore the characteristics <strong>of</strong> delamination monitoring techniques based S 0 and A0<br />
Lamb wave modes. It is found that the S0 mode can be used for the delamination detection in a wide<br />
region due to its small attenuation. However, it is insensitive to the small delamination or the cases<br />
where the delamination is located on or near the mid-plane <strong>of</strong> laminates. When using A0 Lamb wave<br />
mode, it is very powerful for various delamination cases although it can only detect the delamination<br />
which is near the actuator/sensor sets. Especially, the A0 mode is very suitable for small delamination,<br />
where very strong reflection can occur due to overlapping <strong>of</strong> two reflections from the two ends <strong>of</strong><br />
delamination. Finally, we investigate the relationship between the actuator excitation frequency and<br />
reflection intensity from the delamination. It is found that there are multiple optimal excitation<br />
frequencies which can lead to the strong reflection. These multiple optimal excitation frequencies<br />
correspond to the natural frequencies <strong>of</strong> the local delaminated portion. It means that the strong reflection<br />
from the delamination is caused by the resonance <strong>of</strong> the local delaminated portion. The high excitation<br />
frequency with small wavelength does not certainly result in the strong reflection intensity or high<br />
detection sensitivity.<br />
References<br />
[1] Diamanti K, Soutis C, Hodgkinson J M. Lamb waves for the non-destructive inspection <strong>of</strong> monolithic and sandwich <strong>composite</strong> beams.<br />
Composites: Part-A, 2005, 36: 189-195.<br />
[2] Toyama N., Takatsubo J. Lamb wave method for quick inspection <strong>of</strong> impact-induced delamination in <strong>composite</strong> laminates. Composites<br />
Science & Technology, 2004, 64: 1293-1300.<br />
[3] Cao Y P, Hu N, Lu J, Fukunaga H, Yao Z H. A 3D brick element based on Hu-Washizu variational principle for mesh distorsion.<br />
International Journal <strong>of</strong> Numerical Methods in Engineering, 2002, 53: 2529-2548.<br />
[4] Jeong H, Jang Y S. Wavelet analysis <strong>of</strong> plate wave propagation in <strong>composite</strong> laminates. Composite Structures, 2000, 49: 443-50.<br />
[5] Nayfeh A H, Chimenti D E. Elastic wave propagation in fluid-loaded multi-axial anisotropic media. Journal <strong>of</strong> Acoustics Society <strong>of</strong><br />
America, 1991, 89: 542-549.<br />
[6] Liu Y, Hu N, Yan C, Peng X, Yan B. 2009. Effects <strong>of</strong> integration schemes on accuracy <strong>of</strong> a Mindlin pseudospectral plate element. Finite<br />
Elements in Analysis and Design, 2009, 45: 538-546.<br />
287
Effect <strong>of</strong> Temperature on <strong>Fatigue</strong> behavior in nylon 6-clay<br />
hybrid nano<strong>composite</strong>s<br />
1. Introduction<br />
S J Zhu a, *, M Kichise a , A Usuki b , M Kato b<br />
a Fukuoka Institute <strong>of</strong> Technology, Department <strong>of</strong> Intelligent Mechanical Engineering,<br />
3-30-1 Wajirohigashi, Higashi-ku, Fukuoka, 811-0295, Japan<br />
b Toyota Central R & D Labs, Inc., Nagoya, Japan<br />
The nylon 6-clay hybrid (NCH) nano<strong>composite</strong>s were synthesized in Toyota Central R & D Labs in<br />
1987 [1]. Since the NCH nano<strong>composite</strong>s showed high strength, elastic modulus, heat resistance and<br />
other properties, they have been used for automobiles, electronic industry and food package. It is<br />
expected that the applications <strong>of</strong> the nano<strong>composite</strong>s will be extended to aerospace, energy,<br />
environment and biology industries if their time-dependent performances are evidenced. It was reported<br />
that the tensile strength <strong>of</strong> 5 wt% clay reinforced nylon 6 nano<strong>composite</strong> was higher than that <strong>of</strong> 2 wt%<br />
clay reinforced nylon 6 nano<strong>composite</strong>, but the fatigue life was opposite [2]. This means that cyclic<br />
deformation and fracture <strong>of</strong> NCH nano<strong>composite</strong>s should be investigated to establish evaluation method<br />
for improving the nano<strong>composite</strong> and life prediction method. Moreover, mechanical properties <strong>of</strong><br />
polymer are sensitive to temperature due to low glass transition temperature. In this research, tensile and<br />
fatigue <strong>behaviour</strong> at glass transition temperature was investigated and compared with that at room<br />
temperature.<br />
2. Materials and Experimental Procedures<br />
Three kinds <strong>of</strong> materials were used for monotonic tension and fatigue tests, which were nylon 6, 2<br />
wt% clay reinforced nylon and 5 wt% clay reinforced nylon nano<strong>composite</strong>s. Both the tensile tests and<br />
fatigue tests were conducted at room temperature, 35 o C and 50 o C using a servo-hydraulic testing<br />
machine. The specimens for tests are 80 mm in gage length, 10 mm in width and 4 mm in thickness.<br />
The tensile tests with a displacement control were carried out at three strain rate <strong>of</strong> 10 -2 s -1 . The fatigue<br />
tests with a load control were performed at stress ratio <strong>of</strong> 0.1 and frequency <strong>of</strong> 0.1 Hz in sine wave form.<br />
The fracture surfaces were observed using scanning electronic microscope (SEM).<br />
3. Results and Discussion<br />
It is shown that the 2 wt% clay reinforced nylon and 5 wt% clay reinforced nylon have similar<br />
strengths, which are increased by about 30% compared to those <strong>of</strong> nylon 6 at room temperature, as<br />
shown in Fig. 1. However, the tensile strength <strong>of</strong> 5 wt% clay reinforced nylon is higher than that <strong>of</strong> 2<br />
* E-mail address: zhu@fit.ac.jp
S J Zhu, M Kichise, A Usuki, M Kato. / Effect <strong>of</strong> Temperature on <strong>Fatigue</strong> behavior in nylon 6-clay hybrid nano<strong>composite</strong>s<br />
wt% clay reinforced nylon at both 35 o C and 50 o Strain Rate : 10<br />
C. The early brittle fracture caused the 5 wt% clay<br />
reinforced nylon did not perform its ability in strength at room temperature. The increase in flowing<br />
ability at both 35 o C and 50 o C makes the 5 wt% clay reinforced nylon <strong>composite</strong> realize it<br />
strengthening ability.<br />
Tensile strength (MPa)<br />
-2 -<br />
s<br />
1<br />
110<br />
100<br />
90<br />
80<br />
70<br />
60<br />
50<br />
40<br />
Nylon6<br />
NCH-2<br />
NCH-5<br />
30<br />
15 20 25 30 35 40 45 50 55<br />
Temperature(℃)<br />
Fig. 1. Ultimate tensile strength versus testing temperature at a strain rate <strong>of</strong> 10 -2 s -1 .<br />
Maximum Stress (MPa)<br />
100<br />
90<br />
80<br />
70<br />
60<br />
50<br />
Nylon6 (20℃) Nylon6 (35℃)<br />
NCH-2 (20℃)<br />
NCH-5 (20℃)<br />
A<br />
40<br />
1 10 10 2<br />
10 3<br />
NCH-2 (35℃)<br />
NCH-5 (35℃)<br />
10 4<br />
Number <strong>of</strong> Cycles to Failure<br />
Fig. 2. Maximum stress versus number <strong>of</strong> cycles to failure at room temperature and 35 o C.<br />
The fatigue strength <strong>of</strong> 2 wt% clay reinforced nylon is also increased by about 30% compared to that<br />
<strong>of</strong> nylon 6, but the fatigue strength <strong>of</strong> 5 wt% clay reinforced nylon is slightly increased or similar to that<br />
<strong>of</strong> nylon 6 at room temperature, as shown in Fig. 2. The cyclic creep deformation is noted by examining<br />
using stress-strain hysteresis loops. The small cyclic deformation in 5 wt% clay reinforced nylon<br />
<strong>composite</strong> is attributed to the no increase in fatigue strength. The observation <strong>of</strong> fatigue fracture<br />
surfaces also shows brittle fracture features in 5 wt% <strong>composite</strong>, where crack initiated at small pores<br />
and a mirror zone can be seen. The fatigue fracture surfaces in 2 wt% <strong>composite</strong> show dimples and<br />
flowing morphology, implying a good compatibility <strong>of</strong> strength with ductility.<br />
Although the tensile strength and fatigue strength <strong>of</strong> NCH-2 are the highest at room temperature, the<br />
tensile strength and fatigue strength <strong>of</strong> NCH-5 became the highest at 35 o C. <strong>Fatigue</strong> fracture surfaces<br />
showed different patterns between at room temperature and 35 o C.<br />
A<br />
10 5<br />
289
290<br />
References<br />
Fifth International Conference on <strong>Fatigue</strong> <strong>of</strong> Composites<br />
[1] A. Usuki, Y. Kojima, M. Kawasumi, A. Okada, T. Kurauchi, O. Kamigaito, J. Mater. Res., 8 (1993) 1174.<br />
[2] S. Zhu, M. Okazaki, A. Usuki, M. Kato, J. Soc. Mater. Sci., Japan, 58(12) (2009) 969.
<strong>Fatigue</strong> Behavior <strong>of</strong> Unidirectional Jute Spun Yarn Reinforced<br />
PLA<br />
H Katogi a, *, Y Shimamura b , K Tohgo, T Fujii<br />
a Graduate Student <strong>of</strong> Science and Technology Educational Division, Department <strong>of</strong> Environment and Energy System, Shizuoka University,<br />
3-5-1 Johoku, Naka-ku, Hamamatsu, Shizuoka 432-8561, Japan<br />
b Department <strong>of</strong> Mechanical Engineering, Shizuoka University, 3-5-1 Johoku, Naka-ku, Hamamatsu, Shizuoka 432-8561, Japan<br />
Abstract<br />
Natural fiber reinforced <strong>composite</strong>s, which can be carbon neutral materials, have expected to be alternative materials<br />
<strong>of</strong> glass fiber reinforced plastics. Most <strong>of</strong> them use polylactic acid (PLA) as matrix because PLA is made out <strong>of</strong> plants<br />
and has biodegradability. They are <strong>of</strong>ten called „Green <strong>composite</strong>s‟. Recently, unidirectional reinforcement techniques <strong>of</strong><br />
natural fibers have been developed for improvements <strong>of</strong> modulus and strength. <strong>Fatigue</strong> property <strong>of</strong> the unidirectional<br />
reinforced <strong>composite</strong>s should be investigated to assure the structural integrity. In this study, fatigue property <strong>of</strong><br />
unidirectional jute yarn reinforced PLA was investigated and the fatigue mechanism was discussed. As a result, it was<br />
found that the S-N diagram had a steep slope like GFRP and the fatigue property <strong>of</strong> PLA dominated the fatigue life <strong>of</strong> the<br />
<strong>composite</strong>.<br />
Keywords: Green <strong>composite</strong>, Jute spun yarn, PLA, <strong>Fatigue</strong> property, <strong>Fatigue</strong> mechanism<br />
1. Introduction<br />
Natural fiber reinforced <strong>composite</strong>s, which can be carbon neutral materials, have expected to be<br />
alternative materials <strong>of</strong> glass fiber reinforced plastics (GFRP). Many papers <strong>of</strong> natural fiber reinforced<br />
plastics (NFRP) have been published [1-7]. Most <strong>of</strong> them use polylactic acid (PLA) as matrix because<br />
PLA is made out <strong>of</strong> plants, i.e. renewable resource, and has biodegradability. They are <strong>of</strong>ten called<br />
„Green <strong>composite</strong>s‟. Commercial products using green <strong>composite</strong>s are available in market. Most<br />
products are processed with injection molding <strong>of</strong> short fibers..<br />
Recently, unidirectional reinforcement techniques <strong>of</strong> natural fibers have been developed for<br />
improvements <strong>of</strong> modulus and strength [9, 10]. <strong>Fatigue</strong> property <strong>of</strong> the unidirectional reinforced<br />
<strong>composite</strong>s should be investigated to assure the structural integrity. A few reports on fatigue property <strong>of</strong><br />
natural fiber reinforced petroleum-based thermoset plastics have been reported [11, 12], but the fatigue<br />
behavior natural fiber reinforced biodegradable resin has never been reported.<br />
In this study, fatigue behavior <strong>of</strong> unidirectional jute yarn reinforced PLA was investigated and the<br />
fatigue mechanism was discussed.<br />
* Corresponding author. Tel&Fax: +81-53-478-1029.<br />
E-mail address: hkatogi@mechmat.eng.shizuoka.ac.jp
292<br />
2. Materials, specimen and testing methods<br />
2.1 Materials and Specimen<br />
Fifth International Conference on <strong>Fatigue</strong> <strong>of</strong> Composites<br />
Water-dispersible PLA resin (Miyoshi Oil and Fat Co., Ltd., PL-2000) was used as matrix. Jute spun<br />
yarn (BMS Co., Ltd., Asa no himo) was used as reinforcement.<br />
Alkaline treatment with NaOH5% <strong>of</strong> jute spun yarn for 3 hour at room temperature was conducted to<br />
make performs [13]. The alkaline treated fibers were washed by water, wound around a metallic plate,<br />
and dried in a furnace. Then the water-dispersible PLA resin was impregnated into the preform to make<br />
prepregs. The prepregs were unidirectionally laminated and hot-pressed at 140 o C for 20 min. The<br />
number <strong>of</strong> stacking is three, and five laminates were prepared. The volume fraction was measured using<br />
an optical microscope. The volume fraction <strong>of</strong> laminates was 27%, 28%, 31%, 43% and 44%.<br />
The specimen for quasi-static tensile tests and fatigue tests were shown in Fig.1. The specimen size<br />
was 10.0 mm wide, 140.0 mm long and 3.5 mm thick according to JIS K 7164. Aluminum tabs were<br />
glued. Figure 2 shows the cross section <strong>of</strong> the <strong>composite</strong> plate. It was found that PLA resin was well<br />
impregnated into yarns.<br />
2.2 Tensile Testing<br />
10.0<br />
140.0<br />
40.0 60.0<br />
Aluminium tab<br />
Fig. 1. Specimen.<br />
Fig. 2. Cross section <strong>of</strong> specimen.<br />
t: 2.7<br />
[unit :mm]<br />
Tensile tests are conducted to measure Young‟s modulus and ultimate strength based on JIS K 7164.<br />
Loading direction was the yarn direction. The cross-head speed was 1.0 mm/min. Both strain gauges<br />
and an extensometer were used for measuring strain. Seven specimens were prepared. The volume<br />
fractions <strong>of</strong> specimens were 27% and 44%.
2.3 <strong>Fatigue</strong> Testing<br />
H Katogi, Y Shimamura, K Tohgo, T Fujii. / <strong>Fatigue</strong> Behavior <strong>of</strong> Unidirectional Jute Spun Yarn Reinforced PLA<br />
<strong>Fatigue</strong> tests with sinusoidal wave were conducted using a hydraulic servo testing machine<br />
(Shimadzu Co., EM50kNT). The maximum stressmax was set to be 90% ~ 40% <strong>of</strong> ultimate strengthB<br />
and the stress ratio was set to be 0.1. During fatigue tests, cyclic stress-strain curves were recorded at<br />
10 3 , 10 4 , 10 5 and 10 6 cycles. The volume fractions <strong>of</strong> specimens were 27%, 28% and 31%.<br />
2.4 Residual Tensile Strength<br />
Residual tensile strength was measured after cyclic <strong>loading</strong> with max=0.8B. The conditions <strong>of</strong> cyclic<br />
<strong>loading</strong> were the same as those <strong>of</strong> fatigue testing. The volume fraction <strong>of</strong> specimens was 43%.<br />
2.5 Observation methods<br />
After cyclic <strong>loading</strong>, specimens were observed using an optical microscope and SEM in order to<br />
investigate damage propagation during fatigue testing.<br />
For damage observing during fatigue testing, fatigue tests <strong>of</strong> several specimens were interrupted.<br />
After the specimen surface was observed, matrix was hydrolyzed in water at 90 o C for 72 hr and damage<br />
<strong>of</strong> jute spun yarn was observed.<br />
Macroscopic and microscopic fracture modes <strong>of</strong> quasi-static and fatigue (max=0.8B and 0.5B) test<br />
specimens were also observed.<br />
3. Results and discussion<br />
3.1 Tensile Test<br />
Figure 3 shows a typical stress-strain curve. The stress-strain curve was almost linear. The average<br />
Young‟s modulus was 4.9 GPa ± 1.7 GPa and the average tensile strength was 59.5 MPa ± 3.7 MPa,<br />
where the error band is the standard deviation.<br />
Stress [MPa]<br />
60<br />
50<br />
40<br />
30<br />
20<br />
10<br />
0<br />
0 0.5 1 1.5 2 2.5<br />
Strain [%]<br />
Fig. 3. Stress - strain curve.<br />
293
294<br />
3.2 S-N Diagram<br />
Fifth International Conference on <strong>Fatigue</strong> <strong>of</strong> Composites<br />
Figure 4 shows an S-N diagram. The S-N diagram had a steep slope. <strong>Fatigue</strong> limit was not observed.<br />
<strong>Fatigue</strong> life increased as increasing the volume fraction <strong>of</strong> reinforcement because higher volume<br />
fraction means lower stress in yarn and resin. The fatigue life at 10 6 cycles is around 55% <strong>of</strong> the<br />
ultimate strength; the fatigue property is similar to that <strong>of</strong> GFRP [14].<br />
Residual strength [MPa]<br />
Stress amplitude [MPa]<br />
100<br />
80<br />
60<br />
40<br />
20<br />
30<br />
25<br />
20<br />
15<br />
10<br />
5<br />
Vf=27%<br />
Vf=28%<br />
Vf=31%<br />
10<br />
Number <strong>of</strong> cycles to failure Nf [cycle]<br />
0 101 102 103 104 105 106 107 0<br />
0.8ζB<br />
Fig. 4. S-N diagram.<br />
<strong>Fatigue</strong> life<br />
10<br />
Number <strong>of</strong> cycle [cycle]<br />
0 101 102 103 104 105 0<br />
Fig. 5. Residual tensile strength (ζmax=0.8ζB).
H Katogi, Y Shimamura, K Tohgo, T Fujii. / <strong>Fatigue</strong> Behavior <strong>of</strong> Unidirectional Jute Spun Yarn Reinforced PLA<br />
3.3 Residual Tensile Strength<br />
Residual tensile strength after cyclic <strong>loading</strong> (max=0.8B) is shown in Fig.5. In Fig.5, the vertical<br />
axis is residual tensile strength and the horizontal axis is the number <strong>of</strong> cycles when fatigue tests were<br />
interrupted. For reference, the maximum stress <strong>of</strong> cyclic <strong>loading</strong> and fatigue life with a factor <strong>of</strong> two<br />
scatter band are also shown. The residual tensile strength rapidly decreased just before final failure. This<br />
implies that fiber breakage <strong>of</strong> reinforced yarn occurs just before final failure.<br />
3.4 Damage Propagation<br />
3.4.1 Macroscopic and microscopic fracture observation<br />
Macroscopic fracture mode and facture surface <strong>of</strong> quasi-static tensile failure and fatigue failure for<br />
high (max=0.8B) and low (max=0.5B) stress amplitudes are shown in Figs.6 and 7. The macroscopic<br />
and microscopic fracture morphologies were similar regardless <strong>of</strong> <strong>loading</strong> condition and stress<br />
amplitude except for long delamination at low stress amplitude.<br />
3.4.2 Damage <strong>of</strong> <strong>composite</strong> during cyclic <strong>loading</strong><br />
Figure 8 shows surface cracks just before fatigue failure (max=0.8B). It was found that many cracks<br />
initiated orthogonal to the <strong>loading</strong> direction in PLA resin during cyclic <strong>loading</strong>. It is noteworthy that<br />
breakage <strong>of</strong> jute filaments in front <strong>of</strong> large cracks in PLA resin was also found.<br />
(a) Quasi-static test.<br />
(b) <strong>Fatigue</strong> test (ζmax=0.8ζB).<br />
295
296<br />
Fifth International Conference on <strong>Fatigue</strong> <strong>of</strong> Composites<br />
(c) <strong>Fatigue</strong> test (ζmax=0.5ζB).<br />
Fig. 6. Macroscopic fracture modes.<br />
(a) Quasi-static test.<br />
(b) <strong>Fatigue</strong> test (ζmax=0.8ζB).<br />
(c) <strong>Fatigue</strong> test (ζmax=0.5ζB).<br />
Fig. 7. SEM images <strong>of</strong> fracture portion <strong>of</strong> jute filament.
H Katogi, Y Shimamura, K Tohgo, T Fujii. / <strong>Fatigue</strong> Behavior <strong>of</strong> Unidirectional Jute Spun Yarn Reinforced PLA<br />
(a) Macroscopic image.<br />
(b) Non-crack surface (A area).<br />
(c) Resin cracks (B area).<br />
(d) Resin cracks and fiber breakage (C area).<br />
Fig. 8. Specimen surface after cyclic <strong>loading</strong> (ζmax=0.8ζB).<br />
3.4.3 Damage <strong>of</strong> jute spun yarn during cyclic <strong>loading</strong><br />
From the results, we supposed that matrix cracking preceded the breakage <strong>of</strong> jute filaments. Thus,<br />
matrix was hydrolyzed for observation <strong>of</strong> damage in jute spun yarn. Figure 9 shows jute spun yarns<br />
297
298<br />
Fifth International Conference on <strong>Fatigue</strong> <strong>of</strong> Composites<br />
extracted from the specimen shown in Fig.8. In Fig.9, areas A, B and C correspond to those in Fig.8.<br />
The results showed that breakage <strong>of</strong> jute filaments occurred only when a matrix crack became larger<br />
enough to break jute filaments.<br />
3.5 <strong>Fatigue</strong> mechanism<br />
(a) Spun yarn <strong>under</strong>neath non-crack surface (A area) and small cracks (B area).<br />
(b) Fiber breakage at a tip <strong>of</strong> a large crack.<br />
Fig. 9. Jute spun yarn extracted from specimen after cyclic <strong>loading</strong> (ζmax=0.8ζB).<br />
The fracture mechanism <strong>of</strong> the unidirectional jute spun yarn reinforced PLA is probably as follows:<br />
fatigue cracks in PLA resin initiate and propagate from specimen surface until the cracks get to jute<br />
spun yarns; stress concentration at the crack tip leads to breakage <strong>of</strong> jute filaments; the accumulation <strong>of</strong><br />
fiber breakage causes the final failure. Nonoyama et al. [15] reported that S-N diagrams <strong>of</strong> PLA with<br />
different crystallinity. The fatigue lives at any strain amplitude are equal or less than those <strong>of</strong> our results.<br />
This supports the proposed fatigue mechanism.
H Katogi, Y Shimamura, K Tohgo, T Fujii. / <strong>Fatigue</strong> Behavior <strong>of</strong> Unidirectional Jute Spun Yarn Reinforced PLA<br />
In the <strong>composite</strong> system we fabricated, the fatigue property <strong>of</strong> PLA probably dominates the fatigue<br />
life <strong>of</strong> the <strong>composite</strong> as a result <strong>of</strong> brittleness <strong>of</strong> PLA. In addition, the results indicated the fatigue<br />
property <strong>of</strong> jute is better than that <strong>of</strong> PLA. Therefore, usage <strong>of</strong> more ductile polymer such as PBS might<br />
enhance the fatigue life though the research work on the fatigue behavior <strong>of</strong> natural fibers is also<br />
needed.<br />
3.6 Cyclic stress-strain curve<br />
Typical cyclic stress-strain curves (max=0.5B) are shown in Fig.10. The cyclic stress-strain curve<br />
was almost linear regardless <strong>of</strong> the maximum stress amplitude. The changes <strong>of</strong> the strain range and<br />
average strain with the number <strong>of</strong> cycles are shown in Fig.11. The strain range, i.e. stiffness, remained<br />
unchanged during cyclic <strong>loading</strong>. On the other hand, the average strain continued to increase. The<br />
results indicate that creep deformation <strong>of</strong> PLA resin occurred during cyclic <strong>loading</strong> and thus caused the<br />
slight change <strong>of</strong> spun structure <strong>of</strong> yarn.<br />
Stress (MPa)<br />
60<br />
50<br />
40<br />
30<br />
20<br />
10<br />
Total strain range [%]<br />
0<br />
1000 cycle<br />
10000cycle<br />
100000cycle<br />
1000000cycle<br />
0 1 2 3<br />
Strain (%)<br />
4 5 6<br />
0.7<br />
0.6<br />
0.5<br />
0.4<br />
0.3<br />
0.2<br />
0.1<br />
Fig. 10. Cyclic stress-strain curves (ζmax=0.5ζB).<br />
10<br />
Number <strong>of</strong> cycle N<br />
3 104 105 106 0<br />
(a) Total strain range Δε<br />
max=60%,Vf=28%<br />
max=50%,Vf=28%<br />
max=40%,Vf=31%<br />
299
300<br />
4. Conclusions<br />
Average strain (%)<br />
Fifth International Conference on <strong>Fatigue</strong> <strong>of</strong> Composites<br />
3<br />
2.5<br />
2<br />
1.5<br />
1<br />
0.5<br />
max=60%, Vf=28%<br />
max=50%, Vf=28%<br />
max=40%, Vf=31%<br />
10<br />
Number <strong>of</strong> cycle N<br />
3 104 105 106 0<br />
(b) Average strain range <br />
Fig. 11. Changes <strong>of</strong> total strain range and average strain.<br />
The fatigue behavior <strong>of</strong> unidirectional jute spun yarn reinforced PLA was investigated. The following<br />
conclusions were obtained.<br />
(1) The S-N diagram had a steep slope like GFRP and fatigue limit was not observed.<br />
(2) <strong>Fatigue</strong> cracks in PLA resin caused the breakage <strong>of</strong> jute filaments, and the accumulation <strong>of</strong> the<br />
fiber breakage led to the final failure.<br />
References<br />
[1] P. Wambua, J. Ivens and I. Verpoest, Natural fibres: can they replace glass in fiber reinforced plastics?, Compos. Sci. Technol., 63 (2003)<br />
1259-1264.<br />
[2] T. Nishino, K. Hirao, M. Kotera, K. Nakamae, H. Inagaki, Kenaf reinforced biodegradable <strong>composite</strong>, Compos. Sci. Technol, 63 (2003)<br />
1281-1286.<br />
[3] Y. Cao, K. Goda and S. Shibata, Development and mechanical properties <strong>of</strong> bagassa fiber reinforced <strong>composite</strong>s, Adv. Compos. Mater., 16,<br />
4 (2007) 283-298.<br />
[4] H. Takagi, S. Kato, K. Kusano and A. Ousaka, Thermal conductivity <strong>of</strong> PLA-bamboo fiber <strong>composite</strong>s, Adv. Compos. Mater., 16, 4 (2007)<br />
377-384.<br />
[5] K. Takemura and Y. Minekage, Effect <strong>of</strong> molding condition on tensile properties <strong>of</strong> hemp fiber reinforced <strong>composite</strong>, Adv. Compos. Mater.,<br />
16, 4 (2007) 2385-394.<br />
[6] K. Okubo, T. Fujii and E. T. Thostenson, Multi-scale hybrid bio<strong>composite</strong>: Processing and mechanical characterization <strong>of</strong> bamboo fiber<br />
reinforced PLA with micr<strong>of</strong>ibrillated cellulose, Compos. A, 40, 4 (2009) 469-475.<br />
[7] N. Graupner, A. S. Herrmann and Jörg Müssig, Natural and man-made cellulose fibre-reinforced poly(lactic acid) PLA <strong>composite</strong>s: An<br />
overview about mechanical characteristics and application areas, Compos. A, 40 (2009) 810-821.<br />
[8] Khondker, U. S. Ishiakua A. Nakai and H. Hamada, A novel processing technique for thermoplastic manufacturing <strong>of</strong> unidirectional<br />
<strong>composite</strong>s reinforced with jute yarns, Compos. A, 37, 12 (2006) 2274-2284.<br />
[9] G. Ben, Y. Kihara, K. Nakamori and Y. Aoki, Examination <strong>of</strong> heat resistant tensile properties and molding conditions <strong>of</strong> green <strong>composite</strong>s<br />
composed <strong>of</strong> kenaf fibers and PLA resin, Adv. Compos. Mater., 16, 4 (2007) 361-376.<br />
[10] N. Towo and M. P. Anell, <strong>Fatigue</strong> sisal fibre reinforced <strong>composite</strong>s: constant-life diagrams and hysteresis loop capture, Compos. Sci.<br />
Technol., 68 (2008) 915-924.<br />
[11] N. Towo and M. P. Anell, <strong>Fatigue</strong> evaluation and dynamic mechanical thermal analysis <strong>of</strong> sisal fibre-thermosetting resin <strong>composite</strong>s,
H Katogi, Y Shimamura, K Tohgo, T Fujii. / <strong>Fatigue</strong> Behavior <strong>of</strong> Unidirectional Jute Spun Yarn Reinforced PLA<br />
Compos. Sci. Technol., 68 (2008) 925-932.<br />
[12] H. Kobayashi, M. Kubouchi, T. Sakai, T. Tumolva and K. Tsuda, Proc.10th Japan International SAMPE Symposium & Exhibition (2007)<br />
(CD-ROM).<br />
[13] P. K. Mallick, Fiber-reinforced <strong>composite</strong>s, Marcel Dekker, (1993) 249-253.<br />
[14] Y. Nonoyama, M. Kawagoe and K. Sanada, Tensile properties and fatigue behavior <strong>of</strong> polylactic acid, Proc. 42th Hokuriku Shin‟etsu<br />
Branch Meeting <strong>of</strong> J. Soc. Mech. Eng., 047-1 (2005) 327-328. (in Japanese)<br />
301
Abstract<br />
An evaluation on thermal shock fatigue damage <strong>of</strong> SiC<br />
<strong>composite</strong> using nondestructive technique<br />
J K Lee a, *, S P Lee b,† , J H Byun c,‡<br />
a Dept. Of Mechanical Engineering, Dongeui University, Busan 614-714, South Korea<br />
b Dept. Of Mechanical Engineering, Dongeui University, Busan 614-714, South Korea<br />
c Composite Materials Group, Korea Institute <strong>of</strong> Materials Science, Chanwon 641-831, South Korea<br />
The fabrication route <strong>of</strong> monolithic SiC materials by the complex compound <strong>of</strong> ultra-fine SiC particles and oxide<br />
additive materials have been investigated. SiC materials were fabricated by a liquid phase sintering process, using a SiC<br />
powder with an average size <strong>of</strong> about 30 nm. The ultrasonic technique, one <strong>of</strong> the nondestructive tests, was used to<br />
evaluate the optimum fabrication conditions <strong>of</strong> SiC materials by using the parameters <strong>of</strong> attenuation coefficient and<br />
velocity. In addition, a thermal shock test was conducted to evaluate the fatigue damage <strong>of</strong> the SiC material <strong>under</strong>went<br />
thermal shock repetitively.<br />
Keywords: monolithic SiC material; attenuation coefficient; nondestructive test; ultrasonic wave; additive material<br />
1. Introduction<br />
Silicon carbide (SiC) is an useful material which be used <strong>under</strong> severe environmental conditions due<br />
to its high temperature resistance, mechanical property and aggressive chemicals.[1-2] However, the<br />
strength and the reliability <strong>of</strong> SiC materials are influenced by many parameters such as crystal structure,<br />
porosity, participation and defects despite <strong>of</strong> these advantages. Especially, the local stress distribution in<br />
the vicinity <strong>of</strong> the crystalline inclusions is affected by mismatches in the elastic properties, the<br />
coefficients <strong>of</strong> thermal expansion, and the values <strong>of</strong> the thermal conductivity <strong>of</strong> the crystalline and glass<br />
phases. Moreover, ceramics have <strong>of</strong>ten been used in the thermal structures such as automobile engines<br />
and turbines which generate thermal stress in material due to the temperature variety. Thermal shock<br />
fracture is a big problem in the practical use <strong>of</strong> ceramics, and it should be resolved for wide application<br />
<strong>of</strong> SiC materials. Lots <strong>of</strong> researchers have been focused on finding out the optimum fabrication route <strong>of</strong><br />
monolithic SiC materials.[3-5] Mechanical properties <strong>of</strong> monolithic SiC materials count on the size <strong>of</strong><br />
SiC particles besides the fabrication process. In present study, the fabrication route <strong>of</strong> monolithic SiC<br />
materials by the complex compound <strong>of</strong> ultra-fine SiC particles and oxide additive materials have been<br />
investigated. SiC materials were fabricated by a liquid phase sintering process, using a commercial SiC<br />
powder with an average size <strong>of</strong> about 30 nm. An Al2O3-Y2O3 powder mixture was used as a sintering<br />
additive. Especially, the effect <strong>of</strong> additive composition ratio on the characterization <strong>of</strong> monolithic SiC<br />
materials has been examined, in conjunction with the properties <strong>of</strong> ultrasonic wave. The ultrasonic<br />
* Corresponding author. E-mail address: leejink@deu.ac.kr. Tel.: 82-51-890-1663.<br />
† E-mail address: splee87@deu.ac.kr. Tel.: 82-51-890-1662.<br />
ffi E-mail address: bjh1673@kims.re.kr. Tel.: 82-55-280-3312.
J K Lee, S P Lee, J H Byun. / An evaluation on thermal shock fatigue damage <strong>of</strong> SiC <strong>composite</strong> using nondestructive technique<br />
technique, one <strong>of</strong> the nondestructive tests, is <strong>of</strong>ten used to evaluate the material property by damage<br />
caused external factors such as load, temperature and pressure. The attenuation and velocity <strong>of</strong><br />
ultrasonic wave through materials are changed by the fabrication process <strong>of</strong> them, and the fabrication<br />
process is directly related with the mechanical properties <strong>of</strong> materials such as strength, density and<br />
Young‟s modulus. Therefore, the optimum fabrication condition for monolithic SiC material by additive<br />
composition ratio was derived by measuring the attenuation and velocity <strong>of</strong> ultrasonic wave. In addition,<br />
a thermal shock test was conducted to evaluate the fatigue damage <strong>of</strong> the SiC material <strong>under</strong>went<br />
thermal shock repetitively.[6] Ultrasonic technique was also used to inspect the degree <strong>of</strong> thermal shock<br />
damage <strong>of</strong> the SiC material nondestructively.<br />
Mixed powder<br />
acetone<br />
zirconia ball Al2O3 zirconia ball Al2O3 zirconia ball Al2O3 Y Y2O 2O 2O 3<br />
SiC<br />
Rotation condition : 160rpm, 12hrs<br />
Hot-pressing<br />
pressure<br />
graphite<br />
mold<br />
High High High temperature<br />
temperature<br />
temperature<br />
argon<br />
atmosphere<br />
Sintering condition<br />
- temp. : 1820℃ - pressure : 20MPa<br />
- time : 1hr<br />
Fig. 1. Schematic diagram <strong>of</strong> fabrication process <strong>of</strong> SiC materials by the liquid phase sintering.<br />
Controller<br />
2. Materials and Experimental procedures<br />
Furnace<br />
Specimen<br />
Cycle<br />
Temp.<br />
Fig. 2. Schematic diagram <strong>of</strong> thermal shock test.<br />
The monolithic SiC materials were fabricated by a liquid phase sintering process, using a commercial<br />
SiC powder with an average size <strong>of</strong> about 30 nm and Al2O3-Y2O3 powder mixture as a sintering<br />
additive. The compositional ratio (Al2O3/Y2O3) varied with 0.4, 0.7, 1.5 and 2.3, respectively in order<br />
303
304<br />
Fifth International Conference on <strong>Fatigue</strong> <strong>of</strong> Composites<br />
to evaluate the effect <strong>of</strong> additive for the monolithic SiC material. The monolithic SiC materials were<br />
sintered at the temperature <strong>of</strong> 1820 ℃. The applied pressure and its holding time were 20 MPa and 2 hr,<br />
respectively. Fig. 1 shows the fabrication process <strong>of</strong> SiC material by the liquid phasing sintering.<br />
However, an ultrasonic technique was used to evaluate the mechanical properties <strong>of</strong> monolithic SiC<br />
materials fabricated by the change <strong>of</strong> additive composition ratio. The ultrasonic test has been conducted<br />
in the water to keep to a minimum the effect <strong>of</strong> couplant, because it exerts an enormous influence on the<br />
attenuation <strong>of</strong> waves. Frequency range <strong>of</strong> the used sensor was 10MHz. The same experimental device<br />
and sensor were used to clarify the degree <strong>of</strong> thermal shock fatigue damage <strong>of</strong> SiC material. In this<br />
study, a thermal shock tester was made for measuring the damage behavior and crack initiation <strong>of</strong> SiC<br />
material subjected to the cyclic thermal shock. Fig. 2 shows the schematic diagram <strong>of</strong> thermal shock test.<br />
The specimen was heated to 573K in the furnace for twenty minutes and then dropped into the water<br />
tank located <strong>under</strong> the furnace for cooling (295K). When the specimen <strong>under</strong>went the repetitive thermal<br />
shock, many cracks were generated on the surface <strong>of</strong> the specimen, although the cracking was not<br />
observable by the naked eye. The microscope and SEM equipments were applied to evaluate the cracks‟<br />
initiation and propagation on the surface <strong>of</strong> the specimen.<br />
3. Results and discussions<br />
Fig. 3 shows the variation <strong>of</strong> the attenuation and velocity <strong>of</strong> ultrasonic wave and flexural strength by<br />
the composition ratio <strong>of</strong> additive materials for the monolithic SiC material. As shown in Fig. 3 the<br />
flexural strength represented the highest at the composition ratio <strong>of</strong> additive materials 1.5 and the lowest<br />
at 2.3. The attenuation coefficients were wide range between 90dB/m and 700dB/m as the composition<br />
ratio <strong>of</strong> the additive materials increases. The attenuation coefficients were within the range from<br />
90dB/m to 300dB/m at the compositional ratio from 0.4 to 1.5. However, it was rapidly increased over<br />
600dB/m at the composition ratio <strong>of</strong> 2.3. Ultrasonic wave is a lot affected by sintering particles <strong>of</strong> SiC,<br />
voids in the specimen because the attenuation occurs due to the scattering and absorption by<br />
propagating <strong>of</strong> wave within materials. Therefore we can estimate the internal condition <strong>of</strong> material by<br />
analyzing the attenuation <strong>of</strong> ultrasonic wave. In case <strong>of</strong> the specimen <strong>of</strong> composition ratio <strong>of</strong> 2.3 the<br />
high attenuation coefficient is why the scattering <strong>of</strong> ultrasonic wave is increased by the particles <strong>of</strong><br />
Y2O3 that don‟t sinter and many voids in the monolithic SiC material. In this work, many Y2O3<br />
particles from the microstructure inspection for the monolithic SiC material <strong>of</strong> additive material 2.3<br />
promoted the scattering <strong>of</strong> wave. However, the velocities were gradually increased with the amount <strong>of</strong><br />
additive composition ratios. The velocities were ranged from 11500m/s to 11700m/s and proved the<br />
fastest velocity at the composition ratio <strong>of</strong> 2.3. From these results it is found the monolithic SiC material<br />
represents the highest flexural strength at the velocity <strong>of</strong> about 11650m/s and at the lowest attenuation<br />
coefficient. As shown in Fig. 3 the flexural strength and optimum fabrication conditions <strong>of</strong> the<br />
monolithic SiC material could be estimated by measuring the velocity and the attenuation in ultrasonic<br />
wave.
J K Lee, S P Lee, J H Byun. / An evaluation on thermal shock fatigue damage <strong>of</strong> SiC <strong>composite</strong> using nondestructive technique<br />
Flexural Strength(MPa) Velocity(m/s)<br />
11800<br />
11750<br />
11700<br />
11650<br />
11600<br />
11550<br />
11500<br />
700<br />
600<br />
500<br />
400<br />
300<br />
200<br />
100<br />
0<br />
Flexural strength<br />
Attenuation coefficient<br />
Velocity<br />
0.0 0.5 1.0 1.5 2.0<br />
0<br />
2.5<br />
Amount <strong>of</strong> addictive(Al 2 O 3 /Y 2 O 3 )<br />
1000<br />
Fig. 3. Flexural strength, velocity and attenuation coefficient vs. amount <strong>of</strong> additive.<br />
Velocity(m/s)<br />
Attenuation Coefficient(dB/m)<br />
150<br />
145<br />
140<br />
135<br />
130<br />
125<br />
120<br />
115<br />
110<br />
12000<br />
11800<br />
11600<br />
11400<br />
11200<br />
11000<br />
Model: ExpDec2<br />
Equation: y = A1*exp(-x/t1) + A2*exp(-x/t2) + y0<br />
Weighting: No weighting<br />
Chi^2/DoF = 92.19536<br />
R^2 = 0.77851 y0 = 3605.06126<br />
A1 = -1746.30419 t1 = 810.11845<br />
A2 = -1746.30592 t2 = 806.42491<br />
800<br />
600<br />
400<br />
200<br />
ExpDec2 fit <strong>of</strong> Data1_A<br />
1 2 3 4 5 6 7<br />
Number <strong>of</strong> Cycle<br />
(a) Attenuation coefficient<br />
Model: ExpGro1<br />
Equation: y = A1*exp(x/t1) + y0<br />
Weighting: No weighting<br />
Chi^2/DoF = 177.23848<br />
R^2 = 0.48368<br />
y0 =-2907345.23786<br />
A1 = 2918989.10344<br />
t1 = 547135.83268<br />
ExpGro1 fit <strong>of</strong> Data1_D<br />
1 2 3 4 5 6 7<br />
Number <strong>of</strong> Cycle<br />
(b) Velocity<br />
Fig. 4. Attenuation coefficient (a), Velocity (b) vs. Number <strong>of</strong> cycles <strong>of</strong> thermal shock.<br />
Attenuation coefficient(dB/m)<br />
305
306<br />
Fifth International Conference on <strong>Fatigue</strong> <strong>of</strong> Composites<br />
SiC materials expect to be used as parts in the severe circumstances <strong>of</strong> low temperature and high<br />
temperature repetitively. Therefore it is essential that the thermal shock damage behavior <strong>of</strong> SiC<br />
materials by a rapid change in temperature should be clarified for high temperature applications. In this<br />
study, an ultrasonic test was used to evaluate the degree <strong>of</strong> thermal shock damage <strong>of</strong> SiC materials. Fig.<br />
4 (a) shows the change in the attenuation coefficient for the specimen fabricated at the compositional<br />
ratio 1.5 as the thermal shock cycle increases. The attenuation coefficient increased gradually until the<br />
third times <strong>of</strong> thermal shock and did not change at the fourth and fifth times. However, it was sharply<br />
increased at the sixth times <strong>of</strong> thermal shock. These decreases in attenuation coefficient are closely<br />
connected with the damage behavior <strong>of</strong> SiC material by thermal shock. That is, the ultrasonic wave after<br />
propagating the SiC material <strong>under</strong>went thermal shock was scattered by a great number <strong>of</strong> micro cracks<br />
on the specimen, and the energy in ultrasonic wave was rapidly reduced. The received energy was<br />
gradually declined by the link-up <strong>of</strong> many micro cracks as thermal shock cycles were increased. The<br />
energy was sharply diminished due to the macro cracks caused the union between each micro crack at<br />
the six times <strong>of</strong> thermal shocks. Fig. 4(b) represents the change in velocity <strong>of</strong> ultrasonic wave as the<br />
thermal shock cycles increase. The velocity was from 11650 to 11700m/s with thermal shock cycles.<br />
The difference <strong>of</strong> 50m/s in velocity was in error by 0.4 percent and within the margin <strong>of</strong> error. Therefore<br />
the velocity did not change in spite <strong>of</strong> increase <strong>of</strong> cracks by the thermal shock cycles, and the<br />
characterization in tissue <strong>of</strong> material was not influenced by the thermal shock cycles <strong>under</strong> the 573K<br />
temperature. The considerable change in Young‟s modulus (E) <strong>of</strong> SiC material does not occur because<br />
the velocity <strong>of</strong> material has a closely connected with the Young‟ modulus. Fig. 5 shows the cracks on the<br />
surface <strong>of</strong> the SiC material using SEM as thermal shock cycles increase. Fig. 5(a) is the surface <strong>of</strong> the<br />
SiC material did not experience thermal shock at all. Fig. 5(b) is the specimen <strong>of</strong> 2 thermal shock cycles<br />
and Fig. 5(c) is the surface <strong>under</strong>went the sixth times <strong>of</strong> thermal shock cycles. As shown in Fig. 4 there<br />
are many short and long cracks on the surface <strong>of</strong> the SiC material at only 2 thermal shock cycles. These<br />
cracks were linked up each other and became large cracks with increase <strong>of</strong> thermal shock cycles. An<br />
enormous amount <strong>of</strong> micro cracks and a few macro cracks were inspected at the 6 thermal shock cycles<br />
as shown in Fig. 5(c). Therefore it was found that a great deal <strong>of</strong> micro cracks generated at low thermal<br />
shock cycles and those were connected with each other to macro cracks as thermal shock increase<br />
repetitively. The SiC material was completely broken by these macro cracks with cyclic thermal shocks.<br />
(a) 0 cycle (b) 2 cycles (c) 6 cycles<br />
Fig. 5. Cracks on the specimen according to the thermal shock cycles.
J K Lee, S P Lee, J H Byun. / An evaluation on thermal shock fatigue damage <strong>of</strong> SiC <strong>composite</strong> using nondestructive technique<br />
4. Conclusions<br />
(1) SiC material fabricated by liquid phase process and the flexural strength represented the highest at<br />
the composition ratio <strong>of</strong> additive materials 1.5 and the lowest at 2.3.<br />
(2) An ultrasonic test was one <strong>of</strong> useful means to estimate the flexural strength and optimum<br />
fabrication conditions <strong>of</strong> the monolithic SiC material nondestructively because the attenuation<br />
coefficient was the lowest <strong>of</strong> 90dB/m and 11650m/s in velocity at the composition ratio <strong>of</strong> additive<br />
materials 1.5.<br />
(3) The attenuation coefficient increased gradually as thermal shocks cycles increases, however the<br />
velocity did not change considerably. These decreases in attenuation coefficient are closely<br />
connected with the fatigue damage behavior <strong>of</strong> SiC material by thermal shock.<br />
(4) A great deal <strong>of</strong> micro cracks generated at low thermal shock cycles and those were connected with<br />
each other to macro cracks as thermal shock increase repetitively. The SiC material was completely<br />
broken by these macro cracks with cyclic thermal shocks fatigue damage.<br />
Acknowledgement<br />
This work was performed as a part <strong>of</strong> basic research program supported by Korea Institute <strong>of</strong><br />
Materials Science (KIMS)<br />
References<br />
[1] S. H. Lee, Y. I. Lee, Y. W. Kim, R. J. Xie, M. Mitomo and G. D. Zhan, Mechanical properties <strong>of</strong> hot-forged silicon carbide ceramics,<br />
Scripta materialia, 2005, 52: 153~156.<br />
[2] P. Norajitra, L. Buhler, U. Fischer, S. Gordeev, S. Malang, G. Reimann, Conceptual design <strong>of</strong> the dual-coolant blanket in the frame <strong>of</strong> the<br />
EU power plant conceptual study, Fus. Eng. Des., 2003, 69: 669~673.<br />
[3] L. Cheng, Y. Xu, L. Zhang and X. Yin, Oxidation behavior from room temperature to 1500℃ <strong>of</strong> 3D/SiC <strong>composite</strong>s with different<br />
coatings, J. Am. Ceram. Soc., 2002, 85(4): 989~991.<br />
[4] E. Tani, K. Shobu, D. Kishi and S. Umebayashi, Two-dimensional woven carbon fiber reinforced silicon carbide/carbon matrix <strong>composite</strong>s<br />
produced by reaction bonding, J. Am. Ceram. Soc., 1999, 82(5): 1355~1357.<br />
[5] G. Zheng, H. Sano, Y. Uchiyama, D. Kobayashi, K. Suzuki and H. Cheng, Preparation and fracture behavior <strong>of</strong> carbon fiber/SiC<br />
<strong>composite</strong>s by multiple impregnation and pyrolysis <strong>of</strong> polycarbosilane, J. <strong>of</strong> the Ceramic Society <strong>of</strong> Japan, 1998, 106(12): 1155~1161.<br />
[6] MIK. Collin, DJ. Rowcliffe, Influence <strong>of</strong> thermal conductivity and fracture toughness on the thermal shock resistance <strong>of</strong><br />
alumina-silicon-carbide-whisker <strong>composite</strong>s, Journal <strong>of</strong> the American Ceramic Society, 2001, 84(6): 1334~1340.<br />
307
Fabrication <strong>of</strong> ti/apc-2 nano<strong>composite</strong> laminates and their<br />
fatigue response at elevated temperature<br />
M-H R Jen a, *, Y-C Sung a , C-K Chang a , F-C Hsu b<br />
a Dept. <strong>of</strong> Mechanical and Electro-Mechanical Engineering, National Sun Yat-Sen University, No. 70, Lienhai Rd., Kaohsiung 80424, Taiwan,<br />
ROC<br />
b Language Center, Fooyin University, No. 151, Chinhsueh Rd., Ta-liao, Kaohsiung 83102, Taiwan, ROC<br />
Abstract<br />
The Ti/APC-2 cross-ply nano<strong>composite</strong> laminates were successfully fabricated. The Ti thin sheets were surface treated<br />
by anodic oxidation <strong>of</strong> electroplating to achieve good bonding with APC-2 laminates. Nanoparticles SiO2 were dispersed<br />
uniformly on the interfaces <strong>of</strong> APC-2 with the optimal amount <strong>of</strong> wt 1%. The modified diaphragm curing process was<br />
adopted to manufacture the hybrid laminates for minimal impact <strong>of</strong> production. Basically, the tensile tests at elevated<br />
temperature were conducted to obtain the baseline data <strong>of</strong> mechanical properties, such as strength and stiffness. The<br />
results <strong>of</strong> longitudinal stiffness predicted by the rule <strong>of</strong> mixtures (ROM) were in good agreement with experimental data,<br />
whilst, those ultimate strength predicted by ROM were lower than the measured data. The superior mechanical properties<br />
<strong>of</strong> the hybrid laminates were demonstrated. Then, the tension-tension (T-T) constant stress amplitude cyclic tests were<br />
performed at elevated temperature to receive the S-N curves, fatigue strength and life. It is a surprise that almost no<br />
delaminations were observed in tensile and cyclic tests, even at elevated temperature and over a million cycles.<br />
Keywords: Nano; Composite Laminate; Hybrid; <strong>Fatigue</strong>; Elevated Temperature<br />
1. Introduction<br />
Until now, it is well-known that fiber-reinforced aluminum laminates (FRALL) have been<br />
successfully fabricated and comercialized [1]. The aramid fiber-reinforced aluminum laminates<br />
(ARALL) and glass fiber/aluminum (GLARE) were marketed by the Aluminum Company <strong>of</strong> America<br />
for wide applications, such as aircraft lower wing skin, fuselage and tail skins [2]. Moreover, carbon<br />
fiber-reinforced aluminum laminates (CARALL) show a superior crack propagation resistance <strong>under</strong><br />
T-T fatigue <strong>loading</strong> [3]. Blohowiak et al. [4] fabricated Ti Gr <strong>composite</strong> laminates with the development<br />
<strong>of</strong> new thin adhesive systems at Boeing Co. However, the above mentioned FRALLs contain<br />
epoxy-resin polymer. The service temperature is not expected to exceed 373K. Hence, their applications<br />
are restricted at lower temperature. Based on the experience <strong>of</strong> successfully manufacturing the<br />
Mg/APC-2 nano<strong>composite</strong> laminates [5], high performance laminated hybrid <strong>composite</strong>s were<br />
developed for the Ti alloys, using the grade 1 thin sheets sandwiched with the high strength cross-ply<br />
CF/PEEK prepregs. The PEEK polymer can sustain its mechanical properties up to 423K [6], thus it is<br />
postulated that the current Ti/CF/PEEK <strong>composite</strong> laminates might be utilized at higher temperatures.<br />
Anodic method is a commonly used surface treatment, especially in titanium alloys for structural and<br />
* Corresponding author. Tel.: +886-7-5252000 ext.4216; fax:+886-7-5254299.<br />
E-mail address: jmhr@mail.nsysu.edu.tw
M-H R Jen, Y-C Sung, etc. / Fabrication <strong>of</strong> ti/apc-2 nano<strong>composite</strong> laminates and their fatigue response at elevated temperature<br />
engineering applications. However, the bonding capability <strong>of</strong> polymer <strong>composite</strong>s to titanium thin plates<br />
is still a problem. In order to improve their interfacial bonding capability, numerous surface treatments<br />
have been studied [7-8]. Previous research showed that bond durability and strength can be improved by<br />
surface treating [9]. Ramani et al. [10] found the chromic acid anodic method did excellent work.<br />
Chromic acid anodic oxidation produced an oxide layer <strong>of</strong> thickness 40~80 nm for the 5V and 10V<br />
treatments [11]. The anodic oxidation was a chromic acid solution with and without hydr<strong>of</strong>luoric acid<br />
(HF) addition. Zwilling, et al. [12] revealed that a thin oxide compact layer formed in chromic acid<br />
anodic oxidation and a duplex film composed <strong>of</strong> a compact layer surmounted by a porous layer grew<br />
from the fluorinated electrolyte.<br />
Nowadays, “lighter, thinner, stronger and cheaper” are the goals <strong>of</strong> materials science and engineering,<br />
especially in nanoscale age. Engineering materials at the atomic and molecular levels are creating a<br />
revolution in the fields <strong>of</strong> materials and processing. In recent years, inorganic nanoparticles filled<br />
polymer <strong>composite</strong>s have attracted more and more attention because the filler/matrix interface in these<br />
<strong>composite</strong>s might constitute a much greater area and hence influence the properties <strong>of</strong> <strong>composite</strong>s to a<br />
much greater extent at rather low filler concentration [13]. Herein, our concern is focused on a small<br />
part <strong>of</strong> engineering application, i.e., adding SiO2 nanoparticles 1wt% optimally on the interfaces in<br />
APC-2 <strong>composite</strong> laminates to improve the mechanical properties due to static and cyclic <strong>loading</strong>s at<br />
elevated temperature [14]. Yao, et al. investigated the macro/microscopic fracture features <strong>of</strong><br />
SiO2/Epoxy nano<strong>composite</strong>s [15]. Mahrholz, et al. studied the reinforcement effect <strong>of</strong> silica<br />
nanoparticles in epoxy resins by liquid moulding processes [16]. Manjunatha, et al. studied the fatigue<br />
response <strong>of</strong> silica nanoparticles modified Glass/Epoxy <strong>composite</strong>s [17]. The incorporation <strong>of</strong> inorganic<br />
particulate fillers into polymer matrix has been proved to be an effective way for improving the<br />
mechanical properties <strong>of</strong> the matrix. However, the dispersion state <strong>of</strong> nanoparticles in polymer matrix is<br />
<strong>of</strong> great importance for the mechanical properties <strong>of</strong> the <strong>composite</strong>. A homogeneous dispersion <strong>of</strong><br />
nanoparticles is believed to contribute better to the property improvement [18].<br />
From the bonding <strong>of</strong> Ti with APC-2 by the modified diaphragm curing process, Ti/APC-2 hybrid<br />
nano<strong>composite</strong> laminates were successfully fabricated. Also, the mechanical properties subjected to<br />
both tensile and cyclic tests at elevated temperatures were obtained. The failure mechanisms were<br />
observed. The response <strong>of</strong> mechanical behavior was highlighted.<br />
2. Fabrication<br />
The twelve-inch wide unidirectional AS-4/PEEK prepregs from Cytec Industries Inc. (USA) were cut<br />
and stacked into cross-ply [0/90]s laminates. The grade 1 (H: 0.015%, O: 0.18%, N: 0.03%, Fe: 0.2%, C:<br />
0.08% ) Ti sheets, supplied by KOBE STEEL LTD (Japan), were 0.5mm thick after rolled, heated and<br />
flattened with scratch brushing. The density <strong>of</strong> grade l Ti is 4.51 g/cm 3 , melting point temperature is<br />
1670 o C, ultimate tensile strength is 305MPa, and modulus <strong>of</strong> elasticity is 71GPa.<br />
Prior to lamination, the slimmed Ti sheets were subjected to pretreatment in order to create the tough<br />
bonding with the APC-2 prepregs. Naturally, Ti sheets possess high resistance to chemical etching. Thus,<br />
two different surface treatments <strong>of</strong> titanium sheets were chosen, one by mechanical polishing method<br />
309
310<br />
Fifth International Conference on <strong>Fatigue</strong> <strong>of</strong> Composites<br />
and another by chromic acid anodic method. The latter was found better as demonstrated by the results<br />
<strong>of</strong> tensile and cyclic tests even at elevated temperature. After anodic processing, the thickness <strong>of</strong> oxide<br />
coating film was about 40~80nm. The anodic oxide coating was observed uniform by SEM, and the<br />
composition <strong>of</strong> coating consisting <strong>of</strong> TiO2 by EDS. The nanoparticles SiO2 (Nanostructured &<br />
Amorphous Materials, Inc. USA) possess the average diameter 15±5nm, specific surface area<br />
160±20m 2 /g, spherical crystallographic and amorphous powder. The optimal amount <strong>of</strong> SiO2 was found<br />
1% by wt. <strong>of</strong> laminate [14].<br />
The cross-ply APC-2 nano<strong>composite</strong> were sandwiched with the Ti sheets to produce Ti/CF/PEEK<br />
hybrid laminates, expressed as Ti/APC-2/Ti/APC-2/Ti totally 5 layers. The modified diaphragm curing<br />
process was shown in Fig. 1. The geometry and dimensions <strong>of</strong> a hybrid nano<strong>composite</strong> specimen were<br />
shown in Fig. 2.<br />
3. Experimental<br />
Fig. 1. Curing process for Ti/APC-2 hybrid nano<strong>composite</strong> laminates.<br />
(a) (b)<br />
Fig. 2. The (a) geometry and (b) dimensions <strong>of</strong> hybrid nano<strong>composite</strong>s specimen.<br />
An MTS-810 servohydraulic computer-controlled dynamic material testing machine was used to<br />
conduct the tensile test and constant stress amplitude T-T cyclic test with stress ratio=0.1,
M-H R Jen, Y-C Sung, etc. / Fabrication <strong>of</strong> ti/apc-2 nano<strong>composite</strong> laminates and their fatigue response at elevated temperature<br />
frequency=5Hz, sinusoidal wave form <strong>under</strong> load-controlled mode at elevated temperatures, such as<br />
25 o C(RT), 75, 100, 125, 150 o C (slightly above APC-2 Tg=143 o C). An MTS 651 environmental chamber<br />
was also installed to keep and control the corresponding temperature <strong>of</strong> a specimen for testings. A<br />
25mm MTS-634.11F-25 extensometer was used to monitor the strain continuously during the tests.<br />
4. Results<br />
The nanoscale structure <strong>of</strong> oxide layer which has been observed by SEM was shown in Fig. 3. A<br />
columnar and porous layer grown on titanium with fluorinated chromic acid electrolyte was found<br />
uniform. There exists a kink angle in stress-strain curves at all elevated temperatures. That results in the<br />
initial tangent modulus and secant modulus in longitudinal direction. The early yielding <strong>of</strong> Ti sheets is<br />
the main reason. Fig. 4 is an example <strong>of</strong> ζ-ε curve at RT. The mechanical properties, such as ultimate<br />
tensile strength and longitudinal stiffness, <strong>of</strong> Ti/APC-2 cross-ply nano<strong>composite</strong> laminates at elevated<br />
temperatures were listed in Table 1.<br />
Table 1. The averaged mechanical properties <strong>of</strong> Ti/APC-2 cross-ply nano<strong>composite</strong> laminates at various temperatures.<br />
Temperature ( o C) Ultimate Load (KN) ζult (MPa) εmax E11i (GPa) E11s (GPa)<br />
25(RT) 46.77±0.60 719.59± 9.22 0.015±0.0005 109.79±5.19 33.84±2.39<br />
75 44.39±1.09 682.87±16.79 0.014±0.0003 107.96±1.05 32.95±0.50<br />
100 41.48±1.33 638.15±20.39 0.013±0.0001 106.39±6.02 33.30±1.72<br />
125 40.26±0.56 619.38± 8.66 0.013±0.0001 104.83±8.38 33.16±0.64<br />
150 39.21±1.33 603.28±20.50 0.013±0.0001 101.71±0.53 33.71±1.71<br />
Kink angle is due to yielding <strong>of</strong> Ti sheets<br />
E11i (Initial Longitudinal Stiffness) E11s (Secant Modulus)<br />
25 o C: 0.001≤ε≤0.0022 0.0022≤ε≤0.006<br />
75 o C: 0.001≤ε≤0.0020 0.0020≤ε≤0.006<br />
100 o C: 0.001≤ε≤0.0019 0.0019≤ε≤0.006<br />
125 o C: 0.001≤ε≤0.0018 0.0018≤ε≤0.006<br />
150 o C: 0.001≤ε≤0.0017 0.0017≤ε≤0.006<br />
Fig. 3. Scanning electron microscopy image <strong>of</strong> oxide layer on the titanium surface by chromic acid anodic method.<br />
311
312<br />
Fifth International Conference on <strong>Fatigue</strong> <strong>of</strong> Composites<br />
Fig. 4. The stress-strain curve <strong>of</strong> Ti/APC-2 cross-ply nano<strong>composite</strong> laminate.<br />
After the constant stress T-T tests, the stress vs. cycles (S-N) curves for Ti/APC-2 cross-ply<br />
nano<strong>composite</strong> laminates at elevated temperature were received and shown in Fig. 5. It is reasonable to<br />
see the curves going downwards as the temperature rising. The normalized stress vs. cycles curves were<br />
shown in Fig. 6, in which the curves were almost mixed together. It needs be mentioned the normalized<br />
stress is the stress normalized by the ultimate strength at the corresponding temperature, not at RT.<br />
Some samples as shown in Figs. 5 and 6, did not fail even over a million <strong>of</strong> cycles at elevated<br />
temperatures.<br />
Fig. 5. The S-N curves <strong>of</strong> Ti/APC-2 cross-ply nano<strong>composite</strong> laminates at elevated temperatures.
M-H R Jen, Y-C Sung, etc. / Fabrication <strong>of</strong> ti/apc-2 nano<strong>composite</strong> laminates and their fatigue response at elevated temperature<br />
5. Discussion<br />
Fig. 6. The normalized S-N curves <strong>of</strong> Ti/APC-2 cross-ply nano<strong>composite</strong> laminates at elevated temperatures.<br />
It is interesting to see a kink angle in stress-strain curves at various temperatures. The lower yielding<br />
stress <strong>of</strong> Ti sheets results in the feature. That was not obviously found in our previous tests <strong>of</strong><br />
Mg/APC-2 and Al/APC-2 W/O nanoparticles, SiO2, <strong>composite</strong> laminates. The ultimate strength and<br />
initial tangent modulus <strong>of</strong> Ti/APC-2 laminates decrease as temperature rising; whilst the secant modulus<br />
almost remains unchanged. Almost no delaminations were observed during the tensile tests until the<br />
sample failed. That can be demonstrated in Fig. 3, an uniform oxide layer on Ti sheets improves the<br />
bonding capability and strength with PEEK matrix.<br />
Until now, there has been no widely accepted rules to predict the mechanical properties <strong>of</strong> hybrid<br />
nano<strong>composite</strong> laminates. Then, based on the constant stress assumption and neglecting Hill‟s<br />
concentration factors the simplified ROM, Eqs.(1) and (2), are adopted for a hybrid nano<strong>composite</strong><br />
laminate consisting <strong>of</strong> four phases, such as Ti sheet, fiber, matrix and nanoparticle [19].<br />
E = E + E + E <br />
(1)<br />
11i Ti Ti APC-2 APC-2 SiO2 SiO2<br />
= + + <br />
(2)<br />
ult Ti Ti APC-2 APC-2 SiO2 SiO2<br />
where E11i is the initial tangent modulus, ζult is the ultimate strength, the subscripts Ti, APC-2, and SiO2<br />
are Titanium sheet, APC-2 <strong>composite</strong> laminate and SiO2 nanoparticle. The efficiency coefficient η<br />
would decrease as reinforcement aspect ratio decreasing. From previous literature review [20], the SiO2<br />
nanoparticles with an aspect ratio <strong>of</strong> ≈1 the η is assumed to be ≈0.1 for short fiber reinforced<br />
<strong>composite</strong>s.<br />
The mechanical properties <strong>of</strong> PEEK have been enhanced obviously by adding 15nm SiO2<br />
nanoparticles into PEEK polymer with a small weight percentage [20]. Meanwhile, the theoretical<br />
ultimate strength predictions were 8~15% less than the experimental data. In this study the ultimate<br />
strengths at varied temperature, predicted by ROM listed in Table 2, are also found 3~11.11% less than<br />
313
314<br />
Fifth International Conference on <strong>Fatigue</strong> <strong>of</strong> Composites<br />
the experimental data. It can be explained that the micro-scale reinforcements are similar in size to<br />
critical cracks causing early failure [21-22], while the nano-scale reinforcements are an order <strong>of</strong><br />
magnitude smaller. That can prevent early failure and enhance toughness [23]. Moreover, in nano-scale,<br />
the interfacial area creates a significant improvement <strong>of</strong> polymer matrix with the reinforcements. Hence,<br />
the reinforcing efficiency <strong>of</strong> traditional ROM may not be suitable for nano<strong>composite</strong> laminates. From<br />
Table 2, it also demonstrates that the anodic method <strong>of</strong> surface treatment on Ti sheets works well and<br />
provides good bonding with APC-2. Nevertheless, the experimental data for longitudinal stiffness, E11i,<br />
listed in Table 3, are close to the predictions by ROM.<br />
Table 2. The measured ultimate strength <strong>of</strong> Ti/APC-2 cross-ply laminates in comparison with the results predicted by ROM.<br />
Table 3. The measured longitudinal stiffness <strong>of</strong> Ti/APC-2 cross-ply laminates in comparison with the results predicted by ROM.<br />
For nano<strong>composite</strong>s, the properties and structure <strong>of</strong> interfacial region are not yet known quantitatively,<br />
presenting a challenge to predict the properties <strong>of</strong> polymer nano<strong>composite</strong>s [24]. Until now, it has been<br />
still a popular issue to predict the properties <strong>of</strong> two-phase polymer nano<strong>composite</strong>s with nano-scale<br />
reinforcement. In this case, the four-phase nano<strong>composite</strong> laminates were successfully fabricated. Also,<br />
it is a very complicated problem to predict the mechanical properties at varied temperatures. Although it<br />
looks good for longitudinal stiffness with small errors, it is interesting to see that the data <strong>of</strong> strength<br />
were greater than those predicated by ROM. That is contrary to our expectation, since the received data<br />
<strong>of</strong> strength should be less than those predictive values because <strong>of</strong> the imperfection <strong>of</strong> constituent<br />
material and the defects caused by fabricating. Maybe, the simplified ROM is not appropriate for the<br />
prediction <strong>of</strong> strength, whilst, it is suitable for the stiffness predation. From the opposite point <strong>of</strong> view,
M-H R Jen, Y-C Sung, etc. / Fabrication <strong>of</strong> ti/apc-2 nano<strong>composite</strong> laminates and their fatigue response at elevated temperature<br />
the obtained mechanical properties and the fabrication process are much better than those ever existed.<br />
The S-N curves generally go downwards as temperature increasing. Importantly, the trend <strong>of</strong> S-N<br />
curves is monotonically non-increasing less than 10 2 cycles, because they are flat, and becoming sharply<br />
dropped afterwards. Almost all samples treated by anodic method can resist cyclic <strong>loading</strong> nearly 10 6<br />
cycles, and some even over 10 6 cycles without failure. Also, little delamination was found during the<br />
cyclic tests. The superior bonding capability <strong>of</strong> surface-treated Ti Sheets will matrix PEEK is verified.<br />
6. Conclusion<br />
The Ti/APC-2 hybrid cross-ply nano<strong>composite</strong> laminates were fabricated. The concluding remarks<br />
were summarized as follows.<br />
• Ti/APC-2 hybrid laminates were successfully fabricated.<br />
• It was obvious that the chromic acid anodic method <strong>of</strong> surface treatment works very well.<br />
• The ROM originally for short-fiber reinforced <strong>composite</strong>s can provide a rough prediction for the hybrid<br />
nano<strong>composite</strong>s. The predicted values <strong>of</strong> ultimate strength are lower than the measured data, and those<br />
<strong>of</strong> longitudinal stiffness are close to the measured data.<br />
• In fatigue tests, almost no delaminations were found at 10 6 cycles.<br />
• Ultimate tensile strength, longitudinal stiffness E11i, and S-N curves go downwards as temperature<br />
rising, especially at 150 o C. The secant modulus was kept unchanged at various temperatures.<br />
Acknowledgements<br />
The authors would like to gratefully acknowledge the sponsorship from National Science Council<br />
<strong>under</strong> the project no. NSC 96-2221-E-110-072<br />
References<br />
[1] L. B. Vogelsang and J. W. Gunnink, ARALL: A materials challenge for the next generation <strong>of</strong> aircraft, Material and Design, 7 (6), pp.<br />
287-300, 1986.<br />
[2] T. Lin, P. W. Kao and F. S. Yang, <strong>Fatigue</strong> <strong>behaviour</strong> <strong>of</strong> carbon fibre-reinforced aluminium laminates, Composites, 22, No. 2, pp. 135-142.<br />
1991.<br />
[3] T. Lin and P. W. Kao, Effect <strong>of</strong> fiber bridging on the fatigue crack propagation in carbon fiber-reinforced aluminum laminates, Material<br />
Science and Engineering, A190, pp.65-73, 1995.<br />
[4] K. Y. Blohowiak, R. A. Anderson, W. B. H. Grace, J. W. Grob and D. H. Fry, “TiGr”Laminates: Development <strong>of</strong> New Thin Adhesive<br />
Systems and Associated Test Methods, SAMPE Journal, 45, No. 3, pp. 30-36, 2009.<br />
[5] M.-H. R. Jen, Y.-C. Tseng and P.-Y. Li, <strong>Fatigue</strong> response <strong>of</strong> hybrid magnesium/carbon-fiber/PEEK nano<strong>composite</strong> laminates at elevated<br />
temperature, Journal <strong>of</strong> JSEM, 7, Special Issue, pp. 56-60, 2007.<br />
[6] T. E. Attwood, P. C. Dawson, L. J. Freeman, L. R. J. Hoy, J. B. Rose and P. A. Staniland, Synthesis and properties <strong>of</strong> polyaryletherketones,<br />
Polymer, 22, pp. 1096-1103, 1981.<br />
[7] G. W. Critchlow and D. M. Brewis, Review <strong>of</strong> surface pretreatments for titanium alloys, Int. J. Adhesion and Adhesives, 15, pp.161-172,<br />
1995.<br />
[8] P. Molitor, V. Barron and T. Young, Surface treatment <strong>of</strong> titanium for adhesive bonding to polymer <strong>composite</strong>s: a review, Int. J. Adhesion<br />
and Adhesives, 21, pp. 129-136, 2001.<br />
[9] A. J. Kinloch (Editor), Durability <strong>of</strong> structural adhesives, Springer Publishers, pp. 255-262, 1983.<br />
[10] K. Ramani, W. J. Weidner and G. Kumari, Silicon sputtering as a surface treatment to titanium alloy for bonding with PEKEKK, Int. J.<br />
Adhesion and Adhesives, 18, pp. 401-412, 1998.<br />
315
316<br />
Fifth International Conference on <strong>Fatigue</strong> <strong>of</strong> Composites<br />
[11] B. M. Ditchek, K. R. Breen, T. S. Sun and J. D. Venables, Morphology and composition <strong>of</strong> titanium adherends prepared for adhesive<br />
bonding, In: Proc. 25th Nat. SAMPE Symp., pp.13-24, 1980.<br />
[12] V. Zwilling , M. Aucouturier, E. Darque-Ceretti, Anodic oxidation <strong>of</strong> titanium and TA6V alloy in chromic media. An electrochemical<br />
approach, Electrochimica Acta, 45, pp.921-929, 1999.<br />
[13] C. L. Wu, M. Q. Zhang, M. Z. Rong, K. Friedrich, Silica nanoparticles filled polypropylene: effects <strong>of</strong> particle surface treatment matrix<br />
ductility and particle species on mechanical performance <strong>of</strong> the <strong>composite</strong>s, Composites Science and Technology, 65, pp. 635-645, 2005.<br />
[14] M.-H. R. Jen, Y.-C. Tseng, C.-H. Wu, Manufacturing and mechanical response <strong>of</strong> nano<strong>composite</strong> laminates, Composites Science and<br />
Technology, 65, pp. 775-779, 2005.<br />
[15] X. F. Yao, D. Zhou, H. Y. Yeh, Macro/micro fracture characterization <strong>of</strong> SiO2/epoxy nano<strong>composite</strong>s, Aerospace Science and Technology,<br />
12, pp. 223-230, 2008.<br />
[16] T. Mahrholz, J. Stängle, M. Sinapius, Quantitation <strong>of</strong> the reinforcement effect <strong>of</strong> silica nanoparticles in epoxy resins used in liquid<br />
<strong>composite</strong> moulding processes, COMPOSITES: Part A, 40, pp. 235-243, 2009.<br />
[17] C. M. Manjunatha, A. C. Taylor, A. J. Kinloch, S. Sprenger, The tensile fatigue <strong>behaviour</strong> <strong>of</strong> a silica nanoparticle-modified glass fibre<br />
reinforced epoxy <strong>composite</strong>, Composites Science and Technology, 70, pp. 193-199, 2010.<br />
[18] G. Zhang, A. K. Schlarb, S. Tria, O. Elkedim, Tensile and tribological behaviors <strong>of</strong> PEEK/nano-SiO2 <strong>composite</strong>s compounded using a ball<br />
milling technical, Composites Science and Technology, 68, pp. 3073-3080, 2008.<br />
[19] C. T. Herakovich, Mechanics <strong>of</strong> Fibrous Composites, John Wiley & Sons, Inc., 1998.<br />
[20] M.C. Kuo, C.M. Tsai, J.C. Huang, M. Chen, PEEK <strong>composite</strong>s reinforced by nano-sized SiO2 and Al2O3 particulates, Materials<br />
Chemistry and Physics, 90, pp.185-195, 2005.<br />
[21] T. Liu, I. Y. Phang, L. Shen, S. Y. Chow, and W.-D. Zhang, Morphology and Mechanical Properties <strong>of</strong> Multiwalled Carbon Nano<strong>tubes</strong><br />
Reinforced Nylon-6 Composites, Macromolecules, 37 (19), pp. 7214-7222, 2004.<br />
[22] Z.H. Xia, W. A. Curtin, and B. W. Sheldon, A New Method to Evaluate the Fracture Toughness <strong>of</strong> Thin Films, Acta Materialia, 52, pp.<br />
3507-3517, 2004.<br />
[23] W. Naous , X.-Y. Yu , Q.-X. Zhang, K. Naito, Y. Kagawa, Morphology, tensile properties, and fracture toughness <strong>of</strong> epoxy/Al2O3<br />
nano<strong>composite</strong>s, Journal <strong>of</strong> Polymer Science Part B: Polymer Physics, 44(10), pp. 1466-1473, 2006.<br />
[24] L.S. Schadler, L.C. Brinson, and W.G. Sawyer, Polymer Nano<strong>composite</strong>s: A Small Part <strong>of</strong> the Story, Journal <strong>of</strong> Materials,59, pp.<br />
53-70 ,2007<br />
[25] W.D. Callister Jr, Materials Science and Engineering: An Introduction, 6th ed., Wiley, New York, USA, 2003.
<strong>Fatigue</strong> and Fracture <strong>of</strong> Elastomeric Matrix Nano<strong>composite</strong>s<br />
Abstract<br />
C Bathias *, S Y Dong<br />
LEME, University Paris 10, 50 rue de Sévres, Ville d’Avray 92410 (Fr)<br />
This paper is a review <strong>of</strong> what was done in our laboratory by several PHD students (Lu Chuming, K. Legorju, S. Dong)<br />
in order to have a better <strong>under</strong>standing and prediction <strong>of</strong> the mechanical <strong>behaviour</strong> and <strong>of</strong> the damage <strong>of</strong> elastomeric<br />
matrix used for rubber <strong>composite</strong>s. Both, monotonic and cyclic <strong>loading</strong>s are <strong>of</strong> interest.<br />
Keywords: NR; SBR; fatigue; fracture; cavitations<br />
1. Introduction<br />
Elastomeric matrix <strong>composite</strong>s are usually reinforced by mineral particles such as carbon black and<br />
sometime by long metallic or organic fibbers. In absence <strong>of</strong> fibber, rubbers can be considered as<br />
nano<strong>composite</strong>s.<br />
As soon as rubber is subjected to a cyclic strain, its temperature increases, especially within the<br />
material. This temperature increase results in a modification <strong>of</strong> the properties and possibly to damage.<br />
Within natural rubber and within some other synthetic rubbers, the amorphous micro-structure tends to<br />
partly crystallize when the deformation is significant. In addition, <strong>under</strong> cyclic pressure, it seems that<br />
rubber can be subjected to a chemical damage along with a solid-liquid phase change, and maybe with an<br />
influence <strong>of</strong> the ambient air. In other words, <strong>under</strong> natural <strong>loading</strong> conditions, rubber fatigue cracking is<br />
a function <strong>of</strong> the combination <strong>of</strong> three damaging types: mechanical, thermal and chemical.<br />
Experience shows that <strong>under</strong> cyclic <strong>loading</strong>, rubbers get damaged until the formation <strong>of</strong> one or<br />
several main cracks which propagate. Like in metals, crack initiation and then crack propagation are<br />
usually studied separately. Since 1953, Rivlin and Thomas [1], then Lake [2] and Lindley [3] in the 1960s,<br />
and finally Gent and Stevenson in the 1980s [4,5] applied Griffith criterion (G) to the tearing <strong>of</strong><br />
elastomers. In this case, the dissipated energy rate G is replaced, by the authors cited above, by the<br />
notion <strong>of</strong> tearing energy T whose physical definition is similar to G.<br />
However, the elasticity <strong>of</strong> elastomers is not linear and in addition, cracks subjected to high<br />
deformations do not remain sharp as Griffith model suggests. Nevertheless, there is not energy<br />
dissipation due to plasticity and the failure mechanisms <strong>of</strong> rubbers are <strong>of</strong> the “fragile” type. When the<br />
fracture mechanics is applied to fatigue cracking, the cyclic damaging <strong>of</strong> rubbers depends on the<br />
mechanical stress (frequency, ratio R) but also on the temperature and on thermal dissipation, and<br />
finally on the environment and obviously on the combination <strong>of</strong> all these parameters. Air oxygen is<br />
* Corresponding author.<br />
E-mail address: claude@bathias.com
318<br />
Fifth International Conference on <strong>Fatigue</strong> <strong>of</strong> Composites<br />
known to significantly influence the fatigue <strong>of</strong> rubbers. In what follows, we will try to propose a<br />
comprehensive approach <strong>of</strong> the fatigue cracking <strong>of</strong> natural rubbers by defining the main mechanical<br />
parameters and the influence <strong>of</strong> the damaging mechanisms related to the micro-structural aspect <strong>of</strong><br />
rubbers, in order to <strong>under</strong>stand crack propagation.<br />
2. <strong>Fatigue</strong> life <strong>of</strong> natural rubbers<br />
Natural rubbers reinforced with carbon black are amorphous at ambient temperature. Stretched by a<br />
traction <strong>loading</strong>, these rubbers partly crystallize. As the mechanical properties are clearly different<br />
before and after crystallization, a strong influence <strong>of</strong> the mean stress on the fatigue life time, is<br />
expected.<br />
In Figure2, the effect <strong>of</strong> the mean stress on the life time is illustrated by some results obtained on a<br />
natural rubber subjected to an alternate stress <strong>of</strong> 1 MPa and then <strong>of</strong> 1.5 MPa. Specimens are axi-symmetrical<br />
with a hour glass shape <strong>of</strong> de 26 mm diameter (Figure1).<br />
Fig. 1. Endurance specimen.<br />
The initiation <strong>of</strong> the crack can be predicted using an SN curve. In natural rubber, for mean stress<br />
lower than the alternate stress value, corresponding to a traction-compression mode, fatigue life<br />
decreases when the stress increases.<br />
Fig. 2. Effect <strong>of</strong> the mean strain on the life time <strong>of</strong> rubbers<br />
(NR natural rubber ; CF polychloroprene ; SBR polybutadiene)<br />
However, <strong>under</strong> a tension-tension mode, the mechanism gets suddenly reversed: the natural rubber<br />
gets reinforced and leads to a better behavior <strong>under</strong> increasing mean straess. This reinforcement is due<br />
to the formation <strong>of</strong> crystallite which prevents any crack initiation and progression to occur.
C Bathias, S Y Dong. / <strong>Fatigue</strong> and Fracture <strong>of</strong> Elastomeric Matrix Nano<strong>composite</strong>s<br />
2.1 SN curve regarding crystallisable rubbers<br />
To characterize the behavior <strong>of</strong> materials <strong>under</strong> fatigue conditions, Wöhler‟s representation is<br />
defined by this equation:<br />
Log Nf = a - b (1)<br />
In this representation, a and b are two constants; is usually the amplitude <strong>of</strong> the applied stress. This<br />
equation can be represented by a line with - Log Nf coordinates.<br />
As the compression strain distroyed the crystallites which got formed <strong>under</strong> traction. It would be<br />
more suitable to give Wöhler‟s equation with the maximum strain instead <strong>of</strong> the strain amplitude. The<br />
equation can then be written as:<br />
Log Nf = a - b max (2)<br />
In order to apply the Wöhler equation, a stress term cris which comes from the crystallization effect<br />
is introduced. The equation becomes then:<br />
2.2 Crack propagation within natural rubber<br />
Log Nf = a - b max - cris (3)<br />
cris = 0 lorsque min >0 et cris >0 lorsque min < 0 (4)<br />
In order to apply traction or compression, a thick cantilever specimen with a lateral notch is used.<br />
As we would like to avoid geometry issues, a large specimen (see Figure 3) with a length <strong>of</strong> 150 mm,<br />
is used. The fatigue crack gets initiated from a mechanical notch cut with a razor blade and with a<br />
length <strong>of</strong> 20 mm. Crack propagation is studied as a function <strong>of</strong> the dissipated energy rate, given by the<br />
following equation:<br />
1<br />
T dU<br />
= (5)<br />
b dA<br />
where “U” is the elastic energy for a crack with a surface <strong>of</strong> “A”. Thickness “b” is corrected by the<br />
lateral deformation at the crack tip when “T” is determined thanks to the compliance method. Crack<br />
length “a” is measured with a video camera recorder. According to Griffith criterion, the dissipated<br />
energy level is calculated in the case <strong>of</strong> a crack extension given when failure occurs. The growth <strong>of</strong> the<br />
crack comes then to:<br />
T = Tmax - Tmin<br />
Fig. 3. Cracking specimen to be used for rubbers.<br />
319
320<br />
2.3 Crack growth curve – Influence <strong>of</strong> ratio R<br />
Fifth International Conference on <strong>Fatigue</strong> <strong>of</strong> Composites<br />
Cracking experiments confirm the existence <strong>of</strong> a sigmoid relationship between da/dN and T which<br />
can be written as:<br />
da n<br />
= C. T<br />
(6)<br />
dN<br />
For the low values <strong>of</strong> T, a non-cracking threshold Ts) can be defined (see Figure 4). The<br />
threshold significantly increases when ratio R increases which is different from what is observed in<br />
metals. We should point out that when ratio R reaches 0.5, the crack does not propagate anymore <strong>under</strong><br />
fatigue conditions whatever the maximum force applied.<br />
Fig. 4. Cracking curve as a function <strong>of</strong> ratio R.<br />
However, when ratio R reaches -1, <strong>under</strong> symmetrical traction-compression conditions, threshold <br />
Ts is almost inexistent. As a consequence, the fatigue crack does not propagate, even for the lowest<br />
stress when R =- 1.<br />
When we have a traction-compression stress, a chemical decomposition <strong>of</strong> the rubber can be observed<br />
at the crack tip where black drops come out. The cyclic damaging <strong>under</strong> compression is likely to lead to<br />
an oxidation, a chemical reaction, which comes after mechanical damaging.<br />
In the reverse case where ratio R is equal to 0.5, the elongation at the crack tip is <strong>of</strong> several hundreds<br />
percents, which leads to a local crystallization <strong>of</strong> the natural rubber, which goes against crack<br />
propagation. This crystallization effect does not occur anymore when R = -1 as the reversibility <strong>of</strong><br />
crystallization appears during the compression phase.<br />
We can seriously conclude that propagation strength <strong>of</strong> fatigue cracks within natural rubber is much<br />
better when the statistical stress <strong>of</strong> the cycle is high but also when the minimum stress <strong>of</strong> the cycle<br />
<strong>under</strong> compression is very damaging.<br />
2.4 Influence <strong>of</strong> the test temperature<br />
As we can expect, the cracking rate increases when the temperature increases (see Figure 5). For a<br />
same ratio R = 0.2, the cracking threshold drops from 10 to 3 kN/m between 25 o C and 80 o C, as the
C Bathias, S Y Dong. / <strong>Fatigue</strong> and Fracture <strong>of</strong> Elastomeric Matrix Nano<strong>composite</strong>s<br />
tests were carried out in air. This weakening <strong>of</strong> the strength with temperature is related to the increase <strong>of</strong><br />
the mechanical damage, <strong>of</strong> the chemical damage as well as <strong>of</strong> the decrease <strong>of</strong> crystallization.<br />
2.5 Influence <strong>of</strong> the environment and crossed environment-temperature effects<br />
The environment does obviously influences chemical damaging. Some tests carried out in air, in water<br />
and <strong>under</strong> dry nitrogen at 25 o C clearly show the effect <strong>of</strong> gaseous oxygen (see Figures 5and6). In water,<br />
the cracking threshold is higher than in air as the dry nitrogen environment gives the highest threshold<br />
(respectively 10, 20 and 50 kN/m when R = 0.2). To make sure that the effect <strong>of</strong> water is not related to<br />
thermal dissipation, some tests run in water and in air at 50 o C were compared. They show that the<br />
cracking threshold at 50 o C is still higher in water than in air. Thus, the environment effect occurs in the<br />
same way at 25 o C and at 50 o C.<br />
Fig. 5. Influence <strong>of</strong> the temperature on the NR cracking.<br />
This study shows that gaseous oxygen accelerates fatigue cracking at room temperature and also at<br />
higher temperatures when ratio R is positive, which means as soon as crystallization occurs when the<br />
crack tip gets opened.<br />
Nevertheless, when crystallization does only occur when R = -1, it seems that fatigue cracking is not<br />
the same in air than in water. To get a cracking threshold when R = -1, any trace <strong>of</strong> oxygen must be<br />
removed in <strong>under</strong> pure nitrogen. The threshold reaches then 10 kN/m (Figure5).<br />
We can then conclude from this experiment that the influence <strong>of</strong> the environment is more significant<br />
than the amorphous-crystalline transformation inhibited by compression at the crack tip. Under<br />
traction-compression conditions, just some oxygen traces can keep the chemical damaging going at the<br />
crack tip as it only disappears <strong>under</strong> nitrogen.<br />
321
322<br />
Fifth International Conference on <strong>Fatigue</strong> <strong>of</strong> Composites<br />
Fig. 6. Influence <strong>of</strong> the environment on NR cracking.<br />
Fig. 7. Combined influence <strong>of</strong> the temperature and <strong>of</strong> the environment 3- Propagation mechanisms <strong>of</strong> cracks within natural rubber.<br />
By fractography, different cracking mechanisms due to fatigue were observed. The evolution <strong>of</strong> the<br />
micro-structure is important depending on the propagation rates. When the cracking rates are low (at the<br />
cracking threshold), the mechanisms become fragile. Secondary micro-cracks get multiplied. For faster<br />
rates, we can observe more facets and a rougher relief. The existence <strong>of</strong> fatigue striations can be<br />
observed for high cracking rates (10 -3 mm/cycle) (see Figure 8).<br />
Fracture mechanisms obtained when R = -1 present some small transformed zone, due to the high<br />
compression levels obtained, leading to a significant chemical deterioration.<br />
The more we increase ratio R, the more wrenching we can observe. Nevertheless, their distribution is<br />
more homogeneous. We can also notice the presence <strong>of</strong> many cupules <strong>of</strong> about 1 µm.
C Bathias, S Y Dong. / <strong>Fatigue</strong> and Fracture <strong>of</strong> Elastomeric Matrix Nano<strong>composite</strong>s<br />
Fig. 8. Streaks on the fracture <strong>of</strong> a natural rubber.<br />
Whatever the <strong>loading</strong> ratio, at high magnification, a typical structure <strong>of</strong> the failure <strong>of</strong> rubber: some<br />
micro-tongues, which <strong>under</strong>went an irreversible deformation. Their size is <strong>of</strong> a few microns and they<br />
can be found on the entire specimen (see Figure 9).<br />
Finally, whatever ratio R studied, the reinforcement phenomenon due to crystallization <strong>of</strong> stretched<br />
chains does not directly influence the micro-structure <strong>of</strong> the fracture mechanisms. When the temperature<br />
increases, more tongues are formed and their shape gets better. But we cannot find any tongue in water<br />
or <strong>under</strong> nitrogen, mediums where there is no gaseous oxygen. As a consequence, these tongues are<br />
typical <strong>of</strong> chemical damaging due to gaseous oxygen <strong>of</strong> the amorphous rubber, with a possible more<br />
pronounced deterioration due to the increase <strong>of</strong> the temperature.<br />
Fig. 9. Typical tongue formation.<br />
The study <strong>of</strong> the damaging mechanisms <strong>of</strong> the cracking <strong>of</strong> natural rubber leads to the following<br />
conclusions:<br />
– a pre-strain <strong>under</strong> traction conditions improves the behavior <strong>under</strong> fatigue thanks to the<br />
crystallization <strong>of</strong> the stretched chains. However, switching to compression damages much more the<br />
material;<br />
– in addition to mechanical damaging, we have to consider a significant chemical damaging due to the<br />
oxygen in air and moreover, when the temperature increases, the oxidation reaction gets accelerated. It is<br />
then worth working <strong>under</strong> an inert atmosphere, like nitrogen, for any temperature. A non-cracking<br />
threshold when R = -1 did not exist in water and in air;<br />
323
324<br />
Fifth International Conference on <strong>Fatigue</strong> <strong>of</strong> Composites<br />
– finally, if the fractographic study does not allow us to totally link the micro-structure to the<br />
cracking mechanisms <strong>of</strong> this rubber, it still allows us to qualitatively observe the influence <strong>of</strong> the<br />
various factors related to damaging. We should note that the microscopic formation mechanism <strong>of</strong><br />
the tongues strongly depends on the gaseous oxygen and on the amorphous property <strong>of</strong> natural<br />
rubber.<br />
The natural rubber clearly shows the interdependence <strong>of</strong> the mechanisms <strong>of</strong> fatigue damaging <strong>of</strong> polymers:<br />
the mechanical stress, the chemical activity, the effect <strong>of</strong> the temperature and the architecture <strong>of</strong> the<br />
macro-molecules.<br />
3. Multi-axial fatigue <strong>of</strong> rubbers<br />
It is needless to say that the <strong>loading</strong>, usually occurring within pieces and structures made <strong>of</strong><br />
elastomers, is multi-directional. In the case <strong>of</strong> metals subjected to multi-axial fatigue, the stress tensor<br />
deviator is a convenient parameter to predict the fatigue life as the damaging <strong>of</strong> metals is mainly due to<br />
plastic deformation. The plasticity <strong>of</strong> metals depends on the dislocations sliding and this sliding depends<br />
on the shear stress due to the stress tensor deviator. This is why the equivalent Von Mises stress is<br />
successfully used to define the multi-axial fatigue life. Can we apply this approach to elastomers? The<br />
answer to this question is no as there is no plasticity in elastomers according to Friedel‟s dislocations<br />
theory.<br />
Fig. 10. Equipment allowing the study <strong>of</strong> the bi-axial fatigue <strong>of</strong> elastomers<br />
The fatigue damage mechanisms <strong>of</strong> rubbers are different from those within metals. Bathias and Le<br />
Gorju [5] previously showed that, within rubber, shear leads to quasi-cleavages which is obviously not<br />
the case in metals. They also showed that the stresses get more bi-axial and thus make ductility stronger,<br />
leading to some formation mechanisms <strong>of</strong> pseudo-dimples. Finally, they showed that due to a given<br />
hydrostatic tension, cavitations are formed on rubber. All these mechanisms operate <strong>under</strong> bi-axial<br />
fatigue. They are obviously different from the mechanisms we can observe within metals. In these<br />
conditions, Von Mises stress cannot correctly define the fatigue <strong>of</strong> rubbers. For the same reasons, we do<br />
not see why the prediction <strong>of</strong> multi-axial fatigue <strong>of</strong> rubbers could be established based on a single<br />
parameter.<br />
Nevertheless, it seems that the maximum principal stress usually rules damaging <strong>under</strong> bi-axial
fatigue conditions.<br />
C Bathias, S Y Dong. / <strong>Fatigue</strong> and Fracture <strong>of</strong> Elastomeric Matrix Nano<strong>composite</strong>s<br />
This is why, some recent publications do not focus on these fundamental data regarding the fatigue <strong>of</strong><br />
elastomers which cannot be presented by a single digital approach, and it‟s not enough.<br />
Figure 11 gives an example <strong>of</strong> a prediction <strong>of</strong> the life time <strong>of</strong> a natural rubber as a function <strong>of</strong> the<br />
principal stress for some traction-compression-torsion tests.<br />
4. Cavitation <strong>of</strong> rubbers<br />
Fig. 11. SN curve <strong>of</strong> a natural rubber <strong>under</strong> traction-traction conditions.<br />
Cavitation is a peculiar damaging phenomenon and specific to rubbers. When a cylindrical and<br />
axi-symmetrical specimen (planar deformation) is streched, some vacuoles get formed in its core, which<br />
grow and multiply with the elongation or with the number <strong>of</strong> cycles and progressively lead to the failure<br />
<strong>of</strong> the material. These cavities are not holes or bubbles. They are due to the formation <strong>of</strong> a strong<br />
tri-axial stress field within the material which leads to some spherical conformations <strong>of</strong> the<br />
macro-molecules, when the hydrostatic stress (average <strong>of</strong> the principal stresses) reaches a certain critical<br />
value.<br />
Contrainte principale max<br />
(MPa)<br />
The cavitation property cannot be given according to a critical elongation. However, a numerical<br />
calculation linked to a non-destructive control by tomography allowed us to show that the cavitation <strong>of</strong><br />
natural rubbers occurs around a hydrostatic pressure <strong>of</strong> 2 MPa for any <strong>loading</strong>. Within the SBR rubber,<br />
cavitation appears for a hydrostatic pressure <strong>of</strong> 7 to 8 MPa.<br />
Figure 11 presents the cavitation phenomenon.<br />
325
326<br />
5. Conclusion<br />
Fifth International Conference on <strong>Fatigue</strong> <strong>of</strong> Composites<br />
Fig. 12. <strong>Fatigue</strong> cavitation due to the hydrostatic pressure observed by SEM and by tomography.<br />
Rubber <strong>composite</strong>s, which have now been materials used in the mechanical industry for just fifty<br />
years, are much less known than metals due to fatigue damaging. They do not react in the same way to<br />
stresses. Increasing the average stress <strong>of</strong> a cyclic <strong>loading</strong> applied to a natural rubber comes to increasing<br />
its fatigue life. This is at the opposite <strong>of</strong> what occurs in a metal! This paper intended to show that neither<br />
the Von Mises stress, nor Griffith dissipated energy bring any satisfying solutions to entirely predict the<br />
initiation and propagation <strong>of</strong> fatigue cracks within these rubber nano<strong>composite</strong>s.<br />
References<br />
[1] R.S. Rivlin, A.G. Thomas, “Rupture <strong>of</strong> Rubber”, J. Polymer Sci. 10, 291, 1953<br />
[2] C.J. Lake, “Aspects <strong>of</strong> <strong>Fatigue</strong> and Fracture <strong>of</strong> Rubbers”, Prog. Rubber Technol 45, 89, 1983<br />
[3] M.J. Lindley, “Energy for Crack Growth in Model Rubber Components”, Strain Anal 7, 132, 1972<br />
[4] A.N. Gent, Engineering with Rubber, Hanser Publishers, New York, 1992<br />
[5] A. Stevenson, “<strong>Fatigue</strong> Crack Growth in High Load Capacity Laminates”, Int. J. Fracture 23, 47, 1983<br />
[6] C. Bathias, K. Le Gorju, “<strong>Fatigue</strong> Initiation and Propagation in Natural and Synthetic Rubbers”, International Journal <strong>of</strong> <strong>Fatigue</strong> 24, 85-92,<br />
2002
Correlation between crack propagation rate and cure process <strong>of</strong><br />
epoxy resins<br />
Abstract<br />
V Trappe *, S Günzel<br />
Federal Institute for Materials Research and Testing, BAM-V.64, Unter den Eichen 87, D-12205 Berlin, Germany<br />
Fracture mechanics approaches are increasingly applied for the characterization <strong>of</strong> epoxy resins‟ and adhesives‟<br />
mechanical properties. Therefore, the fracture toughness and crack resistance <strong>under</strong> static load [1] <strong>of</strong>ten is regarded as<br />
state <strong>of</strong> the art to figure out material improvements. However, experimental investigations on the fatigue <strong>behaviour</strong>, thus<br />
the crack propagation according to [2], seem to be much more sensitive to characterize the materials for in service<br />
<strong>loading</strong> conditions. At first an efficient testing concept was developed at BAM V.64. Therefore the geometry for a<br />
modified single edge notched tensile specimen (SENT) was developed in order to assure an appropriate resolution in<br />
measuring the crack length via a CCD-camera [3]. In the next step the influence <strong>of</strong> the cure temperature on the<br />
fracture-mechanical properties was investigated.<br />
Keywords: Fracture toughness; crack resistance; fracture mechanics; plastics; crack propagation<br />
1. Introduction<br />
Fibre reinforced plastics are increasingly used for lightweight constructions such as aircrafts and<br />
wind energy applications. The requirement is to manufacture the resins within a wide temperature range<br />
(20-200°C) and to impregnate fabrics and inlays in different manufacturing methods (prepreg, resin<br />
injection, hand lay-up). Furthermore, the health tolerance, thus the industrial safety, gains more<br />
importance. This requires an advancement <strong>of</strong> resin systems in a continuous manner, while<br />
simultaneously keeping a high standard <strong>of</strong> mechanical <strong>behaviour</strong> in <strong>composite</strong>s. Within the framework<br />
<strong>of</strong> different research series at BAM, working group V.64, it could be determined that an optimization <strong>of</strong><br />
the fracture toughness and crack resistance does not necessarily lead to an improved fatigue resistance.<br />
In general, the specimens developed for crack propagation investigation <strong>of</strong> metals are insufficient for<br />
epoxy resins and adhesives. However, with a modified SENT-specimen, which was developed at BAM,<br />
it is possible to efficiently perform crack growth and to characterize plastics‟ fatigue <strong>behaviour</strong> with<br />
cohesive fracture. The methods and the results will be discussed in the presentation.<br />
2. Experimental<br />
Some plastics, especially epoxy resins are very brittle compared to metallic materials. This results in<br />
a 10 to 100 times smaller fracture toughness. Additionally, the crack growth rate at the threshold value<br />
* Corresponding author. tel.: ++49 30 8104 3386<br />
E-mail address: volker.trappe@bam.de
328<br />
Fifth International Conference on <strong>Fatigue</strong> <strong>of</strong> Composites<br />
<strong>of</strong> crack propagation could be small at about 10E-6 mm/cycle. Furthermore the Paris-line increases<br />
strongly and hence it is very difficult to measure the range <strong>of</strong> stable crack propagation for this class <strong>of</strong><br />
materials. A reasonable number <strong>of</strong> specimens for crack propagation measurements for metallic materials<br />
are well known (Fig 1). However, in [2] only the compact tension (CT) and single edge notched bending<br />
(SENB) specimen are recommended in this standard. In Fig. 1 the normalized geometry calibration<br />
factors for several common types <strong>of</strong> specimens are compared. Hence, for a brittle epoxy resin the range<br />
<strong>of</strong> stable crack propagation is only 30% more than the stress intensity <strong>of</strong> the pre crack length.<br />
Comparatively, for a metallic material the stress intensity could be enhanced over a range <strong>of</strong><br />
approximately 250% until instable crack propagation occurs. Thus according to [2], <strong>under</strong> cyclic<br />
<strong>loading</strong> with a constant load amplitude, the recordable crack growth <strong>of</strong> a SENB specimen is only 7% <strong>of</strong><br />
the width W in an epoxy resin compared to 20% <strong>of</strong> W for a double edge notched specimen (DEN) and<br />
hence 3 times higher. For metallic materials, even for the SENB specimen, the recordable crack length<br />
is more than 20% and consequently, it is not problematic to measure the crack propagation with an<br />
appropriate resolution. A modified short SET specimen in a fixed clamping set up was chosen (Fig 1)<br />
because the recordable crack growth length is nearly the same and the preparation <strong>of</strong> only one pre crack<br />
with a razor blade is much easier. At constant load amplitude and a load ratio <strong>of</strong> R=0, 1 da/dN over ΔK<br />
experiments were performed in a servohydraulic tensile testing machine INSTRON 8800. Each 1000<br />
cycles the crack length was measured automatically by a CCD-camera with a resolution <strong>of</strong> at least<br />
W/2000 hence 25μm at the modified SET-specimen (thickness 6mm).<br />
3. Results<br />
Fig. 1. geometry calibration factors <strong>of</strong> different specimens.<br />
A pure epoxy resin was cured at the two different temperatures 50°C and 60°C over 15 hours and the<br />
crack propagation was measured in these two states. Beside the measured values, the range <strong>of</strong> stable<br />
crack growth according to Paris [5]
V Trappe, S Günzel / Correlation between crack propagation rate and cure process <strong>of</strong> epoxy resins<br />
( ) m<br />
da = C K<br />
(1)<br />
dN<br />
C and m are material constants, is plotted as a straight line. The values <strong>of</strong> fracture toughness are stated<br />
in Fig. 2 according to [1]. Even when the fracture toughness <strong>of</strong> the two different curing states is nearly<br />
the same, the crack propagation rate <strong>of</strong> the higher cured material is 10 times lower than the other one as<br />
shown in Fig. 2 and hence the number <strong>of</strong> load cycles to failure is 10 times higher.<br />
4. Conclusion<br />
Fig. 2. crack propagation rate and cure process<br />
Focussing on the in service life <strong>of</strong> plastics and adhesives regarding the cohesive failure, crack<br />
propagation measurements are much more sensitive for evaluation <strong>of</strong> materials improvements than<br />
fracture toughness tests. However, performing crack propagation experiments at brittle epoxy resins<br />
with constant load amplitudes according to [2] is very difficult, hence the recordable crack growth is<br />
very small. Therefore, a modified single edge notched tensile specimen has been developed, which<br />
enables a 3 times higher stable crack length <strong>under</strong> cyclic <strong>loading</strong>. Hence, the crack growth could be<br />
recorded with good resolution online, automatically implemented in the fatigue test simply by a<br />
CCD-camera. A strong correlation between crack-growth rate in the pure matrix material and the fatigue<br />
<strong>behaviour</strong> <strong>of</strong> a glass-fibre and carbon-fibre <strong>composite</strong> are assumed. First tests seem to be promising.<br />
Reference<br />
[1] ISO 13586:2000: Plastics – Determination <strong>of</strong> fracture toughness – Linear elastic fracture mechanics approach<br />
[2] ISO 15850:2002: Plastics – Determination <strong>of</strong> tension-tension fatigue crack propagation - Linear elastic fracture mechanics approach<br />
[3] Günzel, S., Trappe, V.: Ermittlung bruchmechanischer Kennwerte an Epoxid-Harzen, Werkst<strong>of</strong>fprüfung - Berlin 2008, DVM report 642, p.<br />
295-300, ISBN 978-3-00-026399-6<br />
[4] ASTM E647-00: Standard Test Method for Measurement <strong>of</strong> <strong>Fatigue</strong> Crack Growth Rates<br />
[5] Gross D.: Bruchmechanik – Mit einer Einführung in die Mikromechanik; Berlin [u.a.], Springer-Verlag, 2007<br />
329
330<br />
Fifth International Conference on <strong>Fatigue</strong> <strong>of</strong> Composites<br />
[6] Heckel K.: Einführung in die technische Anwendung der Bruchmechanik; München, Wien; Hanser Verlag, 1983<br />
[7] Haibach E.: Betriebsfestigkeit – Verfahren und Daten zur Bauteilberechnung; Berlin [u.a.], Springer Verlag, 2006
Thermal fatigue <strong>of</strong> AX41 magnesium alloy based <strong>composite</strong><br />
studied using thermal expansivity measurements<br />
Abstract<br />
Z Drozd *, Z Trojanová, P Lukáč<br />
Faculty <strong>of</strong> Mathematics and Physics, Charles University, Prague, Ke Karlovu 5, CZ-121 16 Praha 2, Czech Republic<br />
Magnesium alloy AX41 (Mg-4Al-1Ca in wt. %) reinforced with 15 vol% <strong>of</strong> short Saffil fibres was used in this study.<br />
Thermal expansion was measured over a wide temperature range from 25 up to 400 o C in four runs. The thermal<br />
expansion coefficient was estimated during heating and cooling. The Young‟s modulus <strong>of</strong> the <strong>composite</strong> was estimated by<br />
the measurements <strong>of</strong> the resonant frequency <strong>of</strong> the free vibrations <strong>of</strong> the sample. Samples for these measurements were<br />
thermally cycled between room temperature and an increasing upper temperature <strong>of</strong> the thermal cycle. The modulus<br />
defect estimated from the difference between the resonant frequency before the thermal cycling and after cycling was<br />
compared with the relative change <strong>of</strong> the thermal expansion coefficient. Similar course <strong>of</strong> the temperature dependence <strong>of</strong><br />
both quantities indicates that the deviation from the linearity has the common reason: thermal stresses and increased<br />
dislocation density.<br />
1. Introduction<br />
Light alloys reinforced with short fibres or particles have unique and desirable thermal and<br />
mechanical properties [1]. When compared with monolithic metals and alloys, metal matrix <strong>composite</strong>s<br />
(MMCs) have higher strength, Young‟s modulus, wear resistance, fatigue resistance, and lower thermal<br />
expansion [2]. Investigations <strong>of</strong> mechanical and physical properties <strong>of</strong> light metals <strong>composite</strong>s (among<br />
them magnesium alloys based <strong>composite</strong>s) are important not only for applications but also for better<br />
<strong>under</strong>standing <strong>of</strong> the processes responsible for their <strong>behaviour</strong>. An attractive attribute <strong>of</strong> MMCs is the<br />
ability to tailor the thermal conductivity and the coefficient <strong>of</strong> thermal expansion (CTE). This can be<br />
achieved by careful control <strong>of</strong> the low expansion: reinforcement volume percent, particle size, and<br />
particle packing characteristics [3-5].<br />
It is known that in <strong>composite</strong>s, there is a large difference in the coefficients <strong>of</strong> thermal expansion<br />
between the matrix and the ceramic reinforcement. When a metal matrix <strong>composite</strong> is cooled from a<br />
higher temperature to room temperature, misfit strains occur because <strong>of</strong> different thermal contraction at<br />
the interfaces. These strains induce thermal stresses that may be higher than the yield stress <strong>of</strong> the<br />
matrix. Therefore, the thermal stresses may be sufficient to generate new dislocations at the interfaces<br />
between the matrix and the reinforcement. Accordingly, after cooling the <strong>composite</strong>, the dislocation<br />
density in the matrix is higher than in unreinforced matrix. An increase in the density <strong>of</strong> newly created<br />
dislocations near reinforcement fibres has been calculated as [6, 7]<br />
* Corresponding author. Tel.: +221912410; Fax: 221 912 406.<br />
E-mail address: drozd@mff.cuni.cz
332<br />
Fifth International Conference on <strong>Fatigue</strong> <strong>of</strong> Composites<br />
B f cT =<br />
b(1 - f ) t<br />
where f is the volume fraction <strong>of</strong> the reinforcement, t is its minimum size, b is the magnitude <strong>of</strong> the<br />
Burgers vector <strong>of</strong> dislocations, B is a geometrical constant, Δαc = αf – αm is the difference in the CTEs <strong>of</strong><br />
the reinforcement and the matrix, and ΔT is the temperature change.<br />
The yield stress <strong>of</strong> MMC decreases with increasing temperature. At a certain temperature, the values<br />
<strong>of</strong> thermal stresses at the interfaces may exceed the yield stress <strong>of</strong> the matrix, and plastic flow can occur.<br />
A permanent elongation as well as contraction <strong>of</strong> the sample length during thermal exposition was<br />
observed by several authors [8-11]. The sample exhibited a residual contraction (or elongation) upon<br />
cooling to room temperature, while the temperature dependence <strong>of</strong> the thermal expansion coefficient<br />
was measured. The value <strong>of</strong> the observed permanent (residual) change <strong>of</strong> the sample length after the<br />
measurement <strong>of</strong> thermal expansion depends on the matrix, volume fraction <strong>of</strong> reinforcement, and the<br />
maximum temperature <strong>of</strong> the thermal cycle. The thermal expansion <strong>behaviour</strong> may be characterised by<br />
the temperature dependence <strong>of</strong> the thermal strain parameter (L/L0)th defined by the following equation<br />
[12]:<br />
L L L<br />
<br />
= - <br />
L L L <br />
0 th 0 exp 0 rm<br />
where (L/L0)exp is the measured strain <strong>of</strong> the <strong>composite</strong> sample, (L/L0)rm is the strain the <strong>composite</strong><br />
sample calculated by the rule <strong>of</strong> mixtures and L0 is the original length <strong>of</strong> the sample. The rule <strong>of</strong><br />
mixtures is a function <strong>of</strong> the volume fraction <strong>of</strong> the reinforcement and the strain <strong>of</strong> the matrix and the<br />
reinforcement. Parameter (L/L0)th represents the departure <strong>of</strong> the <strong>composite</strong> <strong>behaviour</strong> from the case<br />
where no thermal stresses are present. It should be note that (L/L0)exp is determined by dilatometer in<br />
the axial direction <strong>of</strong> the sample.<br />
2. Experimental<br />
A commercial magnesium alloy AX41 (4wt%Al, 1wt%Ca, balance Mg) was used as the matrix. The<br />
alloy was reinforced with -Al2O3 short fibres (Saffil ® ). The <strong>composite</strong> was prepared by squeeze casting.<br />
The preform consisting <strong>of</strong> Al2O3 short fibres showing a planar isotropic fibre distribution and a binder<br />
system (containing Al2O3 and starch) was preheated to a temperature higher than the melt temperature<br />
<strong>of</strong> the alloy and then inserted into a preheated die. The two-stage application <strong>of</strong> the pressure resulted in<br />
MMCs with a fibre volume fraction <strong>of</strong> approximately 15 vol.% . The mean diameter <strong>of</strong> fibres was 3 μm<br />
and their length 78 μm (measured after squeeze casting).<br />
Cylindrical samples for the thermal expansion measurements had a length <strong>of</strong> 50 mm and a diameter<br />
<strong>of</strong> 6 mm. The planes <strong>of</strong> planar randomly distribute fibres were parallel to the longitudinal axis <strong>of</strong> the<br />
samples. Figure 1 shows the microstructure (light micrograph) <strong>of</strong> as prepared <strong>composite</strong> taken from the<br />
fibres plane. The linear thermal expansion <strong>of</strong> the <strong>composite</strong> samples was measured in an argon<br />
atmosphere, using the Netzsch 410 dilatometer, over a temperature range from room temperature to 400<br />
o C for heating and cooling rates <strong>of</strong> 2 K/min. The accuracy <strong>of</strong> the apparatus was controlled by measuring<br />
(1)<br />
(2)
Z Drozd, etc. / Thermal fatigue <strong>of</strong> AX41 magnesium alloy based <strong>composite</strong> studied using thermal expansivity measurements<br />
<strong>of</strong> the coefficient <strong>of</strong> thermal expansion <strong>of</strong> pure Mg and comparing it with the literature data. The<br />
agreement between measured and tabled data was in the range ±1%. The thermal expansion curves <strong>of</strong><br />
<strong>composite</strong>s were measured with four thermal (heating and cooling) cycles (runs). The results obtained in<br />
the third and fourth thermal cycles were practically the same as those in the second cycle. The relative<br />
changes in the thermal expansion coefficient /=((T)-(25 o C)/(25 o C) were calculated.<br />
Fig. 1. Microstructure <strong>of</strong> the sample <strong>of</strong> the investigated material.<br />
The Young‟s modulus E was estimated after each thermal cycle by measurement <strong>of</strong> the resonant<br />
frequency <strong>of</strong> free vibration <strong>of</strong> the sample at ambient temperature [13]. Thermal cycles between room<br />
temperature and an increasing upper temperature were performed step by step up to 430 o C. The<br />
temperature step was 20 o C and duration <strong>of</strong> the sample at each temperature 15 minutes. The modulus<br />
defect E/E =(E-E0)/E0 (where E0 is the modulus value without thermal treatment) was estimated.<br />
3. Results<br />
Figure 2 shows the temperature dependences <strong>of</strong> the thermal strain obtained during the four thermal<br />
cycles. From the figure it is seen that the curves obtained in the second, third and fours rune are<br />
practically the same. Also the estimated difference between the heating and cooling part <strong>of</strong> the<br />
dependence is in the second and following cycles smaller. The temperature dependences <strong>of</strong> the CTE for<br />
heating, measured for four thermal cycles, are shown in Fig. 3. The addition <strong>of</strong> Saffil fibres decreases<br />
the CTE from 25x10 -6 K -1 estimated for the alloy to 20x10 -6 K -1 for the <strong>composite</strong> at room temperature.<br />
Further thermal cycling led to the additional decrease <strong>of</strong> the CTE to approximately value <strong>of</strong> 16x10 -6 K -1 .<br />
The dilatation characteristics are also influenced by the residual strain, which is connected with a<br />
permanent change <strong>of</strong> the sample length. The temperature dependence <strong>of</strong> the residual strain was obtained<br />
by subtracting the relative elongation obtained in the first run and the relative elongation in the second<br />
thermal cycle. It is introduced in Fig. 4. The permanent changes in the sample length (residual<br />
contraction) measured after individual thermal cycles are shown in Fig. 5.<br />
333
334<br />
relative elongation (10 -4 )<br />
100<br />
80<br />
60<br />
40<br />
20<br />
-20<br />
Fifth International Conference on <strong>Fatigue</strong> <strong>of</strong> Composites<br />
0<br />
runs 2 - 4<br />
0 100 200 300 400 500<br />
T (°C )<br />
run 1<br />
Fig. 2. Temperature dependence <strong>of</strong> the thermal strain for the first and second run.<br />
CTE (10 -6 K -1 )<br />
30<br />
25<br />
20<br />
15<br />
10<br />
5<br />
0<br />
runs 2-4<br />
run 1<br />
0 100 200 300 400 500<br />
temperature (°C)<br />
Fig. 3. Temperature dependence <strong>of</strong> the CTE <strong>of</strong> the <strong>composite</strong> <strong>under</strong> heating.<br />
residual strain (10 -4 )<br />
2<br />
0<br />
-2<br />
-4<br />
-6<br />
-8<br />
-10<br />
-12<br />
0 100 200 300 400 500<br />
temperature (°C)<br />
Fig. 4. Temperature dependence <strong>of</strong> the residual strain <strong>of</strong> the investigated <strong>composite</strong>.
4. Discussion<br />
Z Drozd, etc. / Thermal fatigue <strong>of</strong> AX41 magnesium alloy based <strong>composite</strong> studied using thermal expansivity measurements<br />
residual elongation (m)<br />
0<br />
-20<br />
-40<br />
-60<br />
1 2 3 4<br />
number <strong>of</strong> thermal cycles<br />
Fig. 5. Residual elongations after individual thermal cycles.<br />
Using the Grüneisen theory <strong>of</strong> thermal expansivity [14], it follows (Cp – Cv) = ( 2 TV0)/K, and from<br />
isotropic elasticity, K = 3(1 - 2)/E. Hence, the following relationship between the thermal expansion<br />
coefficient and the Young‟s modulus can be written:<br />
( Cp -Cv) 3( 1-2) 2<br />
= (3)<br />
TV E<br />
here Cp and Cv are the specific heats at constant pressure and volume, V 0 the molar volume, K the<br />
compressibility modulus and the Poisson ratio. Considering that the term (Cp – Cv) 3 (1.-.2)/V0) is at<br />
a certain temperature T constant, the relationship between the modulus defect and relative change <strong>of</strong> the<br />
thermal expansion coefficient:<br />
0<br />
1E =- (4)<br />
2 E<br />
The modulus defect E/E (=(E-E0)/E0, where E0 is the modulus value without thermal treatment, is<br />
given by the following equation<br />
2<br />
- E / E=<br />
<br />
<br />
(5)<br />
where is a constant, is the dislocation density and the length <strong>of</strong> dislocation segments between weak<br />
pinning points (solute atoms, point defects).<br />
The temperature dependences <strong>of</strong> the / and the modulus defect E/E are given in Fig. 6. Note, that<br />
the modulus defect is plotted against the upper temperature <strong>of</strong> the thermal cycle. It can be seen that both<br />
dependences exhibit a maximum at a temperature <strong>of</strong> 310 o C.<br />
Temperature changes during the thermal cycle invoke thermal stresses in the matrix which may reach<br />
its yield stress and generate new dislocations in plastic zones. The radius <strong>of</strong> the plastic zone is given by<br />
the following approximate relationship [15]<br />
335
336<br />
Fifth International Conference on <strong>Fatigue</strong> <strong>of</strong> Composites<br />
4<br />
E <br />
M<br />
rplz = rf . T<br />
(5-4 ) y <br />
where EM is Young's modulus <strong>of</strong> the matrix, is Poisson constant, y the yield stress in the matrix and rf<br />
is the radius <strong>of</strong> fibres. Similarly, it is possible to express the volume fraction <strong>of</strong> the plastically deformed<br />
matrix [16]<br />
/<br />
0.12<br />
0.08<br />
0.04<br />
0.00<br />
-0.04<br />
4E<br />
fplz = f M<br />
<br />
<br />
( 5- 4)<br />
<br />
E/E<br />
/<br />
y<br />
temperature (°C)<br />
1/2<br />
<br />
. T<br />
-1<br />
<br />
run 1<br />
0 100 200 300 400 500<br />
Fig. 6. Temperature dependencies <strong>of</strong> the relative changes <strong>of</strong> the thermal expansion coefficient and the E-modulus defect.<br />
where f is volume fraction <strong>of</strong> the reinforcing phase. Fresh dislocations in plastic zones, produced by<br />
different expansion <strong>behaviour</strong> <strong>of</strong> the matrix and the reinforcements due to temperature changes, are only<br />
slightly pinned and contribute substantially to modulus defect [15]. Plastification <strong>of</strong> the matrix is due to<br />
newly created dislocations. An increase in the dislocation density near reinforcement can be calculated<br />
according the equation (1). Considering that the number <strong>of</strong> pinning points is constant, the effective<br />
length <strong>of</strong> dislocation segments increases with increasing dislocation density. The similar situation can be<br />
considered in the sample thermally cycled in the dilatometer. Although the thermal expansion<br />
coefficient was determined on the specimen heated in the dilatometer, the increase <strong>of</strong> the dislocations<br />
density may be considered due to thermal stresses generated in the matrix. It is suggested that, in<br />
addition to the regular lattice temperature expansion, the extension <strong>of</strong> mobile dislocation loops, which<br />
are a result <strong>of</strong> the accommodation <strong>of</strong> the thermal stresses, causes localized increases in volume and an<br />
increase in the apparent expansion coefficient. An increasing tendency <strong>of</strong> the modulus and CTE defects<br />
stopped at a temperature <strong>of</strong> 310 o C. Thermal <strong>loading</strong> up to higher temperatures decreases the both<br />
defects. The radius <strong>of</strong> the plastic zones in the vicinity <strong>of</strong> fibres was estimated according to relationship<br />
(5) to be about 11 m. The volume fraction <strong>of</strong> plastic zones exhibits after thermal treatment at 310 o C<br />
about 82% <strong>of</strong> the matrix volume (substituting into relationship (6) for =20x10 -6 K -1 , rf=3 m, EM=45<br />
GPa, =0.35, y=45 MPa [17]). The plastic zones in the matrix may overlap and dislocations may<br />
annihilate. Thermal stresses in the AX41 alloy matrix which are originally tensile convert to<br />
compression ones [11]. Dislocations moving <strong>under</strong> arising compression stresses in the inverse direction<br />
-2E/E<br />
(6)<br />
(7)
Z Drozd, etc. / Thermal fatigue <strong>of</strong> AX41 magnesium alloy based <strong>composite</strong> studied using thermal expansivity measurements<br />
interact with dislocations <strong>of</strong> opposite sign and may annihilate. Relatively high maximum strain<br />
amplitude renders possible movement <strong>of</strong> free dislocation segments in the slip plane. Solute atoms and<br />
their small clusters are obstacles for the dislocation motion. After <strong>loading</strong> at higher temperatures,<br />
increasing concentration <strong>of</strong> vacancies interacts with dislocations producing jogs on the dislocation lines.<br />
Thermally activated motion <strong>of</strong> dislocation segments is restricted and the both defects decrease. A<br />
deviation from the temperature dependence <strong>of</strong> the CTE is observed. Values <strong>of</strong> the CTE decrease with<br />
temperature above about 310 o C (Fig. 3). The yield stress <strong>of</strong> the matrix decreases with increasing<br />
temperature. The internal stress state in the matrix is tensile. It is decreasing during heating and the state<br />
becomes compressive at some temperature. At a certain temperature plastic deformation in the matrix<br />
occurs. This deformation induces changes in the internal stress, which modify the elastic properties in<br />
the matrix. The specimen length is reduced <strong>under</strong> compression stresses. This leads to a decrease in the<br />
CTE, which is observed. Thus, decreasing dislocation density reduces the additional thermal expansion<br />
coefficient.<br />
5. Conclusion<br />
Magnesium alloy AX41 reinforced with short Saffil fibres was prepared by the squeeze casting<br />
technology using a perform. The thermal expansion was measured over a wide temperature range from<br />
ambient temperature up to 400 o C in four runs. The addition <strong>of</strong> Saffil fibres decreases the thermal<br />
expansion coefficient. This decrease is the maximum in the first run; in the second and other runs the<br />
value <strong>of</strong> the CTE is practically the same. The permanent contraction <strong>of</strong> the sample was observed after<br />
each thermal cycle. Observed value <strong>of</strong> this contraction decreases with increasing number <strong>of</strong> thermal<br />
cycles. The <strong>composite</strong> was thermally cycled between room temperature and increasing upper<br />
temperature <strong>of</strong> the thermal cycle up to 430 o C. After each thermal cycle the resonant frequency <strong>of</strong> the<br />
free vibrations <strong>of</strong> the sample was measured. The modulus defect E/E (calculated from the resonant<br />
frequency) and the relative change <strong>of</strong> the CTE / exhibit the similar temperature dependence with a<br />
local maximum at 310 o C. Considering formation <strong>of</strong> plastic zones as a consequence <strong>of</strong> thermal stresses<br />
invoked in the matrix, newly created dislocations are the reason for the observed changes. Thermal<br />
<strong>loading</strong> at temperatures higher than 310 o C yields a new situation: Thermal internal stresses generated at<br />
temperatures higher than 310 o C are high enough to invoke motion <strong>of</strong> new dislocations. Thermal cycling<br />
at temperatures higher than 310 o C causes movement and annihilation <strong>of</strong> new dislocations in the matrix,<br />
<strong>under</strong> appearing compressive internal stresses, which leads to a decrease <strong>of</strong> the / and the absolute<br />
value <strong>of</strong> the modulus defect.<br />
Acknowledgements<br />
This work is a part <strong>of</strong> the research plan MSM 1M2560471601 "Eco-center for Applied Research <strong>of</strong><br />
Non-ferrous Metals" that is financed by the Ministry <strong>of</strong> Education, Youth and Sports <strong>of</strong> the Czech<br />
Republic. This work was also supported by the Grant Agency <strong>of</strong> the Academy <strong>of</strong> Sciences <strong>of</strong> the Czech<br />
Republic <strong>under</strong> Grant IAA201120902.<br />
337
338<br />
References<br />
Fifth International Conference on <strong>Fatigue</strong> <strong>of</strong> Composites<br />
[1] N. Chawla, K.K. Chawla, Metal Matrix Composites, Springer, New York, 2006.<br />
[2] K. Weinert, M. Lange, M. Schoer, Magnesium Alloys and Their Applications. (Ed. K.U. Kainer), DGM, Willey-VCH, Weinheim (2000)<br />
412.<br />
[3] N. Chawla, X. Deng, D.R.M. Schnell: Mater. Sci. Eng. A 426 (2006) 314–322.<br />
[4] A. Rudajevová, P. Lukáč, The influence <strong>of</strong> interfacial chemical reactions on the residual and thermal strain in reinforced magnesium alloys<br />
Kovove Mater. 46 (2008) 145-150.<br />
[5] Y.D. Huang, N. Hort, H. Dieringa, K.U. Kainer, Analysis <strong>of</strong> instantaneous thermal expansion coefficient curve during thermal cycling in<br />
short fiber reinforced AlSi12CuMgNi <strong>composite</strong>s, Compos. Sci. Technol. 65 (2005) 137–147.<br />
[6] R.J. Arsenault, N. Shi, Dislocations generation due to differences between the coefficients <strong>of</strong> thermal expansion, Mater. Sci. Eng., 81<br />
(1986) 151-187.<br />
[7] D.C. Dunand, A. Mortensen, On plastic relaxation <strong>of</strong> thermal stresses in reinforced metals Acta Metall. Mater. 39 (1991) 127-139.<br />
[8] R. U. Vadyia, K.K. Chawla, Thermal expansion <strong>of</strong> metal-matrix <strong>composite</strong>s, Comp. Sci. Technol. 50 (1994) 13-22.<br />
[9] Z. Trojanová, P. Lukáč, F. Chmelík, W. Riehemann, Microstructural changes in ZE41 <strong>composite</strong> estimated by acoustic measurements. J.<br />
Alloys Compd. 355 (2003) 113-119.<br />
[10] Z. Trojanová, F. Chmelík, P. Lukáč, A. Rudajevová, Changes in the microstructure <strong>of</strong> QE22 <strong>composite</strong>s estimated by non-destructive<br />
methods, J. Alloys Comp. 339 (2002) 327-334.<br />
[11] P. Lukáč, Z. Trojanová, F. Chmelík, A. Rudajevová, Changes in the microstructure <strong>of</strong> magnesium <strong>composite</strong>s estimated by<br />
non-destructive methods. Int. J. Mater. Product Techn. 18 (2003) 57-69.<br />
[12] A. Rudajevová, J. Balík, P. Lukáč, Thermal expansion <strong>behaviour</strong> <strong>of</strong> Mg–Saffil fibre <strong>composite</strong>s, Mater. Sci. Eng. A 387-389 (2004)<br />
892-895.<br />
[13] J. Göken, W. Riehemann, Dependence <strong>of</strong> internal friction <strong>of</strong> fibre-reinforced and unreinforced AZ91 on heat treatment, Mater. Sci. Eng. A<br />
324 (2002) 127-133.<br />
[14] M. J. Hordon,: B. S. Lementy, B. L. Averbach, Influence <strong>of</strong> plastic deformation on expansivity anelastic modulus <strong>of</strong> aluminium, Acta<br />
Metall. 6 (1958) 446-458.<br />
[15] E. Carreño-Morelli, Interface stress relaxation in metal matrix <strong>composite</strong>s, in Mechanical Spectroscopy Q-1 2001, R. Schaller, G. Fantozzi<br />
and G. Gremaud, Eds., Materials Science Forum, vol. 366-368 (2001) 570-580.<br />
[16] E. Carreño-Morelli, S.E. Urreta, R. Schaller, Mechanical spectroscopy <strong>of</strong> thermal stress relaxation at metal–ceramic interfaces in<br />
Aluminium-based <strong>composite</strong>s, Acta Mater. 48 (2000) 4725-4733.<br />
[17] Z. Trojanová, P. Lukáč, Physical aspects <strong>of</strong> plastic deformation in Mg-Al alloys with Sr and Ca, Inter. J. <strong>of</strong> Mater. Research 100 (2009)<br />
270-276.
Abstract<br />
<strong>Fatigue</strong> <strong>behaviour</strong> <strong>of</strong> woven <strong>composite</strong> joint<br />
J Y Zhang a, *, Y Fu a , L B Zhao b , X Z Liang c , H Huang b , B J Fei a<br />
a Institute <strong>of</strong> Solid Mechanics, Beihang University (BUAA), Beijing 100191, PR China<br />
b Schools <strong>of</strong> Astronautics, Beihang University (BUAA), Beijing, 100191, PR China<br />
c Beijing Aeronautical Manufacturing Technology Research Institute, Beijing, 100024, PR China<br />
<strong>Fatigue</strong> <strong>behaviour</strong> <strong>of</strong> a particular woven <strong>composite</strong> adhesive bonded joint subjected to tensile-tensile cycle <strong>loading</strong> is<br />
researched. Tests were conducted <strong>under</strong> fatigue and monotonic <strong>loading</strong>s in order to research the durability <strong>of</strong> such bonded<br />
joints. A careful observation <strong>of</strong> cracking mechanisms during fatigue life showed that filler and tip zone is the potential<br />
weakness in the joints. The experimental outcomes expatiated that the endurance limit <strong>loading</strong>, lower than the initial<br />
damage <strong>loading</strong>, is about half <strong>of</strong> the ultimate static strength. The results also showed that fatigue lifetime <strong>of</strong> <strong>composite</strong> <br />
joint comprised <strong>of</strong> two stages: initiation stage, which is less than 25% <strong>of</strong> the fatigue lifetime, and the propagation stage<br />
for the rest up to failure. Four stiffness degradation modes, named stable slight reduction mode, abruptly decreasing mode,<br />
step decrease mode and constant stiffness mode, exhibited in fatigue test.<br />
Keywords: Composite structures; Adhesive joints; High cycle fatigue; S-N curves; Tensile <strong>loading</strong><br />
1. Introduction<br />
Weight and production cost reductions are important goals for aircraft structural researchers and<br />
engineers. Integrated <strong>composite</strong> structure design concept, which enable reduction in fastener and part<br />
counts and lead to remarkable decrease <strong>of</strong> assemble cost and structural weight, provide an available way<br />
to realize these goals[1]. An all-<strong>composite</strong> π joint, presented in CAI projects <strong>of</strong> NASA [1, 2], is an<br />
effective structural connector to realize integrated <strong>composite</strong> structures and thus a key technique [1, 2].<br />
However, π joints belong to the category <strong>of</strong> out-<strong>of</strong>-plane joints, which are potential weakness to transmit<br />
tensile, bending and shear load between different parts <strong>of</strong> the airplane [3]. Obviously, a deeply<br />
<strong>under</strong>standing on fatigue <strong>behaviour</strong> <strong>of</strong> <strong>composite</strong> π joints is significant for the safety <strong>of</strong> integrated<br />
<strong>composite</strong> structures.<br />
Nowadays there are relative little literatures concerning on the fatigue <strong>behaviour</strong> <strong>of</strong> out-<strong>of</strong>-plane<br />
joints. Based on the research work on static <strong>behaviour</strong> <strong>of</strong> tee joint [3-5], Shenoi et al. [6-10] took the<br />
lead in exploring fatigue <strong>behaviour</strong> <strong>of</strong> tee joint and top hat joint at the end <strong>of</strong> 20th century. Firstly Read<br />
and Shenoi [6] briefly reviewed investigations on fatigue <strong>behaviour</strong> <strong>of</strong> FRP laminates and summarized<br />
various theories to model damage accumulation. Then Phillips et al. [7, 8] applied damage mechanics to<br />
predict fatigue life <strong>of</strong> structural components such as tee connection and top hat stiffener. Shenoi and<br />
Read [9, 10] provided deep <strong>under</strong>standing on the high cycle fatigue <strong>behaviour</strong> <strong>of</strong> a particular single skin<br />
* Corresponding author.<br />
E-mail address: jyzhang@buaa.edu.cn
340<br />
Fifth International Conference on <strong>Fatigue</strong> <strong>of</strong> Composites<br />
tee joint made <strong>of</strong> FRP. Stiffness degradation, residual strength and energy dissipation characteristics<br />
obtained from a comprehensive series <strong>of</strong> tests, covering joints with varying material and geometry<br />
configurations are detailed discussed. Furthermore, a design methodology encompassing fatigue<br />
considerations is proposed. Recently, a <strong>composite</strong> adhesive tee joint was tested <strong>under</strong> fatigue and<br />
monotonic <strong>loading</strong>s by Marcadon [11] in order to study its durability. Careful observations on cracking<br />
propagation during fatigue life showed that fatigue mechanisms were strongly dependant on the joint<br />
structural geometry. Moreover, the fatigue lifetime <strong>of</strong> such joints is separated into two stages, the<br />
initiation stage, which is about a third <strong>of</strong> the fatigue lifetime, and the propagation stage for the rest up to<br />
failure.<br />
However, until very recently, relative little work concerning fatigue <strong>behaviour</strong> <strong>of</strong> <strong>composite</strong> π joint<br />
was published in the open literature. To provide more <strong>under</strong>standing on this subject, high cycle fatigue<br />
<strong>behaviour</strong> <strong>of</strong> a woven <strong>composite</strong> adhesive bonded joint subjected to tensile-tensile cycle <strong>loading</strong> was<br />
investigated in this paper.<br />
2. Geometry and material parameters <strong>of</strong> woven <strong>composite</strong> joint<br />
A woven <strong>composite</strong> joint with detailed configuration and geometric parameters is shown in Fig. 1.<br />
A shaped overlaminate co-bonded with a precured skin and then secondary-bonded with web plates at<br />
90 o direction. The shaped overlaminate is constructed from two plies <strong>of</strong> L prepreg, one ply <strong>of</strong> U<br />
prepreg and base prepreg, which are made <strong>of</strong> carbon/bismaleimide woven <strong>composite</strong> (CBWC). Some<br />
adhesive are added between the prepregs. The stacking sequences <strong>of</strong> L, U and Base prepreg and the<br />
location <strong>of</strong> adhesive are shown in Fig.1 too. The connections between the L, U and Base prepreg are<br />
achieved from unidirectional carbon/bismaleimide (UDCB) prepreg with 0º fibre direction, which are<br />
extruded by the L, U and base prepreg to form two prism-like fillers. The skin is manufactured by a<br />
glass fibre <strong>composite</strong> core covered with eight plies <strong>of</strong> same UDCB prepregs on both sides, in which the<br />
stacking sequence <strong>of</strong> the eight plies is [45 o /90 o /-45 o /0 o ]s. Whereas the web is fabricated by a Kevlar<br />
honeycomb and glass fibre reinforcement <strong>composite</strong> which covered with eight plies <strong>of</strong> UDCB prepregs<br />
on both sides with the stacking sequence [90 o /90 o /-45 o /45 o ]s. The material parameters are listed in Table<br />
1.<br />
Elastic parameters<br />
E1<br />
(GPa)<br />
Table 1. Elastic parameters and strength allowable values <strong>of</strong> CBWC and UDCB<br />
E2<br />
(GPa)<br />
E3<br />
(GPa)<br />
v12 v13 v23<br />
G12<br />
(GPa)<br />
G13<br />
(GPa)<br />
CBWC 60 60 7.46 0.035 0.31 0.31 5.18 5.18 5.18<br />
UDCB 121 7.46 7.46 0.31 0.31 0.44 5.18 5.18 2.59<br />
Strength allowable<br />
values<br />
S1t<br />
(MPa)<br />
S1c<br />
(MPa)<br />
S2t<br />
(MPa)<br />
S2c<br />
(MPa)<br />
S3t<br />
(MPa)<br />
S3c<br />
(Mpa)<br />
S12<br />
(MPa)<br />
S13<br />
(MPa)<br />
CBWC 601.2 581 563.9 578.2 51 209 112.1 87.9 87.9<br />
UDCB 2326 1236 51 209 51 209 87.9 87.9 99.2<br />
G23<br />
(GPa)<br />
S23<br />
(MPa)
J Y Zhang, Y Fu, L B Zhao, X Z Liang, H Huang, B J Fei. / <strong>Fatigue</strong> <strong>behaviour</strong> <strong>of</strong> woven <strong>composite</strong> joint<br />
3. Behaviour <strong>under</strong> static tensile load<br />
3.1 Static test programme<br />
Fig. 1. Geometry <strong>of</strong> π joint sample.<br />
Static tests were operated to identify the ultimate static strength (USS), which is the maximum force<br />
applied to the π joint and also the value <strong>of</strong> peak force for the fatigue test. The specimen and<br />
experimental apparatus for the static tensile test <strong>of</strong> <strong>composite</strong> joint is illustrated in Figure 2. The test<br />
was implemented in a servo hydraulic testing machine (Instron 8803). The skin was perpendicularly to<br />
the force axis, and the load was applied on the top end <strong>of</strong> the web plate. A rigid bracket jig was fixed at<br />
the base <strong>of</strong> the test machine to hold the π joint specimens. Both ends <strong>of</strong> skin plate were clamped by two<br />
eye rigid plates bolted to the rigid bracket. The rigid plates were at 80mm away from the centerline <strong>of</strong> <br />
joint.<br />
Fig. 2. Specimen and experimental set-up for static tensile test.<br />
For <strong>composite</strong> materials, the USS can vary with the load rate applied to the materials. The<br />
recommended practice is for the USS to be established by static testing at a rate approximating the load<br />
rate in the fatigue test in ASTM D-3039 [12]. Refer to relative researches [13, 14]; the static <strong>loading</strong> <strong>of</strong><br />
341
342<br />
Fifth International Conference on <strong>Fatigue</strong> <strong>of</strong> Composites<br />
π joints was <strong>under</strong>taken at a constant speed 1-2mm/min, which is very low to clearly identify the<br />
various failure mechanisms and the sequence in which they occurred.<br />
Three samples referred to the aforementioned woven <strong>composite</strong> π joint were tested. The displacement<br />
<strong>of</strong> the crosshead was recorded as load against displacement curve. Typical damage and failure events in<br />
tests were recorded by video and photographs. For the geometry complexity <strong>of</strong> the joint, an inner<br />
damage is difficult to be observed in experiment. Thus, initial damage was characterized by noise<br />
emitted during <strong>loading</strong> and a notable drop-<strong>of</strong>f in load vis-a-vis the load-displacement curve. Final<br />
failure was observed and illuminated by the maximum load on the load-displacement curve.<br />
3.2 Static test results<br />
For sample 1 and 3, the observable damage firstly appeared in the tip zone as shown in Fig.3(a).<br />
However, for sample 2, the observable damage appeared at the interface between the filler and L<br />
prepreg as shown in Fig. 3(b). Then new damage occurred in the tip zone quickly. For all the samples,<br />
with the increased load, the crack in the tip zone propagated towards the centerline <strong>of</strong> joint along the<br />
interface between the base prepreg and skin. Fig.3(c) gives the final failure pattern in the experiment.<br />
The joint was pulled apart on the upper ply <strong>of</strong> base prepreg, when the ultimate failure occurred.<br />
(a) Crack in the tip zone (b) Crack in the filler zone<br />
(c) Final failure<br />
Fig. 3. Failure patterns <strong>under</strong> static <strong>loading</strong>.<br />
The initial and final failure strengths <strong>of</strong> three samples in experiment are listed in Table 2. It can be
J Y Zhang, Y Fu, L B Zhao, X Z Liang, H Huang, B J Fei. / <strong>Fatigue</strong> <strong>behaviour</strong> <strong>of</strong> woven <strong>composite</strong> joint<br />
seen that the ultimate strength <strong>of</strong> woven <strong>composite</strong> π joint is 1.274kN, which is necessary for the fatigue<br />
test.<br />
Table 2. Initial/ultimate static strength in static tensile test<br />
Results Test 1 Test 2 Test 3 Average <strong>of</strong> tests<br />
Initial failure load /kN 0.753 0.700 0.750 0.734<br />
Final failure load /kN 1.240 1.244 1.339 1.274<br />
3.3 Numerical strength distribution<br />
The numerical analysis work in this programme has two main reasons. The first aspect was with<br />
respect to the difficulties in inspecting the test specimens for their complex geometry and small size.<br />
Secondly, the finite element model allowed for load paths and stress/strain/strength patterns to be<br />
assessed effectively, which was an inability for the experimental work. In this part <strong>of</strong> the paper, the<br />
stress/strength analysis is used to explain the trends seen in the experimental results and to <strong>under</strong>stand<br />
the location <strong>of</strong> failure in the joint. A three dimensional finite element model is established by the<br />
generalized s<strong>of</strong>tware ABAQUS ® , as shown in Fig. 4. In this model eight-noded solid elements C3D8<br />
were adopted in most area and six-noded solid elements C3D6 were used to fit the complex and<br />
irregular boundary. There are 160230 elements and 174608 nodes in total. The element size was reduced<br />
at the filler zone and tip zone, which were sensitive to the stress concentration. The finite element model<br />
was restrained at the two ends <strong>of</strong> skin to represent the clamping arrangement used during<br />
experimentation. A tensile load 0.637N was applied on the top <strong>of</strong> the web.<br />
Fig. 4. Finite element model.<br />
A traditional maximum stress failure criterion was chosen to assess the failure <strong>of</strong> plies in the joint.<br />
However, a modified maximum stress failure criterion [15] was used to assess the filler‟s failure for its<br />
block configuration characteristics. Assessed by the corresponding failure criteria, the strength<br />
distribution contour <strong>of</strong> <strong>composite</strong> π joint is shown in Fig.5, which provides more information about the<br />
static mechanical <strong>behaviour</strong> <strong>of</strong> woven <strong>composite</strong> π joint. It can be seen that a high stress level appears in<br />
the filler zone and tip zone. These two parts have weak load carrying capability and thus will be<br />
potential damage onset <strong>under</strong> service load.<br />
343
344<br />
4. Behaviour <strong>under</strong> fatigue load<br />
4.1 <strong>Fatigue</strong> test programme<br />
Fifth International Conference on <strong>Fatigue</strong> <strong>of</strong> Composites<br />
Fig. 5. Strength distribution in the filler zone and tip zone at tensile load 0.637kN.<br />
The clamps used in fatigue test were the same as the static tensile test. A tensile-tensile load was<br />
applied to the web <strong>of</strong> each π joint specimen while the two ends <strong>of</strong> skin were fully clamped. Fig.6<br />
illustrated the set-up for the π joint experimental programme <strong>under</strong> fatigue <strong>loading</strong>. A servo hydraulic<br />
testing machine (MTS 880) was used to implement the fatigue test at a constant amplitude sinusoidal<br />
<strong>loading</strong> with the load ratio R=Fmin/Fmax=0.1. The frequency <strong>of</strong> the tests is 5Hz.<br />
Fig. 6. Set-up for <strong>composite</strong> π joint experimental programme.<br />
The specimens were cycled at a series <strong>of</strong> constant maximum load values up to rupture. The maximum<br />
loads chosen were 80%, 70%, 60% and 50% <strong>of</strong> the ultimate static strength <strong>of</strong> joint. This allowed a<br />
complete knowledge <strong>of</strong> the fatigue life <strong>behaviour</strong> <strong>of</strong> woven <strong>composite</strong> π joints.<br />
For each cycles a measurement was taken <strong>of</strong> the maximum load and deflection value by the control<br />
computer. A microscope with precision 0.01mm was also <strong>under</strong>taken at intervals during test to provide a<br />
visual observation at the front surface <strong>of</strong> each specimen. Thus, a record was made <strong>of</strong> any observed<br />
damage, including initiation, growth, and localization; leading to ultimate failure <strong>of</strong> joint. At the same<br />
time, the cycles corresponding to these typical events were also recorded during the experiment.
J Y Zhang, Y Fu, L B Zhao, X Z Liang, H Huang, B J Fei. / <strong>Fatigue</strong> <strong>behaviour</strong> <strong>of</strong> woven <strong>composite</strong> joint<br />
4.2 <strong>Fatigue</strong> life <strong>of</strong> <strong>composite</strong> π joint<br />
The cycles with respect to the crack onset and final failure <strong>under</strong> various loads level are listed in<br />
Table 3. An amount <strong>of</strong> scatters <strong>of</strong> fatigue life was immediately obvious for these specimens. The reasons<br />
were tw<strong>of</strong>old. The first was due to complex structural configuration and multiple material components<br />
<strong>of</strong> joint. Secondly, it could be argued that the scatter was related to consistency <strong>of</strong> specimen<br />
manufacture.<br />
A further observation that can be made concerning the fatigue lifetime in Table 3 was a very short<br />
fatigue crack initiation life N ini , which was less than 22% <strong>of</strong> total fatigue lifetime N. Indeed, at a very<br />
limited number <strong>of</strong> cycles, initial crack could be observed on the front surface <strong>of</strong> all the specimens,<br />
which <strong>under</strong>went load lever from 50% to 80% USS with R=0.1. Unlike <strong>composite</strong> laminates, where<br />
fatigue limit is about 60-80% USS, the fatigue endurance limit <strong>of</strong> <strong>composite</strong> π joint is far lower than<br />
50% USS if the fatigue failure is assessed by the fatigue crack initiation. Moreover, to some extent, the<br />
crack growth experienced a long time and was predominant to the total fatigue lifetime.<br />
Table 3. <strong>Fatigue</strong> life <strong>of</strong> joints <strong>under</strong> tensile <strong>loading</strong><br />
Specimen No. Fmax Nini Ncg N lgFmax lgN lg N Fmax/USS<br />
1 1019.0 398 186564 186962 3.00 5.27 4.32 0.8<br />
2 1008 29381 30389 4.48<br />
3 672 2398 3070 3.49<br />
4 1 11254 11255 4.05<br />
5 892.0 5566 94434 100000 2.95 5.00 4.94 0.7<br />
6 800 50974 51774 4.71<br />
7 1 126116 126117 5.10<br />
8 764.4 11868 511536 523404 2.88 5.72 5.26 0.6<br />
9 1793 39162 40955 4.61<br />
10 19697 266848 286545 5.46<br />
11 637.0 501 >10 6<br />
>10 6<br />
2.80 >6.00 6.00 0.5<br />
Results from the experimental average value in terms <strong>of</strong> applied load and number <strong>of</strong> cycles to failure<br />
were plotted to produce S-N curve in dual-logarithm coordinates system, as shown in Fig.7. Under the<br />
experimental load level, the curve exhibits a well linear characteristic when the joint are fatigued. As the<br />
load increased, the number <strong>of</strong> cycles tended to decrease. Thus, the variation law <strong>of</strong> fatigue life with the<br />
load level could be expressed by two-parameter function, as written below<br />
lg F = 3.552 - 0.1249lg N<br />
(1)<br />
max<br />
4.3 <strong>Fatigue</strong> failure location and failure process<br />
Visual observation results depicted by the photographs could provide insight into the failure<br />
mechanisms <strong>of</strong> joint <strong>under</strong> fatigue load. A summary <strong>of</strong> experimental observation results is listed in Table<br />
4. The column <strong>of</strong> left-filler or right-filler denotes the load cycles when first crack could be observed at<br />
left filler or right filler. The column left-tip or right-tip gives the load cycles with respect to first crack<br />
occurrence in left or right tip zone, due to debonding <strong>of</strong> the horizontal leg <strong>of</strong> L prepreg with skin. For<br />
345
346<br />
Fifth International Conference on <strong>Fatigue</strong> <strong>of</strong> Composites<br />
different specimens, summary <strong>of</strong> crack onset location, final failure location, growth life <strong>of</strong> main crack<br />
and corresponding figure, which illustrated failure patterns <strong>of</strong> each specimen, is listed in the following<br />
columns, respectively.<br />
Fig. 7. S-N curve <strong>of</strong> the joint.<br />
Table 4. <strong>Fatigue</strong> failure location and failure process <strong>of</strong> specimens<br />
No. Left-Filler Right- Filler Left-tip Right-tip Crack onset location Final failure location Figure No.<br />
1 2824 893 398 ----- Left-tip Left-tip Fig.8(a)<br />
2 ----- 1 1008 ----- Left-Filler Left-tip Fig.8(b)<br />
3 1942 1 2072 672 Right- Filler Right-tip Fig.8(c)<br />
4 ----- 1 7112 1 Right- Filler Right-tip Right-tip Fig.8(d)<br />
5 3213 2209 5566 33200 Right- Filler Left-tip Fig.9(a)<br />
6 ----- 2100 3189 800 Right-tip Right-tip Fig.9(b)<br />
7 ----- 1485 1723 1 Right-tip Right-tip Fig.9(c)<br />
8 ----- 418 11868 978 Right- Filler Left-tip Fig.10(a)<br />
9 ----- 988 4128 1793 Right- Filler Right-tip Fig.10(b)<br />
10 95523 1 ----- 19697 Right- Filler Right-tip Fig.10(c)<br />
11 ----- ----- ----- 501 Right-tip ----- Fig.11<br />
The fatigue failure process <strong>of</strong> specimens 1 loaded at 80% USS is shown in Fig.8(a). At a very limited<br />
number <strong>of</strong> cycles 398, the left horizontal leg <strong>of</strong> L prepreg was peeled from the skin and an obvious<br />
crack could be observed. As the cycles increased, new cracks was noticed, located at the fillers <strong>of</strong> joint.<br />
The new crack occurred at the right filler with 893 cycles and then at the left filler with 2824 cycles.<br />
With the number <strong>of</strong> cycles increased, the delamination crack at the left tip zone propagated stably; the<br />
crack at the right filler grew slowly while no obvious propagation could be observed in the left filler. Up<br />
to final fatigue failure, no crack could be examined at the right tip zone. Because <strong>of</strong> the stable crack<br />
propagation started at left tip zone, the joint was eventually peeled <strong>of</strong>f along the interface <strong>of</strong> π<br />
overlaminate with the skin.
J Y Zhang, Y Fu, L B Zhao, X Z Liang, H Huang, B J Fei. / <strong>Fatigue</strong> <strong>behaviour</strong> <strong>of</strong> woven <strong>composite</strong> joint<br />
(a) Specimen 1 (b) Specimen 2<br />
(c) Specimen 3 (d) Specimen 4<br />
Fig. 8. Failure patterns with Fmax=80%USS.<br />
Fig.8(b) illustrates the failure patterns <strong>of</strong> specimen 2 loaded at 80% USS. At the first load cycle, an<br />
obvious crack along the interface between the right filler and L prepreg could be observed. After 1008<br />
cycles, a delamination crack occurred at the left tip zone. With the increased cycles, the cracks grew<br />
stably both at left tip zone and right filler. No visual crack was apparent at the left filler and right tip<br />
zone for this specimen. At last, the crack at left tip zone ran through the connection <strong>of</strong> joint and resulted<br />
in final rupture.<br />
Fig.8(c) showed the failure patterns <strong>of</strong> specimen 3 at different cycles. The specimen was also loaded<br />
at 80% <strong>of</strong> the ultimate strength <strong>of</strong> the joint. For this specimen, a crack could be observed at the right<br />
filler in the first load cycle, just like specimen 2. When the number <strong>of</strong> cycles arrived at 672, 1942 and<br />
2072, new cracks could be found at the right tip zone, left filler and left tip zone respectively. As the<br />
number <strong>of</strong> cycles increased, the crack at the right tip zone grew quickly while those in others place<br />
propagated slowly. Therefore, the crack at right tip zone propagated along the interface between the U<br />
prepreg and skin, and led to final collapse.<br />
The failure <strong>of</strong> the fourth specimen loaded at 80% USS was depicted in Fig.8(d). Two cracks occurred<br />
in the first load cycle, at right filler and right tip zone respectively. The two events were instantaneous<br />
347
348<br />
Fifth International Conference on <strong>Fatigue</strong> <strong>of</strong> Composites<br />
and therefore observing their sequence with the naked eye was impossible. As the number <strong>of</strong> cycles<br />
arrived at 7112, a new crack could be observed at the left tip zone. With continued cycles, the crack at<br />
the right tip zone propagated quickly and led to ultimate peeling <strong>of</strong> the π overlaminate from skin.<br />
(a) Specimen 5 (b) Specimen 6<br />
(c) Specimen 7<br />
Fig. 9. Failure patterns with Fmax=70%USS.<br />
Overall, for specimens loaded at 80% USS, two fatigue damage forms were exhibited. The crack<br />
onset occurred in the filler during the first load cycle. From then on, delamination crack occurred in the<br />
tip zone. As the cycles increased, the crack in the filler grew slowly whilst that in the tip zone<br />
propagated quickly. Thus, the final fatigue failure is predominated by the crack growth located at the tip<br />
zone.<br />
Fig. 9(a) described the failure process <strong>of</strong> specimen 5 <strong>under</strong> 70% USS. Initial crack occurred on the<br />
surface <strong>of</strong> right filler when the number <strong>of</strong> cycles arrived at 2209. From then on, new cracks appeared at<br />
the left filler, left tip zone and right tip zone when the number <strong>of</strong> cycles arrived at 3213, 5566 and 33200.<br />
The cracks at the left and right tip zone grew quickly whilst that at the filler propagated slowly up to<br />
final failure. The crack at left tip zone passed through the connection area and converged with the crack<br />
propagated from right tip zone, causing complete loss <strong>of</strong> joint strength.<br />
For specimen 7, the failure could be expressed by Fig.9(b). Initial delamination crack took place at
J Y Zhang, Y Fu, L B Zhao, X Z Liang, H Huang, B J Fei. / <strong>Fatigue</strong> <strong>behaviour</strong> <strong>of</strong> woven <strong>composite</strong> joint<br />
right tip zone at the number <strong>of</strong> cycles 800. New crack appeared at right filler and left tip zone with<br />
reference to the number <strong>of</strong> cycles 2100 and 3189 respectively. The crack at right tip zone propagated<br />
stably and quickly. When the number <strong>of</strong> cycles arrived at 41480, the crack abruptly grew 15mm and<br />
arrived at the <strong>under</strong>side <strong>of</strong> U prepreg. Subsequently, the crack continued stably and joined with the<br />
crack propagated from left tip zone, which led to the peeling <strong>of</strong> the overlaminate and skin.<br />
Failure patterns <strong>of</strong> the last specimen loaded at 70% USS was shown in Fig.9(c). During the first load<br />
cycle, visual crack could be found at the right tip zone. Subsequently, when the number <strong>of</strong> cycles<br />
arrived at 1485 and 1723, new cracks appeared at right filler and left tip zone respectively. With the<br />
increasing load cycles, the cracks at left and right tip zone grew symmetrically and stably. At the same<br />
time, the crack at the right filler propagated slowly. It is worth noting that the crack at the right filler<br />
stopped to grow when the crack started from right tip zone arrived at the <strong>under</strong>side <strong>of</strong> right filler.<br />
Eventually, the cracks from the left and right tip zone joined and the final rupture occurred.<br />
According to the Fig.9 with reference to specimens loaded at 70% USS, several physical phenomena<br />
could be summarized. Compared to those specimens load at 80% USS, only one specimen produced<br />
initial crack during the first load cycle. At the load level <strong>of</strong> 70% USS, generally, crack onset occurred at<br />
tip zone and subsequently new cracks took place at the filler. As the cycles increased, the cracks at the<br />
filler grew slowly. However, the crack at tip zone grew quickly and eventually resulted in the final<br />
collapse. During this process, two propagation forms could be observed. The first was a stable<br />
propagation up to rupture, which was dependant on the symmetrical growth <strong>of</strong> the cracks from two tip<br />
zone. Secondly, an abruptly instant failure could be observed if one side <strong>of</strong> the cracks grew quickly.<br />
Fig.10(a) gives the failure patterns <strong>of</strong> specimen 8 loaded at 60% USS. Crack onset appeared at right<br />
filler with the number <strong>of</strong> cycles 418. New cracks occurred at right and left tip zone at the number <strong>of</strong><br />
cycles 978 and 11868 respectively. As the load cycles increased, the cracks at left tip zone and right<br />
filler grew quickly. However, the crack at right tip zone stopped due to lack <strong>of</strong> drive force, caused by the<br />
propagation <strong>of</strong> crack at right filler. At last, the crack from left tip zone passed through the <strong>under</strong>side <strong>of</strong><br />
U prepreg and converged with the crack from right filler, leading to final failure.<br />
Fig.10(b) described the failure process <strong>of</strong> specimen 9 <strong>under</strong> 60% USS. Initial crack occurred on the<br />
surface <strong>of</strong> right filler when the number <strong>of</strong> cycles arrived at 988. From then on, new cracks appeared at<br />
the right and left tip zone when the number <strong>of</strong> cycles arrived at 1793 and 4128 respectively. With the<br />
increasing load cycles, cracks at left and right tip zone grew symmetrically and stably. At the same time,<br />
the crack at the right filler propagated slowly. The right tip zone crack grew to the <strong>under</strong>side <strong>of</strong> right<br />
filler rapidly when the number <strong>of</strong> cycles arrived at 25324. Then the right tip zone crack grew stably<br />
through the connection area and converged with the crack propagated from left tip zone, causing<br />
complete loss <strong>of</strong> joint strength.<br />
349
350<br />
Fifth International Conference on <strong>Fatigue</strong> <strong>of</strong> Composites<br />
(a) Specimen 8<br />
(b) Specimen 9 (c) Specimen 10<br />
Fig. 10. Failure patterns with Fmax=60%USS.<br />
Fig.10(c) showed the failure patterns <strong>of</strong> specimen 10 at different cycles. The specimen was also<br />
loaded at 60% <strong>of</strong> the ultimate strength <strong>of</strong> the joint. For this specimen, a crack could be observed at the<br />
right filler in the first load cycle, just like specimen 2, 3 and 4. When the number <strong>of</strong> cycles arrived at<br />
19697 and 95523, new cracks could be found at the right tip zone and left filler respectively. As the<br />
number <strong>of</strong> cycles increased, the crack at the right tip zone grew quickly while the other cracks<br />
propagated slowly. Therefore, the crack at right tip zone propagated along the interface between the U<br />
prepreg and skin, and led to final collapse.<br />
Fig.10 illustrated failure patterns <strong>of</strong> specimens loaded at 60% USS. Compared to those specimens<br />
load at 80% and 70% USS, only one specimen produced initial crack during the first load cycle. At the<br />
load level <strong>of</strong> 60% USS, generally, crack onset occurred at tip zone. As the cycles increased, the crack at<br />
tip zone grew quickly and led to final rupture. The same propagation forms, a stable propagation and an<br />
abrupt failure, as those specimens loaded at 70% could be found. However, the fatigue initiation life and<br />
growth life for these specimens loaded at 60% increased due to the reduction <strong>of</strong> load level.<br />
Fig.11 described failure process <strong>of</strong> specimen 11 loaded at 50% USS. After 501 load cycles,<br />
delamination crack appeared at right tip zone. However, the crack grew slowly and not reached the
J Y Zhang, Y Fu, L B Zhao, X Z Liang, H Huang, B J Fei. / <strong>Fatigue</strong> <strong>behaviour</strong> <strong>of</strong> woven <strong>composite</strong> joint<br />
<strong>under</strong>side <strong>of</strong> right filler until the test was stopped at the number <strong>of</strong> cycles10 6 . During this process, no<br />
visual crack could be observed at the filler zone and left tip zone.<br />
Fig. 11. Failure patterns <strong>of</strong> specimen 11 with Fmax=50%USS.<br />
Above all, the failure mode <strong>under</strong> fatigue tensile-tensile load was found to be extremely similar to the<br />
mode observed during static <strong>loading</strong>. The crack onset location was random but limited to the filler zone<br />
and tip zone at a very limited number <strong>of</strong> cycles. If the crack onset occurred initially at fillers then the<br />
next failure event was the delamination crack in the tip zone. Final failure was consistent, due to the<br />
delamination crack took place at tip zone. Further, it is worth noting that the number <strong>of</strong> cycles to cause<br />
crack onset was loosely dependant on the applied load. To some extent, the fatigue life <strong>of</strong> <strong>composite</strong> π<br />
joint is dependent on the crack propagation form.<br />
4.4 Stiffness degradation<br />
A large amount <strong>of</strong> studies related to stiffness reduction, as a fatigue measure, are based on<br />
experimental observations. They consider stiffness degradation as a result <strong>of</strong> various micromechanical<br />
parameters such as crack initiation, delamination, and fibre matrix debonding and fibre breakage <strong>under</strong><br />
cyclic <strong>loading</strong> [16]. Present research is aimed to depict stiffness degradation throughout the life <strong>of</strong> each<br />
joint specimen.<br />
For each cycle, the deflection δ <strong>of</strong> web and applied load P were obtained from continued<br />
measurements during experimentation. With these parameters, generalized stiffness <strong>of</strong> each cycle could<br />
be defined as the ratio <strong>of</strong> the applied load to the deflection <strong>of</strong> the web:<br />
k = P / <br />
(2)<br />
i max i max i<br />
Where ki, as a fatigue measure, denotes an ability to resist tensile deformation for <strong>composite</strong> π joint.<br />
Assume the generalized stiffness examined at the initial <strong>loading</strong> stage to be k 0 , which denotes the<br />
initial value <strong>of</strong> stiffness degradation for specimens <strong>under</strong> fatigue load. Then the normalized generalized<br />
stiffness could be expressed as:<br />
The normalized fatigue life could be written as:<br />
k = k / k<br />
(3)<br />
i<br />
0<br />
351
352<br />
where N is the total fatigue life.<br />
Fifth International Conference on <strong>Fatigue</strong> <strong>of</strong> Composites<br />
n = n / N<br />
(4)<br />
From the continued measurements <strong>of</strong> the load and deflection during experimentation, the change in<br />
the slope <strong>of</strong> the load-deflection curve could be obtained, and thus any global stiffness degradation could<br />
be identified. The slope <strong>of</strong> the load-deflection versus the fatigue life <strong>of</strong> the specimen normalized with<br />
respect to the number <strong>of</strong> cycles to failure is shown in Fig. 12.<br />
(a) Fmax=80%USS (b) Fmax=70%USS<br />
(c) Fmax=60%USS (d) Fmax=50%USS<br />
Fig. 12. Stiffness degradation curves.<br />
Fig.12(a) is reference to the specimens loaded at 80% USS. A slight increasing <strong>of</strong> the generalized<br />
stiffness could be observed in initial stage <strong>of</strong> fatigue load. Then the generalized stiffness descended<br />
stably from crack generation, further propagation, up to final failure. The total amount <strong>of</strong> descent is no<br />
more than 15%. An exception is for specimen 1, whose generalized stiffness decreased obviously at first<br />
and then remained unchanged. The failure <strong>of</strong> major area <strong>of</strong> right filler resulted in loss <strong>of</strong> load carrying<br />
ability in fatigue test.<br />
Fig.12(b) is associated with specimens loaded at 70% USS. Similar to the specimens loaded at 80%<br />
USS, the generalized stiffness also increased a little at first. However, an abrupt stiffness degradation<br />
could be found for specimen 5 and 6, due to a rapidly crack growth in the fatigue test. From then on, the<br />
stiffness degraded slowly until final rupture, which corresponded to the stable crack growth stage.<br />
Moreover, due to no remarkable failure at filler zone and symmetric stable crack propagation at tip zone,
J Y Zhang, Y Fu, L B Zhao, X Z Liang, H Huang, B J Fei. / <strong>Fatigue</strong> <strong>behaviour</strong> <strong>of</strong> woven <strong>composite</strong> joint<br />
the stiffness <strong>of</strong> specimen 7 waved from 0.95 to 1.15 during the fatigue test without obvious descent.<br />
Fig.12(c) is reference to the specimens loaded at 60% USS. Three specimens give different stiffness<br />
degradation process in this figure. Generalized stiffness decreased obviously at first and then decreased<br />
slowly in Specimen 8. This is because <strong>of</strong> the failure <strong>of</strong> major area <strong>of</strong> right filler at the beginning <strong>of</strong><br />
fatigue test. Generalized stiffness <strong>of</strong> specimen 9 decreased faster than the others, and a small abrupt<br />
stiffness degradation could be found, due to a rapidly crack growth in the fatigue test. A slight<br />
increasing <strong>of</strong> the generalized stiffness <strong>of</strong> specimen 10 could be observed in initial stage <strong>of</strong> fatigue load.<br />
Then the generalized stiffness descended stably from crack generation, further propagation, up to final<br />
failure.<br />
Fig.12(d) showed the experimental stiffness degradation curve <strong>under</strong> 50% USS. As the crack at tip<br />
zone slowly developed and grew in joint 11, the stiffness <strong>of</strong> the joint are reduced slightly.<br />
In a summary, four stiffness degradation modes for <strong>composite</strong> π joints exhibited in fatigue test due to<br />
their complex structural configuration and a variety <strong>of</strong> failure mode. (1) Stable slight reduction mode,<br />
corresponding to specimens that the crack only occurred at tip zone and continued to grow stably in<br />
fatigue test, such as specimen 2, 3, 4, 10 and 11. (2) Abruptly decreasing mode, with respect to<br />
specimens that crack took place at filler zone and major region <strong>of</strong> filler failed, such as specimen 1 and 8.<br />
(3) Step decrease mode, associated with specimens that crack at one side <strong>of</strong> tip zone propagated rapidly<br />
to the <strong>under</strong>side <strong>of</strong> U prepreg, such as specimen 5, 6 and 9. (4) Constant stiffness mode, with reference<br />
to the specimens that cracks at left and right tip zone had a stably symmetric propagation, such as<br />
specimen 7.<br />
5. Conclusions<br />
Static and fatigue tests have been conducted on <strong>composite</strong> π joints <strong>under</strong> tensile <strong>loading</strong>. A detailed<br />
analysis <strong>of</strong> damage evolution has been proposed so on to <strong>under</strong>stand the fatigue <strong>behaviour</strong> <strong>of</strong> the sample.<br />
From this study, the following concluding remarks can be made:<br />
The endurance limit <strong>loading</strong> is lower than the initial damage load and about half <strong>of</strong> the ultimate<br />
static strength.<br />
The fatigue lifetime <strong>of</strong> <strong>composite</strong> joint comprised <strong>of</strong> two stages: initiation stage, which is less<br />
than 25% <strong>of</strong> the fatigue lifetime, and the rest is devoted to the crack propagation stage.<br />
The sample in fatigue tensile test has similar damage onset and propagation patterns with that in<br />
static tensile test. The filler zones and tip zones are the potential weakness in the joints. There are<br />
high stress concentrate on the tip <strong>of</strong> horizontal leg <strong>of</strong> L prepreg, resulting in the ultimate collapse<br />
occurred on the upper ply <strong>of</strong> base prepreg.<br />
Because <strong>of</strong> the complex structure and a variety <strong>of</strong> failure mode, different stiffness degradation<br />
modes for <strong>composite</strong> π joints are detected in fatigue test.<br />
Acknowledgements<br />
The research work is supported by the National Science Foundation <strong>of</strong> China (10902004) and the<br />
Fundamental Research Funds for the Central Universities (YWF-10-02-090).<br />
353
354<br />
References<br />
Fifth International Conference on <strong>Fatigue</strong> <strong>of</strong> Composites<br />
[1] Taylor RM, Owens SD. Correlation <strong>of</strong> an analysis tool for 3-D reinforced bonded joints on the F-35 joint strike fighter. AIAA-2004-1562.<br />
[2] Butler B. Composites affordability initiative. AIAA-2000-1379.<br />
[3] Shenoi RA, Hawkins GL. Influence <strong>of</strong> material and geometry variations on the <strong>behaviour</strong> <strong>of</strong> bonded tee connections in FRP ships.<br />
Composites 1992;23(5):335-345.<br />
[4] Hawkins GL, Holness JW, Dodkins AR, Shenoi RA. The strength <strong>of</strong> bonded tee joints in FRP ships. Plasti, Rubber, Compos Process<br />
Applic 1993;19:279-284.<br />
[5] Blake JIR, Shenoi RA, House J, Turton T. Progressive damage analysis <strong>of</strong> tee-joints with viscoelastic inserts. Composites Part A<br />
2001;32:641-653.<br />
[6] Shenoi RA, Read PJCL. A review <strong>of</strong> fatigue damage modelling in the context <strong>of</strong> marine FRP laminates. Marine Structures<br />
1995;8:257-278.<br />
[7] Phillips HJ, Shenoi RA. Damage tolerance <strong>of</strong> laminated tee joints in FRP ship structures. Composites Part A 1998;29A:465–78.<br />
[8] Phillips HJ, Shenoi RA, Moss CE. Damage mechanics <strong>of</strong> top-hat stiffeners used in FRP ship construction. Marine Structures<br />
1999;12:1-19.<br />
[9] Shenoi RA, Read PJCL, Hawkins GL. <strong>Fatigue</strong> failure mechanisms in fibre-reinforced plastic laminated tee joints. Int J <strong>Fatigue</strong><br />
1995;17(6):415-426.<br />
[10] Read PJCL, Shenoi RA. <strong>Fatigue</strong> <strong>behaviour</strong> <strong>of</strong> single skin FRP tee joints. Int J <strong>Fatigue</strong> 1999; 21:281–296.<br />
[11] Marcadona V, Nadot Y, Roy A, Gacougnolle JL. <strong>Fatigue</strong> <strong>behaviour</strong> <strong>of</strong> T-joints for marine applications. Int J Adhesion & Adhesives 2006;<br />
26:481–489.<br />
[12] ASTM D3039/D 3039M-00. Standard test method for tensile properties <strong>of</strong> polymer matrix <strong>composite</strong> materials. 2002.<br />
[13] Feih S, Shercliff HR. Adhesive and <strong>composite</strong> failure prediction <strong>of</strong> single-L joint structures <strong>under</strong> tensile <strong>loading</strong>, Int J Adhesion &<br />
Adhesives, 2005;25:47-59.<br />
[14] Pei JH, Shenoi RA. Examination <strong>of</strong> key aspects defining the performance characteristics <strong>of</strong> out-<strong>of</strong>-plane joints in FRP marine structures.<br />
Composites Part A 1996;27A:89-103.<br />
[15] Qin TL. Strength Prediction Method and Failure Mechanism <strong>of</strong> π Joint in FRP Structures. Master Degree Dissertation, Beihang University.<br />
2010;17-35.<br />
[16] Taheri-Behrooz F, Shokrieh MM, Lessard LB. Residual stiffness in cross-ply laminates subjected to cyclic <strong>loading</strong>. Composite structures,<br />
2008;85:205-212.
Damage in thermoplastic <strong>composite</strong> structures: application to<br />
high pressure hydrogen storage vessels<br />
Abstract:<br />
C Thomas a , F Nony a, *, S Villalonga a , J Renard b,†<br />
1: CEA, DAM, Le Ripault-F-37260 MONTS, France<br />
2: Centre des Matériaux, P.M.Fourt UMR CNRS 7633 BP 87, 91003 EVRY, France<br />
The design <strong>of</strong> reinforced laminated <strong>composite</strong>s for type IV high pressure vessels application takes into account the<br />
initial mechanical properties <strong>of</strong> the material including safety coefficients but without any consideration with durability<br />
and damage resistance.<br />
This study focuses on the different damages occurring in carbon fibres / polyamide matrix <strong>composite</strong> structures with<br />
the objective to <strong>under</strong>stand their influence on the mechanical properties and then the conception and manufacturing<br />
process <strong>of</strong> <strong>composite</strong> structures. The first part is dedicated to the characterization <strong>of</strong> the material and particularly its<br />
initial thermal and mechanical properties. Then, considering the different orientations <strong>of</strong> the filamentary wounded<br />
structure, damage processes are investigated (matrix cracking, delamination). In addition, first results <strong>of</strong> a dedicated<br />
filamentary winding process are presented. The influence <strong>of</strong> the key parameters is assessed.<br />
Keywords: damage; <strong>composite</strong>; thermoplastic; high pressure vessels; hydrogen<br />
1. Introduction<br />
Among the different storage strategies, compressed gaseous hydrogen storage (CGH2) seems to be<br />
the maturest solution. To be efficient, this storage must be done at high pressure (above 35 MPa and up<br />
to 70 MPa for on-board applications). For several years, CEA has been involved in the development <strong>of</strong><br />
type IV high pressure vessels and has obtained promising achievements [1]. This type <strong>of</strong> vessels<br />
presents a polymeric liner, which exhibits high hydrogen tightness and which is reinforced by a<br />
structural <strong>composite</strong> layer. This structural layer allows the vessels to withstand high mechanical stresses<br />
and its design takes into account the burst pressure (140 MPa) and the number <strong>of</strong> cycles <strong>of</strong> 20 to 875<br />
bars (5 000 to 15 000 for vehicles applications and more than 100 000 for others applications). This<br />
design is done, considering the initial mechanical properties. The material durability and damages,<br />
particularly, for thick shells, are not well known and at present not directly taken into account.<br />
Damages are induced by the synergetic effect <strong>of</strong> environmental stresses or <strong>loading</strong> and the structure<br />
heterogeneity or existing defects. These defects can be due to critical material or inappropriate process<br />
parameters.<br />
This study focuses on the damages <strong>of</strong> carbon fibres / polyamide matrix <strong>composite</strong>s structures.<br />
Thermoplastic matrix <strong>composite</strong>s can be considered as relevant candidates since they present many<br />
* E-mail address: fabien.nony@cea.fr. Tel.: 0033 2 47 34 40 00.<br />
† E-mail address: jacques.renard@ensmp.fr. Tel.: 0033 1 60 76 30 31.
356<br />
Fifth International Conference on <strong>Fatigue</strong> <strong>of</strong> Composites<br />
advantages. They exhibit numerous potential interests in terms <strong>of</strong> impact resistance, durability and<br />
recyclability. The manufacturing process is also attractive because it <strong>of</strong>fers potential reducing <strong>composite</strong><br />
manufacturing costs and time (e.g. no need <strong>of</strong> thermal curing) [2]. In the case <strong>of</strong> high pressure vessels,<br />
the <strong>composite</strong> layer is manufactured by filament winding. The main limit <strong>of</strong> the process is the required<br />
heating system, which is used to s<strong>of</strong>ten and melt the matrix. In addition to that, a pressure must be<br />
applied during laying up to ensure sufficient material consolidation. On going R & D activities are<br />
focused on winding process optimization.<br />
The initial mechanical and thermal properties <strong>of</strong> the material are determined. Two different damage<br />
processes, delaminating and matrix cracking are studied. It aims at <strong>under</strong>standing damages occurring<br />
during the qualification tests <strong>of</strong> vessels like hydraulic pressure cycling or burst. In parallel, the<br />
thermoplastic pre-impregnated tape winding process is being developed and the influence <strong>of</strong><br />
manufacturing parameters on material structure and properties is also being studied.<br />
Major expected outcomes are improvement <strong>of</strong> the modeling and the manufacturing thanks to the<br />
knowledge <strong>of</strong> material <strong>behaviour</strong> and durability.<br />
2. Material and methods<br />
2.1 Materials<br />
The studied materials, Carbostamp TM PA 6 and Carbostamp TM PA 12, are polyamide matrix<br />
(polyamide 6 or 12) reinforced with T 700 Carbon Fibres from Toray SOFICAR. The fibre volume<br />
fraction, determined by pyrolysis at 500 o C, is about 50 %. The matrix is semi crystalline and presents a<br />
melting point at 175 o C for the polyamide 12 and at 215 o C for polyamide 6. Testing samples consist in 2<br />
mm thick specimens for tensile test on unidirectional (45 o , 90 o ) or cross-plied ([02.902]s or [± 45 o ]s)<br />
laminates and in 1 mm thick specimens for longitudinal (0 o ) tensile test. The density is about 1.41 g/cm 3<br />
for Carbostamp TM PA 12 and about 1.47 g/cm 3 for Carbostamp TM PA 6.<br />
2.2 Sample manufacturing<br />
Laminates and wound samples (rings and pipes) are manufactured using UD fully pre impregnated<br />
tapes (Carbostamp TM ). Flat samples are dedicated to the determination <strong>of</strong> mechanical properties and the<br />
study <strong>of</strong> damage processes, whereas wound samples are dedicated to the study <strong>of</strong> the filament winding<br />
process parameters influence.<br />
UD flat specimens and cross-plied laminates are manufactured by hot compression moulding. The<br />
mould and the materials are heated to reach 210 o C for polyamide 12 and 230 o C for polyamide 6. Then a<br />
pressure is applied. Finally the pressurized mould is cooled to a temperature below 60 o C at 5 o C/min and<br />
the consolidated specimen is extracted [3].<br />
Rings and pipes are manufactured by filament winding, which is commonly used for high pressure<br />
vessels application. The most important difficulty is the high flexural rigidity <strong>of</strong> the tape. Pre heating <strong>of</strong><br />
the tape is required to s<strong>of</strong>ten the tape for a better motion and further thermal boost is required to melt<br />
the matrix. The heating temperature must be high enough to reach a low viscosity value, which makes
C Thomas, F Nony, etc. / Damage in thermoplastic <strong>composite</strong> structures: application to high pressure hydrogen storage vessels<br />
the matrix inter layer diffusion easier but must not trigger oxidation. Other parameters can have an<br />
influence on the material structure and properties [4-6]. After placement a sufficient pressure must be<br />
applied to ensure satisfying consolidation and minimize void content. The tape is also subjected to a<br />
roving tension to keep the fibre orientation. However, this tension must be appropriate to avoid broken<br />
filaments. The velocity <strong>of</strong> the mandrel also plays a key role. It must be compatible with the melting <strong>of</strong><br />
the matrix and the consolidation <strong>of</strong> the structure.<br />
The process developed in this study presents a preheater (infrared), which raises the temperature just<br />
below the melting point, and a heater (infrared), which raises it above the melting point near the<br />
mandrel (Figure 1). The consolidation is ensured by a compaction roller. An adjustable tension is<br />
magnetically applied to PA/FC tape spools.<br />
2.3 Material properties and damage investigation<br />
Fig. 1. Development <strong>of</strong> thermoplastic <strong>composite</strong> filament winding process.<br />
Tensile tests have been conducted, using a 250 kN machine Zwick Roel Z 250, according to the<br />
standard ISO 527-5 [7], on unidirectional specimen with three different orientations 0, 90 and 45 o<br />
(orientations <strong>of</strong> fibres compared to the tensile load direction). Scanning electron microscopy (SEM) has<br />
been used to characterize the failure surface <strong>of</strong> the specimens.<br />
Fig. 2. Schematic view <strong>of</strong> crack density measurement by optical microscopy and example <strong>of</strong> cracking for [02,904,02] sequence.<br />
Damage by intralaminar cracking is also studied. This type <strong>of</strong> damages mainly occurs with<br />
cross-plied laminates (stacking sequences 02/90n/02), that are submitted to tensile <strong>loading</strong> [8]. The<br />
<strong>loading</strong> is applied by 50 MPa steps, cracks are observed by optical microscopy and a camera is focused<br />
on polished specimen side edges to determine crack density as a function <strong>of</strong> load (Figure 2).<br />
357
358<br />
Fifth International Conference on <strong>Fatigue</strong> <strong>of</strong> Composites<br />
Loading / un<strong>loading</strong> tests have been performed on [± 45]s laminates not only to show the<br />
visco-plastic <strong>behaviour</strong> <strong>of</strong> the matrix but also the delaminating process. The <strong>loading</strong> is applied by 10<br />
MPa steps. The influence <strong>of</strong> the <strong>loading</strong> rate (0.1, 1 and 5 MPa/s) and <strong>of</strong> the relaxation duration (2, 15<br />
and 30 minutes) is assessed. Damage development is also characterized by microscopic observation.<br />
Tests have also been performed on samples with embedded fiber Bragg grating (FBG) sensors for<br />
damage detection ((transverse cracks and delaminating) or stress / strain gradients measurements.<br />
2.4 Study <strong>of</strong> filament winding influence<br />
Rings are manufactured with different processing parameters (pressure <strong>of</strong> consolidation, heating<br />
temperature and roving tension) and are intended to <strong>under</strong>go tensile tests (according to ASTM D 2290<br />
standard [9]) to assess respective influence.<br />
3. Results and discussion<br />
3.1 Material properties-Quasi static tensile tests<br />
Quasi static tensile tests with a constant crosshead speed <strong>of</strong> 1 or 2 mm/min have been performed on<br />
[458], [908], [± 45]s and [04] multi-layers samples. Applied stresses have been calculated as the ratio <strong>of</strong><br />
applied loads to <strong>composite</strong> cross-section area. Strains are measured by a numerical extensometer.<br />
The table 1 sums up the values obtained for Carbostamp TM PA 6 and Carbostamp TM PA 12.<br />
Matrix<br />
ζ11<br />
(MPa)<br />
Table 1. Mechanical properties <strong>of</strong> Carbostamp TM PA 6 and PA 12 (hot compression molded samples)<br />
E11<br />
(GPa)<br />
ε11 (%)<br />
ζ22<br />
(MPa)<br />
ε22 (%)<br />
E22<br />
(GPa)<br />
ζ45 o<br />
(MPa)<br />
G12<br />
(GPa)<br />
PA 12 1860 105 1.25 25 0.7 3.7 33 6.30 0.32 87<br />
PA6 1485 112 1.16 22 0.38 5.95 26 6.81 - 93<br />
μ12<br />
ζ±45 o<br />
(MPa)<br />
Scanning electron microscopy (SEM) pictures, carried out to characterize the failure surfaces (Figure<br />
3) show that the fibre/matrix adhesion seems to be efficient even in the case <strong>of</strong> transverse tensile test<br />
which is believed to be one <strong>of</strong> the most sensitive tests for assessing the relative interfacial adhesion<br />
strength in <strong>composite</strong>s. Consistently with Evstatiev and al [10], that can be explained by the presence <strong>of</strong><br />
reinforcing matrix transcrystalline phase on the fiber surface, which presents high nucleation ability.<br />
A difference can be noticed between the respective breaking stress <strong>of</strong> unidirectional 45 o sample and<br />
[± 45 o ]s laminate. Indeed, it is multiplied by two or three for the cross-plied sample. For the first one,<br />
breakage occurs when the first crack appears, whereas for the second one, the development <strong>of</strong> multiple<br />
cracks and delaminating can be observed (Figure 4).<br />
3.2 Study <strong>of</strong> damage by intralaminar cracking<br />
Basically, tensile tests on UD specimens produced no cracking and failure occurring with no prior<br />
macroscopic warning. Cross-plied laminates such as stacking sequences <strong>of</strong> [02, 904, 02] exhibit matrix<br />
cracking when they were submitted to tensile <strong>loading</strong>. The cracks appear parallel to the fibres in plies<br />
oriented <strong>of</strong>f the <strong>loading</strong> direction (plies at 90 o in this case) (Figure 6). The <strong>loading</strong> is applied by 50 MPa
C Thomas, F Nony, etc. / Damage in thermoplastic <strong>composite</strong> structures: application to high pressure hydrogen storage vessels<br />
steps until break. The number <strong>of</strong> cracks is evaluated at the end <strong>of</strong> every <strong>loading</strong>/un<strong>loading</strong> cycle. The<br />
evolution <strong>of</strong> the density <strong>of</strong> cracks (i.e. the number <strong>of</strong> cracks per observed length expressed in mm) as a<br />
function <strong>of</strong> applied load show the kinetic <strong>of</strong> damage by intralaminar cracking. As it can be seen, the<br />
material presents a Kaiser effect, since the damage density <strong>of</strong> the cycle n+1 increases if the <strong>loading</strong><br />
stress is up to the cycle n one. For both materials no crack was observed for an applied stress below 200<br />
MPa (Figure 5). Above this level, the level <strong>of</strong> crack density increased until a limit which seems to be<br />
reached before failure, at around 600 MPa. For an applied load up to 700 MPa, longitudinal cracks<br />
and delaminating appear until break (figure 7 and 8).<br />
[04] specimen [908] specimen [458] specimen<br />
Fig. 3. Failure surface <strong>of</strong> specimen after tensile test, SEM records.<br />
Fig. 4. Cracks observed on [± 45 o ] samples.<br />
Fig. 5. Crack density d (number <strong>of</strong> cracks in 90 o ply/mm) during <strong>loading</strong> for 02/904/02 sequences <strong>of</strong> Carbostamp TM PA 6 and Carbostamp TM PA 12.<br />
359
360<br />
Fifth International Conference on <strong>Fatigue</strong> <strong>of</strong> Composites<br />
Fig. 6. Transverse cracks (<strong>loading</strong> between 200 and 600 MPa).<br />
Fig. 7. Longitudinal cracks (<strong>loading</strong> up to 700 MPa).<br />
Fig. 8. Delaminating (<strong>loading</strong> up to 700 MPa)<br />
The Carbostamp TM PA 6 limit <strong>of</strong> crack density is lower than Carbostamp TM PA 12 one. That can be<br />
explained by the strength <strong>of</strong> the matrix, which is lower for PA 12 (ζ break (PA 12) = 55 MPa < ζ break (PA<br />
6) = 80 MPa). It can also be explained by a lower shear resistance for Carbostamp TM PA 6 than for<br />
Carbostamp TM PA 12. Existing defects have also an influence on process <strong>of</strong> damages. Regions with low<br />
matrix content and porosity can initiate cracks (Figure 9 and 10).<br />
Cracking has also an influence on the rigidity <strong>of</strong> the material. As noticed, the rigidity represented by<br />
the ratio between the modulus at a given load over the initial modulus decreases when the applied load<br />
increases, i.e. when the crack density increases (Figure 11). This decrease begins when the first cracks<br />
appears.<br />
3.3 Study <strong>of</strong> damage by delaminating<br />
Loading / un<strong>loading</strong> cycles performed on [±45]s laminates show different aspects <strong>of</strong> the material<br />
.
C Thomas, F Nony, etc. / Damage in thermoplastic <strong>composite</strong> structures: application to high pressure hydrogen storage vessels<br />
<strong>behaviour</strong>. First <strong>of</strong> all, the <strong>behaviour</strong> can be considered as non linear. Then, for an applied stress up to<br />
25-30 MPa, the formation <strong>of</strong> a hysteresis loop can be noticed. This loop is wider and wider with the<br />
increasing stress. In addition to that, the material presents a residual plastic strain (Figure 12).<br />
Fig. 9. Example <strong>of</strong> crack initiated by porosity.<br />
Fig. 10. Example <strong>of</strong> crack initiated by matrix poor region.<br />
Fig. 11. Evolution <strong>of</strong> the longitudinal modulus E as a function <strong>of</strong> the applied load for Carbostamp TM PA 6 [02, 904, 02].<br />
361
362<br />
Fifth International Conference on <strong>Fatigue</strong> <strong>of</strong> Composites<br />
Fig. 12. Visco-plastic <strong>behaviour</strong> <strong>of</strong> the matrix-<strong>loading</strong>/un<strong>loading</strong> tests on [±45]s laminates (Carbostamp TM PA 12, stress rate: 1 MPa/s, relaxation<br />
time: 15 minutes).<br />
These two phenomenons are directly linked to the visco-plastic <strong>behaviour</strong> <strong>of</strong> the matrix. The two<br />
matrixes, polyamide 12 and polyamide 6, exhibit similar <strong>behaviour</strong>. Closed to the breaking stress, the<br />
residual strain can be associated not only with the visco-plastic <strong>behaviour</strong> <strong>of</strong> the matrix, but also with<br />
damage by delamination. The damage process begins by the formation <strong>of</strong> ply cracking which propagate<br />
to the neighbouring interface by delaminating.<br />
These damages influence the shear rigidity <strong>of</strong> the material. This influence can be revealed through<br />
the evolution <strong>of</strong> shear modulus, G12, as a function <strong>of</strong> applied load. The shear modulus decreases while<br />
the applied load increases. The influence <strong>of</strong> two parameters on this evolution has been assessed. Three<br />
different <strong>loading</strong> rates (0.1, 1 and 5 MPa/s) and three different relaxation times (2, 15 and 30 minutes)<br />
have been tested. One can see in Figure 13 and 14 that these two parameters have no influence on the<br />
evolution <strong>of</strong> shear modulus and thus on the damage process.<br />
Fig. 13. Influence <strong>of</strong> the <strong>loading</strong> rate on the evolution <strong>of</strong> the shear modulus: (a) Carbostamp TM PA 12 (b) Carbostamp TM PA 6.<br />
However, these two parameters have an influence on the residual strain. Indeed, the residual strain<br />
increases when the <strong>loading</strong> rate decreases, since the creep phenomenon is more important. Besides, this<br />
residual strain decreases when the relaxation time increases. One can see this observation for<br />
Carbostamp TM PA 6 on Figure 15.
C Thomas, F Nony, etc. / Damage in thermoplastic <strong>composite</strong> structures: application to high pressure hydrogen storage vessels<br />
Fig. 14. Influence <strong>of</strong> the relaxation time on the evolution <strong>of</strong> the shear modulus: (a) Carbostamp TM PA 12 (b) Carbostamp TM PA 6.<br />
Fig. 15. Influence <strong>of</strong> the <strong>loading</strong> rate (a) and the relaxation time (b) on the residual strain during <strong>loading</strong>/ un<strong>loading</strong> tests performed on [±45]s<br />
Carbosatmp PA 6 laminates.<br />
3.4 Detection <strong>of</strong> damages with embedded fiber Bragg grating sensors<br />
Same tests as before have been performed on samples with embedded FBG sensors. Such sensors<br />
have already been used to detect microscopic damages in <strong>composite</strong> laminates, like transverse cracks<br />
and delaminating [11]. Indeed, these defects trigger changes in the reflection spectra that can be<br />
investigated at various tensile stresses.<br />
For [02, 904, 02] laminates, the FBG sensors were embedded at the 0 o /90 o interface in the 0 o ply<br />
parallel to the fiber. Thus, the embedment does not deteriorate the mechanical properties <strong>of</strong> the<br />
<strong>composite</strong>, since the maximum elongation <strong>of</strong> the FBG sensor is much larger than that <strong>of</strong> the reinforcing<br />
carbon fibers. The sensor is sensitive to transverse cracks that run through the thickness and width <strong>of</strong><br />
the 90 o ply. When there is no crack (applied load below 200 MPa), the reflection spectra keep its shape<br />
and the wavelength is shifted corresponding to the strain. Then, when the <strong>loading</strong> stress increases,<br />
cracks appear. The form <strong>of</strong> the reflection spectra is distorted. The highest peak becomes small and other<br />
peaks appear (Figure 16). This distortion is more pronounced when the crack density increases. After<br />
un<strong>loading</strong>, spectra recovered their height but not their shape because <strong>of</strong> the strain distribution caused by<br />
transverse cracking. For high stresses, the signal is lost because <strong>of</strong> transverse compression load <strong>under</strong><br />
tabs which induced high optical attenuation.<br />
363
364<br />
Fifth International Conference on <strong>Fatigue</strong> <strong>of</strong> Composites<br />
Fig. 16. Detection <strong>of</strong> transverse cracks with an embedded FBG sensors-Investigation <strong>of</strong> the reflection spectrum<br />
for an applied load up to 200 MPa.<br />
All these observation are consistent with those done by Okabe et al. on CFRP laminates [12].<br />
For [[±45s]]2 laminates, the FBG sensors were embedded between two plies oriented at 45 o . Before<br />
delaminating, the spectrum keeps its shape and the center wavelength shifts corresponding to the strain.<br />
When delamination appears (<strong>loading</strong> up to 60 MPa), the spectrum becomes Larger. Other peaks appear<br />
too because <strong>of</strong> a non-uniform axial strain distribution along the sensor (Figure 17). This deformation is<br />
irreversible. The delamination propagates until breaking. Breaking <strong>of</strong> the samples and the sensors are<br />
simultaneous.<br />
Fig. 17. Detection <strong>of</strong> delaminating with an embedded FBG sensors.<br />
These observations are consistent with bibliography on CFRP laminates [13, 14].<br />
3.5 Influence <strong>of</strong> the filament winding parameters<br />
As mentioned before, filament winding process involves different key parameters that influence the<br />
architecture <strong>of</strong> the material, its mechanical properties and then the damage evolution.<br />
To analyze the influence <strong>of</strong> the parameters <strong>of</strong> the process, tensile tests were performed on rings.<br />
These tests performed on rings allowed a simple mechanical characterization avoiding to test flat<br />
wounded specimens the purpose <strong>of</strong> which should be as closer as possible to the process. This testing<br />
method is easy to conduct but the stress distribution is inhomogeneous along the perimeter <strong>of</strong> the ring.<br />
The stress concentration is particularly high in the area <strong>of</strong> the gap. As the consequence, the modulus can
C Thomas, F Nony, etc. / Damage in thermoplastic <strong>composite</strong> structures: application to high pressure hydrogen storage vessels<br />
not be determined and the measured strength is expected to be lower than those obtained with flat<br />
samples (1530 MPa).<br />
Figure 18 shows the influence <strong>of</strong> the roving tension. We can see that the maximum stress decreases<br />
when the roving tension is increased. A high tension may trigger fibers damages like breaks.<br />
4. Conclusions and prospects<br />
Fig. 18. Influence <strong>of</strong> roving tension on maximum stress obtained during NOL tests.<br />
Transverse cracking and delamination have been studied on two different carbon fibers reinforced<br />
polyamide matrix (PA 12 and PA 6) <strong>composite</strong>s, taking into account the initial thermal and mechanical<br />
properties. The two materials exhibit similar <strong>behaviour</strong> regarding these two damages process.<br />
Concerning transverse cracking, for both materials, cracks appear for a load up to 200 MPa, and the<br />
crack density increases until a limit. After that, longitudinal cracks and delaminating appear until the<br />
specimen failure. PA 6/ carbon fibers <strong>composite</strong> present a crack density limit lower than PA 12 / carbon<br />
fibers <strong>composite</strong>, because <strong>of</strong> the high strength <strong>of</strong> the matrix.<br />
Shear <strong>behaviour</strong>s is also close and damage by delamination does not seem to be influenced by<br />
<strong>loading</strong> rates and relaxation time.<br />
Further, embedded FBG sensors have shown an interesting way for damage detection, since the<br />
occurring damage as ply cracking or delamination trigger a distortion <strong>of</strong> the spectrum shape and a shift<br />
<strong>of</strong> the wavelength.<br />
In addition, the thermoplastic pre-impregnated tape winding process has been developed and the<br />
influences <strong>of</strong> the manufacturing parameters on the structural fabricated material and its properties have<br />
been investigated.<br />
This preliminary study may contribute to improve the <strong>under</strong>standing <strong>of</strong> results registered (acoustic<br />
events) during qualification tests <strong>of</strong> vessels as cyclic hydraulic pressure tests or burst.<br />
The results obtained in this study would be compared with those obtained with thermoset matrix /<br />
carbon fibres <strong>composite</strong>s in order to quantify the respective advantages / weaknesses <strong>of</strong> thermoplastic<br />
matrix <strong>composite</strong> structures in terms <strong>of</strong> mechanical properties and durability.<br />
365
366<br />
Acknowledgement<br />
Fifth International Conference on <strong>Fatigue</strong> <strong>of</strong> Composites<br />
This work has been supported by the French National Research Agency through Plan d‟Action sur<br />
l‟Hydrogène et les Piles à Combustible programme (Projet HYPE, N o ANR-07-PANH-006).<br />
References<br />
[1] Nony.F., Mazabraud P., Villalonga S. et al. Type IV 700 bar-vessel for Compressed Gaseous Hydrogen Storage; Material Research and<br />
Performance Achievements. 17th World Hydrogen Energy Conference, Brisbane, Australia, 15-19 June 2008.<br />
[2] Tomlimson W.J., Holland J.R. « Advantages <strong>of</strong> Pultruding Thermoplastics». Reinforced Plastics, Vol. 37, Issue 10 (1993), pp. 46-49<br />
[3] MC Donnell P., Mc Garvey K.P. Processing and mechanical properties evaluation <strong>of</strong> a commingled carbon-fibre/PA 12 <strong>composite</strong>.<br />
Composites: Part A, Vol. 32 (2001), pp. 925-932<br />
[4] Henninger F., Friedrich K. Thermoplastic filament winding with online impregnation. Part A: process technology and operating efficiency.<br />
Composites: Part A, Vol. 33 (2002), pp. 1479-1486<br />
[5] Henninger F., Friedrich K. Thermoplastic filament winding with online impregnation. Part B: Experimental study <strong>of</strong> processing parameters.<br />
Composites: Part A, Vol. 33 (2002), 1677-1688<br />
[6] Lauke B., Schöne A., Friedrich K. High performance thermoplastic <strong>composite</strong>s fabricated by filament winding in Proceedings <strong>of</strong><br />
International Conference <strong>of</strong> Advanced Composites, Wollongong, Australia 1999<br />
[7] NF EN ISO 527-5, Détermination des propriétés en traction, conditions d‟essai pour les <strong>composite</strong>s plastiques renforcés de fibres<br />
unidirectionnelles, juillet 1997<br />
[8] Renard J, Favre J.P., Jeggy Th. Influence <strong>of</strong> transverse cracking o, ply <strong>behaviour</strong>: introduction <strong>of</strong> a characteristic damage variable.<br />
Composite Science and Technology, Vol. 46 (1993), pp. 29-37<br />
[9] Standard ASTM D 2290, Standard Test Method for Apparent Hoop Tensile Strength <strong>of</strong> Plastic or Reinforced Plastic Pipe by Split Disk<br />
Method, January 2004<br />
[10] Evstatiev M., Friedrich K., Fakirov S. Crystallinity Effect on Fracture Rings made <strong>of</strong> Thermoplastic Powder impregnated Carbon or Glass<br />
Fiber. Composites International Journal <strong>of</strong> Polymeric Material, Vol. 21 (1993), pp 177-187<br />
[11] Takeda N., Okabe Y., Mizutani T. Damage detection in <strong>composite</strong> using optical fibre sensors. Proc. IMechE Part G: Aerospace<br />
Engineering, Vol. 221 (2007), pp. 497-507<br />
[12] Okabe Y., Mizutani T., Yashiro S., Takeda N. Detection <strong>of</strong> Microscopic damages in <strong>composite</strong> laminates with embedded small-diameter<br />
fiber Bragg grating sensors. Composites Science and Technology, Vol. 62 (2002), pp. 951-958<br />
[13] Takeda N., Okabe Y. KuwaharaJ., Kojima S., Ogisu T. Development <strong>of</strong> smart <strong>composite</strong> structures with small-diameter fiber Bragg<br />
grating sensors for damage detection: Quantitative evaluation <strong>of</strong> delamination length in CFRP laminates using Lamb wave sensing.<br />
Composites Science and Technology, Vol. 65 (2005), pp. 2575-2587<br />
[14] Takeda S., Okabe Y., Takeda N. Delamination detection in CFRP laminates with embedded small-diameter fiber Bragg grating sensors.<br />
Composites: Part A 33, Vol. 33 (2002), pp. 971-980
Abstract<br />
Residual life predictions <strong>of</strong> repaired fatigue cracks<br />
H Wu *, A Imad, N Benseddi<br />
Mechanics Laboratory <strong>of</strong> Lille, Ecole Polytech’Lille, France<br />
The stop-hole method is a simple and economic repair technique widely used to retard or even to stop the propagation<br />
<strong>of</strong> a fatigue crack that cannot be replaced immediately after the detection <strong>of</strong> the crack. Its principle is to drill a hole at or<br />
close to the crack tip to eliminate the stress concentration there and so stop the crack propagation. To study the<br />
effectiveness <strong>of</strong> this repair method, classical N techniques are adapted to explain the results <strong>of</strong> several experiments<br />
carried out on aluminium plates, taking into account short crack concepts. This is a simple and reliable calculation<br />
method to predict beforehand the results <strong>of</strong> this practical emergency repair which can be quite useful in real-life situations.<br />
The aim <strong>of</strong> the present work is to predict the fatigue crack initiation lives by employing the analytical modelling based on<br />
the classical N theory and short crack theory for aluminium 6082 T6. The comparison among the experimental and the<br />
calculation results show that the life increment caused by the stop-holes can be effectively predicted in this way.<br />
Keywords: stop-hole; crack repair; N method; short cracks<br />
1. Introduction<br />
The stop-hole method is a popular emergency repair technique to extend the fatigue life <strong>of</strong> cracked<br />
structural components [1]. A simple and reliable calculation method to predict beforehand the results <strong>of</strong><br />
this practical emergency repair technique can be quite useful in real-life situations. However, the<br />
appropriate modelling <strong>of</strong> this problem is not that simple. As a general rule, the increase <strong>of</strong> the stop-hole<br />
diameter contributes to decrease the value <strong>of</strong> the stress concentration factor Kt <strong>of</strong> the resulting notch, but<br />
it also increases the nominal stresses in the residual ligament <strong>of</strong> the repaired component. While small<br />
stop-hole diameters are associated with smaller notch sensitivities q, which decrease the resulting Kt<br />
effect in the fatigue crack (re)initiation life. This effect is quantified by the so-called fatigue stress<br />
concentration factor Kf, classically defined by [2-3]<br />
Kf = 1 + q(Kt- 1) (1)<br />
However, when a long crack is repaired by a relatively small stop-hole, it forms an elongated notch<br />
with a high Kt, which is associated with a steep stress/strain gradient around its root. Consequently, its<br />
notch sensitivity q cannot be well predicted by the classical Peterson recipe [4]. Therefore, the model<br />
for predicting the residual fatigue life <strong>of</strong> repaired cracked structures must take this fact into account, as<br />
shown below.<br />
* E-mail address: wuhao-2009@hotmail.com
368<br />
2. Experimental program<br />
Fifth International Conference on <strong>Fatigue</strong> <strong>of</strong> Composites<br />
A set <strong>of</strong> experiments was carried out on SE(T) specimens with thickness B = 8 mm and width W = 80<br />
mm, (see Fig. 1), to measure the delays associated with the re-initiation <strong>of</strong> a fatigue crack after drilling a<br />
stop-hole centred at the crack tip <strong>of</strong> length a. The tested material was an Al alloy 6082 T6. The<br />
specimens were cut on the LT direction, and the fatigue tests were carried out <strong>under</strong> constant load range<br />
P at R = Pmin/Pmax = 0.57. This high R-ratio was chosen to avoid any crack closure interference on the<br />
crack propagation behavior.<br />
The 2, 5 or 6 mm stop-holes were carefully centered and drilled at the fatigue crack tips. The load<br />
range P was always maintained constant, before and after the drilling <strong>of</strong> the stop-holes.<br />
3 The basic stop-hole model<br />
Fig. 1. The tested specimens.<br />
The fatigue crack re-initiation lives at the stop-hole roots can be modeled by N local strain<br />
procedures, using (i) the cyclic properties <strong>of</strong> the 6082 T6 Al alloy, H’ = 443 MPa, h’ = 0.064, ’f = 485<br />
MPa, b=-0.0695, ’f = 0.733, c =-0.827, where ’f, b, ’f and c are the C<strong>of</strong>fin-Manson parameters and<br />
H’ and h’ are the coefficient and the exponent <strong>of</strong> the cyclic stress-strain curve fitted by<br />
Ramberg-Osgood; (ii) the nominal stress history (see table 3); and (iii) the stress concentration factor Kt<br />
<strong>of</strong> the notches generated by repairing the cracks drilling a stop-hole at their tips. Such factors can be<br />
estimated by Inglis, giving for hole radii =1, 2.5 or 3 mm, respectively<br />
Kt 1 + 2 a / = 11.49, 7.63 or 7.06 (2)<br />
The classical N models neglect hardening transients, supposing that the fatigue behavior can be<br />
described by an unique Ramberg-Osgood cyclic stress/strain curve, whose parameters H’ and h’ can<br />
also be used to describe the elastic-plastic hysteresis loop curves. These equations should model<br />
both the nominal and the notch root cyclic stress/strain behavior, to avoid the logical inconsistency <strong>of</strong>
H Wu, A Imad, N Benseddi / Residual life predictions <strong>of</strong> repaired fatigue cracks<br />
using two different models for describing the same material (Hookean for the nominal and<br />
Ramberg-Osgood for the notch root stresses), and also to avoid the significant prediction errors that can<br />
be introduced at higher nominal loads by such a regrettably widespread practice [5].<br />
All the required fatigue life calculations were made using the ViDa s<strong>of</strong>tware. For the two bigger<br />
stop-holes the predictions reproduce quite well the measured fatigue crack re-initiation lives. But the<br />
predictions obtained by the same calculation procedures for the smaller stop-hole with = 1.0mm are<br />
much more conservative.<br />
4. Analytical prediction <strong>of</strong> the notch sensitivity<br />
Long cracks grow <strong>under</strong> a given and R set when K = (a)f(a/w) > Kth(R), where Kth(R)<br />
is the propagation threshold at that R-ratio. Therefore, short cracks (which have a 0) must propagate in<br />
an intrinsically different way, as otherwise K(a 0, R) > Kth(R) , which is a non-sense, as<br />
a stress range > 2SL(R) can generate and propagate a fatigue crack, where SL(R) is the fatigue limit<br />
<strong>of</strong> the material at R. To conciliate the fatigue limit (e.g.) at R = 0, S0 = 2SL(0), with the propagation<br />
threshold <strong>under</strong> pulsating loads K0 = Kth(0), a small “short crack characteristic size” a0 were summed<br />
to the actual crack size a in [6] so as to obtain<br />
2<br />
1 K<br />
K (a a ), where a<br />
0 <br />
I = + 0 0 = <br />
f ( a w ) S0<br />
<br />
These equations correctly predicted that the biggest stress range, which does not propagate a<br />
microcrack, is the fatigue limit: if a
370<br />
Fifth International Conference on <strong>Fatigue</strong> <strong>of</strong> Composites<br />
initiate at the notch root but do not propagate if 2SL Kt 2SL K f [5]. E.g., the stress intensity<br />
factor <strong>of</strong> a crack that departs from a circular hole <strong>of</strong> radius in a Kirsh (infinite) plate loaded in mode I<br />
is given by [8]<br />
where (a/) (x) is given by:<br />
( ) ( )<br />
KI = a a = 1.1215 a a<br />
(7)<br />
2 3<br />
0.2 0.3 x x x <br />
<br />
(<br />
x ) = 1+ + 2-<br />
2.354 + 1.206 -0.221<br />
<br />
(1 x ) (1 x )<br />
6<br />
<br />
+ +<br />
1+ x 1+ x 1+ x <br />
<br />
Note that lim KI = 1.1215 3 a and lim KI = a 2 , exactly as expected. Thus, if a0 =<br />
a0 a<br />
(K0/S0) 2 , any crack departing from a Kirsh hole will propagate when<br />
/2<br />
-1/<br />
<br />
KI = ( a ) a Kth = K0<br />
1+ ( a0 a)<br />
<br />
<br />
The propagation criterion for these fatigue cracks can then be rewritten as [5]<br />
( )<br />
K0 S0<br />
<br />
a S0 <br />
a S0 K<br />
<br />
<br />
<br />
g , ,<br />
0 <br />
, <br />
<br />
<br />
<br />
1/ <br />
<br />
<br />
S0 <br />
a K<br />
0 <br />
<br />
<br />
<br />
<br />
+ <br />
S0 <br />
<br />
In other words, if x a/ and K0/S0, a fatigue crack departing from a Kirsch hole grows<br />
whenever (x) > g(x, S0/, , ) /g > 1. Fig. 4 plots some /g functions for several fatigue<br />
strength to <strong>loading</strong> stress range ratios S0/ as a function <strong>of</strong> the normalized crack length x a/,<br />
assuming a material/notch combination with = 1.5 and = 6.<br />
For high applied stress ranges , the strength to load S0/ ratio is small, and the corresponding <br />
/g curve is always higher than 1, which means that cracks will initiate and propagate from the Kirsch<br />
hole border, without stopping during this process. One example <strong>of</strong> such a case is the upper curve in Fig.<br />
2, which shows the function /g1.4 obtained for S0/ = 1.4. On the other hand, small stress ranges <br />
with load ratios S0/ Kt = 3 have /g functions which are smaller than 1, meaning that no crack<br />
will initiate from the Kirsch hole, and that small enough cracks will not propagate from it at such lo<br />
loads. This is illustrated by curves /g3, associated with the limit case S0/ = 3, and /g4, associated<br />
with S0/ = 4.<br />
But three other cases must be noted in Fig.2. The first crosses once the /g = 1 line, see the /g2.3<br />
curve, meaning such an intermediate load range can initiate and propagate a fatigue crack from the<br />
notch border until the decreasing /g2.3 value reaches 1, where the crack stops. Thus, this <strong>loading</strong> level<br />
generates a non-propagating fatigue crack at the notch border due to the crack tip stress gradient effect,<br />
with a size given by the corresponding a = x abscissa.<br />
(8)<br />
(9)<br />
(10)
H Wu, A Imad, N Benseddi / Residual life predictions <strong>of</strong> repaired fatigue cracks<br />
Fig. 2. The fatigue stress concentration factor Kf can be obtained by finding the function /g which is tangent to the /g =1 line,<br />
thus in this case Kf = 1.64.<br />
The second, illustrated in Fig. 2 by the /g1.85 curve, intersects the /g =1 line twice. Therefore, this<br />
load level will also generate a fatigue crack at the Kirsch hole border, which will propagate until<br />
reaching the maximum size obtained from the abscissa <strong>of</strong> the first intersection point (on the left), where<br />
the crack stops. Moreover, cracks longer than the size defined by the abscissa <strong>of</strong> the second intersection<br />
point will re-start propagating by fatigue <strong>under</strong> = S0/1.85 until eventually fracturing the Kirsch<br />
plate. However, the crack initiated by fatigue <strong>under</strong> such load cannot propagate between these two<br />
intersection points by fatigue alone (assuming remains constant). Hence, it can only grow in this<br />
region if driven by a different mechanism, such as corrosion or creep, for example.<br />
These two cases seem different, yet they are similar: the /g2.3 curve will cross the /g =1 line twice<br />
if the graph is extended to larger x a/ values, because a sufficiently long crack can always propagate<br />
by fatigue <strong>under</strong> a given (even if small) range whenever its SIF range K = (a) grows with<br />
the crack size a, as in this Kirsch plate. In fact, all /g curves start at Kt/S0 and a = 0, and become<br />
higher than 1 for sufficiently large a/ values.<br />
Finally, the /g1.64 curve is tangent to the /g =1 line, meaning that this = S0/1.64 is the smallest<br />
stress range that can cause crack initiation and propagation without arrest from the notch border. In<br />
other words, by definition, the Fig. 2 Kirsch hole fatigue SCF is given by Kf = S0/ = 1.64. Moreover,<br />
the abscissa xmax <strong>of</strong> the tangency point between the /g1.64 curve and the /g =1 line gives the largest<br />
non-propagating crack that can arise from it by fatigue alone, amax = xmax. Therefore, the Kf and amax<br />
can be found by solving the system.<br />
Therefore, Kf = S0/ can be calculated from the material fatigue limit S0 and crack propagation<br />
threshold K0, and from the geometry <strong>of</strong> the cracked piece by<br />
( a ) = g( a , S 0 <br />
, K0 S 0 , )<br />
<br />
<br />
( a )<br />
<br />
<br />
= g( a , S 0 <br />
, K0 S 0 , )<br />
a a<br />
371<br />
(11)
372<br />
Fifth International Conference on <strong>Fatigue</strong> <strong>of</strong> Composites<br />
The stress intensity factor <strong>of</strong> a crack a which departs from such a notch with semi-axes b e c, with a and<br />
b in the same direction perpendicular to the (nominal) stress , is given by:<br />
K = F ( a b ,c b) a<br />
(12)<br />
I<br />
where = 1.1215 is the free surface correction factor and F(a/b, c/b) is the geometric factor associated<br />
to the notch stress concentration, which can be calculated as a function <strong>of</strong> the non-dimensional<br />
parameter s = a/(a + b) and <strong>of</strong> Kt, given by [8]<br />
( )<br />
K 1 2<br />
b<br />
1<br />
0.1215<br />
t = + +<br />
<br />
c <br />
(1 c b )<br />
2.5 <br />
+ <br />
An analytical expression for the F(a/b, c/b) <strong>of</strong> deep semi-elliptical notches with c b was fitted to a<br />
series <strong>of</strong> finite element numerical calculations<br />
(13)<br />
2<br />
a c 1- exp( -K s )<br />
F( , ) f ( K ,s) K<br />
t <br />
<br />
b b<br />
t = t<br />
, for c b (14)<br />
K2 t s<br />
Making g = and g/a = /a in (11), one can calculate the smallest stress range required to<br />
initiate and propagate a crack from the notch root at a given combination <strong>of</strong> and K0/S0, which<br />
can be used to calculate Kf = S0/ and q. Indeed, a short crack a < ast departing from the notch<br />
boundary stops when it reaches<br />
5. Notch sensitivity for semi-elliptical notches<br />
2<br />
1/ <br />
K I ( a st ) ast K0<br />
1 ( a0 a st )<br />
<br />
-<br />
= = +<br />
<br />
<br />
Traditional notch sensitivity estimates assume that q depends only on the notch root and on the<br />
material ultimate strength SU. Thus, similar materials with the same SU but different K0 should have<br />
identical notch sensitivities, according to these estimates. And it also happens to the materials with<br />
shallow and deep or elongated notches <strong>of</strong> identical tip radii. However, it must be mentioned that well<br />
established empirical relations relate the fatigue limit S0 to SU, but there is no such relation between<br />
the FCP threshold K0 and SU. Moreover, it is also important to point out that the q estimation for<br />
elongated notches by the traditional procedures can generate questionable Kf values, as discussed above.<br />
The proposed model, on the other hand, recognizes that the q values <strong>of</strong> semi-elliptical notches, not only<br />
depend on , S0, K0 and , but also strongly depend on the c/b ratio, see Fig.3. The curves shown in<br />
this figure are calculated for typical aluminum alloys which have mean SU = 225MPa, fatigue limit SL =<br />
90MPa S0 = 2SLSR/(SL + SR) = 129MPa, propagation threshold K0 = 2.9MPam, = 6, and short<br />
crack length parameter a0 = 0.26mm. Their corresponding Peterson‟s curve is well approximated by the<br />
semi-circular c/b = 1 notch, but this curve is not applicable for high c/b ratios. Therefore, the proposed<br />
predictions indicate that these old estimates should not be used for elongated notches, a prediction<br />
experimentally verifiable, as discussed in the following section.<br />
(15)
H Wu, A Imad, N Benseddi / Residual life predictions <strong>of</strong> repaired fatigue cracks<br />
Fig. 3. Notch sensitivity q as a function <strong>of</strong> the semi-elliptical notch root radius = c 2 /b for aluminum alloys having a0 = 0.26mm (Su 225MPa).<br />
6. The improved stop-hole model<br />
An improved model for predicting the effect <strong>of</strong> the stop holes on the crack re-initiation fatigue lives<br />
can be generated by using: (i) a semi-elliptical notch with b = 27.5mm and = c 2 /b = 1, 2.5 or 3mm to<br />
simulate the stop-hole repaired specimens; (ii) the mechanical properties <strong>of</strong> the 6082 T6 Al alloy studied<br />
in this work; (iii) equation (11) to calculate the notch sensitivity and equation (15) for the stress<br />
intensity factor <strong>of</strong> the repaired specimens; and finally (iv) Kf instead <strong>of</strong> Kt in the N model.<br />
The predictions generated by such an improved model are presented in Fig. 4-6. Since q 1 for the <br />
= 3.0 and = 2.5mm stop-holes, the predictions obtained using their calculated Kf = 7.0 and Kf = 7.2,<br />
respectively, are as good as those obtained using their estimated Kt. However, the overly conservative<br />
initial predictions for the smaller = 1mm stop-hole, which were generated using its estimated Kt 11.5,<br />
are much improved when the notch sensitivity effect quantified by its properly calculated Kf = 8.3 is<br />
used in the fatigue crack re-initiation calculations.<br />
Fig. 4. Predicted and measured crack re-initiation lives at the stop-holes roots <strong>of</strong> radius = 3.0mm, using the Kf (instead <strong>of</strong> Kt) <strong>of</strong> the repaired<br />
crack.<br />
373
374<br />
Fifth International Conference on <strong>Fatigue</strong> <strong>of</strong> Composites<br />
Fig. 5. Predicted and measured crack re-initiation lives at the stop-holes roots <strong>of</strong> radius = 2.5mm, using the Kf (instead <strong>of</strong> Kt) <strong>of</strong> the repaired<br />
crack.<br />
Fig. 6. Predicted and measured crack re-initiation lives at the stop-holes roots <strong>of</strong> radius = 1.0mm,<br />
using the Kf (instead <strong>of</strong> Kt) <strong>of</strong> the repaired crack.<br />
The Al 6082 T6 fatigue limit and fatigue crack propagation threshold <strong>under</strong> pulsating loads required<br />
to calculate Kf are estimated as K0 = 4.8 MPam and S0 = 110MPa, following traditional structural<br />
design practices [7-8], and the Bazant‟s exponent was chosen, as recommended by [5], as = 6.<br />
7. Conclusion<br />
Classical N techniques were used with properly estimated properties to reproduce the measured<br />
fatigue crack re-initiation lives after stop-hole repairing several modified SEN(T) specimens. The<br />
predicted lives were not too dependent on the mean load N model, and the larger stop-hole measured<br />
lives could be well reproduced using the stress concentration factor Kt in the Neuber/Ramberg-Osgood<br />
system. But such an approach yielded grossly conservative prediction for the smaller stop-hole life<br />
improvements. This problem was solved using the fatigue stress concentration factor Kf <strong>of</strong> the resulting<br />
notch instead <strong>of</strong> Kt in that system. The predicted notch sensitivities reproduce well the classical
H Wu, A Imad, N Benseddi / Residual life predictions <strong>of</strong> repaired fatigue cracks<br />
Peterson‟s q estimates for circular holes or approximately semi-circular notches, but it is found that the<br />
notch sensitivity <strong>of</strong> elongated slits has a very strong dependence on the notch aspect ratio, defined by<br />
the ratio c/b <strong>of</strong> the semi-elliptical notch that approximates the slit shape having the same tip radius.<br />
These predictions are confirmed by experimental measurements <strong>of</strong> the re-initiation life <strong>of</strong> long fatigue<br />
cracks repaired by introducing a stop-hole at their tips, using their calculated Kf and appropriate N<br />
procedures.<br />
References<br />
[1] SONG, P.S.; SHIEH, Y.L. Stop drilling procedure for fatigue life improvement. Int. J. <strong>Fatigue</strong> v.26(12), p.1333-1339, 2004.<br />
[2] PETERSON, R.E. Stress Concentration Factors, Wiley 1974.<br />
[3] SHIGLEY, J.E.; MISCHKE, C.R.; BUDYNAS, R.G. Mechanical Engineering Design, 7th ed., McGraw-Hill 2004.<br />
[4] MEGGIOLARO, M.A.; MIRANDA, A.C.O.; CASTRO, J.T.P. Short crack threshold estimates to predict notch sensitivity factors in<br />
fatigue. Int. J. <strong>Fatigue</strong> v.29(9-11), p.2022-2031, 2007.<br />
[5] MEGGIOLARO, M.A.; CASTRO, J.T.P. Evaluation <strong>of</strong> the errors induced by high nominal stresses in the classical N method, in<br />
Blom,AF ed. <strong>Fatigue</strong> 2002(2), p.1451-1458, EMAS 2002.<br />
[6] EL HADDAD, M.H.; TOPPER, T.H.; SMITH, K.N. Prediction <strong>of</strong> non-propagating cracks. Eng. Fract. Mech. v11, p.573-84, 1979.<br />
[7] BAZANT, Z.P. Scaling <strong>of</strong> quasibrittle fracture: asymptotic analysis. Int. J. Fracture v.83(1), p.19-40, 1997.<br />
[8] TADA, H.; PARIS, P.C.; IRWIN, G.R. The stress analysis <strong>of</strong> cracks handbook. Del Research; 1985.<br />
375
Monotonic and cyclic deformation behavior <strong>of</strong> ultrasonically<br />
welded hybrid joints between light metals and carbon fiber<br />
reinforced polymers (CFRP)<br />
Abstract:<br />
F Balle *, D Eifler<br />
Institute <strong>of</strong> Materials Science and Engineering, University <strong>of</strong> Kaiserslautern, Kaiserslautern 67663, Germany<br />
In the present work, hybrid joints between the aluminum alloy 5754 and carbon fiber reinforced polyamide 66 has<br />
been joined by ultrasonic metal welding. Selected surface pre-treatments <strong>of</strong> the metallic surface were investigated to<br />
increase the joint strength and optimize the ageing behavior <strong>of</strong> the welds. Light and scanning electron microscopy were<br />
used to <strong>under</strong>stand the bonding mechanisms in detail. Beside the monotonic properties the cyclic deformation behavior <strong>of</strong><br />
ultrasonic welded aluminum/CFRP-joints were investigated in this work. Therefore load-increase- as well as single-step<br />
tests were performed with a servohydraulic testing system at a frequency <strong>of</strong> 5 Hz. The endurance limit <strong>of</strong><br />
AA5754/CF-PA66-joints <strong>under</strong> cyclic tensile shear load (R > 0) was determined to about 35% <strong>of</strong> the monotonic tensile<br />
shear strength.<br />
Keywords: Ultrasonic welding; multi-material design; fatigue <strong>of</strong> welded structures; load increase tests<br />
1. Introduction<br />
The current demand for lightweight structures leads to an increasing application <strong>of</strong> materials like<br />
aluminum, magnesium and fiber reinforced polymers (FRP) and their combinations. Hence the<br />
predominant aim <strong>of</strong> innovative products in the automotive and aircraft industry but also in railway<br />
transportation and engineering in general is the reduction <strong>of</strong> the weight <strong>of</strong> the components. For the<br />
development <strong>of</strong> new lightweight products a detailed knowledge <strong>of</strong> monotonic and cyclic deformation<br />
behavior <strong>of</strong> joints made <strong>of</strong> dissimilar materials is obligatory. To fulfill these challenges appropriate<br />
joining techniques are necessary.<br />
Ultrasonic welding is a pressure welding technique, whereby the formation <strong>of</strong> the bond occurs as a<br />
result <strong>of</strong> a static welding force and a superimposed ultrasonic oscillation [1]. In comparison to other<br />
joining techniques like adhesive bonding or brazing, ultrasonic welding is characterized by a low energy<br />
input, consequently low temperatures in the welding zone and short welding times. Current applications<br />
<strong>of</strong> this technology are plastic as well as metal welding [2, 3]. Until now ultrasonic plastic welding is<br />
typically used to join FRP to each other, but in the case <strong>of</strong> metal/FRP-joints the ultrasonic plastic<br />
welding method only enables joints between metal and polymer matrix and not directly with the load<br />
bearing fibers <strong>of</strong> the FRP. Recent results show, that beside compact glass also glass or carbon fiber<br />
textiles with or even without thermoplastic as well as thermosetting matrix can be welded to metals by<br />
* E-mail address: balle@mv.uni-kl.de. Tel: +49-(0)631-205 2413.
F Balle, D Eifler / Monotonic and cyclic deformation behavior <strong>of</strong> ultrasonically welded hybrid joints between light metals and CFRP<br />
ultrasonic metal welding [3-7]. Recent investigations at the WKK show that ultrasonic metal welding is<br />
a suitable alternative to join CFRP with sheet metals like aluminum alloys or aluminum plated steel<br />
[8-10]. In this paper the ultrasonic welding technology was investigated systematically for joining<br />
aluminium alloys to carbon fiber reinforced thermoplastic polymers (CFRP). In the following the<br />
ultrasonic metal welding technology as well as monotonic and fatigue properties <strong>of</strong> the realized joints<br />
are presented.<br />
2. Materials and methods<br />
2.1 Parent Materials<br />
Within the scope <strong>of</strong> the present work aluminum sheets are welded directly on the fiber reinforcement<br />
<strong>of</strong> the CFRP organic sheets. The aluminum wrought alloy (AA5754) was used to be welded onto the<br />
thermoplastic <strong>composite</strong> made <strong>of</strong> polyamide 66 (PA66) with a satin fabric <strong>of</strong> carbon fibers (Toray<br />
T300J). Selected mechanical properties <strong>of</strong> the parent materials are summarized in table 1. The tensile<br />
tests were performed in rolling direction <strong>of</strong> the Al-sheet and in filling direction <strong>of</strong> the carbon fabric in<br />
case <strong>of</strong> the CFRP sheet.<br />
Young´s<br />
Modulus<br />
E<br />
[GPa ]<br />
Table 1. Monotonic mechanical properties <strong>of</strong> the base materials<br />
0.2 % Yield<br />
Strength<br />
R p0.2<br />
[MPa ]<br />
Ultimate<br />
Tensile Strength<br />
UTS<br />
[MPa]<br />
AA5754 H22 70 177 250 13.5<br />
CF-PA66 55 / 580 1.1<br />
Ultimate<br />
Elongation<br />
A<br />
[%]<br />
The Al-sheets AA5754 were welded in work-hardened, thermal-s<strong>of</strong>tened and quarter-hard condition<br />
(H22). The rolling direction is clearly shown by elongated grains in the longitudinal section <strong>of</strong> AA5754,<br />
see Figure 1a). Furthermore small intermetallic precipitations <strong>of</strong> type (Fe, Mn)Al 6 (Fe, Mn)3SiAl12,<br />
Mg2Si and Al3Mg2 were determined in previous TEM studies [4].<br />
a) b)<br />
Fig. 1. Micrographs <strong>of</strong> the parent materials: a) AA5754 H22, b) CFRP (matrix: PA66).<br />
In Figure 1b) a cross section <strong>of</strong> the CFRP organic sheet is shown. The fiber reinforcement <strong>of</strong> the<br />
CFRP is a C-textile Satin 5H-fabric with a weight per unit area <strong>of</strong> 285 g/m². The fiber volume fraction<br />
<strong>of</strong> the 2 mm thick organic sheets is about 48%. It was manufactured in an autoclave process by using six<br />
377
378<br />
Fifth International Conference on <strong>Fatigue</strong> <strong>of</strong> Composites<br />
layers <strong>of</strong> CF-fabric at the University <strong>of</strong> Kaiserslautern in the framework <strong>of</strong> the research unit 524<br />
supported by the German Research Foundation (DFG).<br />
2.2 Ultrasonic welding system, specimen geometry and design <strong>of</strong> experiments<br />
For the present investigations modified and optimized industrial ultrasonic spot metal welding<br />
systems were used to join the aluminum wrought alloy (AA5754) and carbon fiber reinforced<br />
thermoplastic <strong>composite</strong>s (CFRP) with PA66 matrix. One essential requirement is to control the welding<br />
force during the joining process accurately by an integrated force measuring device. Therefore a special<br />
clamping system was developed at the WKK, see Figure 2a). Furthermore, the welding system is<br />
equipped with several measuring devices to enable a high-resolution measurement <strong>of</strong> the main process<br />
parameters like welding force and welding energy. The specimen geometry is shown in Figure 2b). The<br />
welding area <strong>of</strong> the sonotrode is 10 x 10 mm². Since it is not possible to determine the exact geometry<br />
<strong>of</strong> the joining area the shear strength is calculated by the ratio <strong>of</strong> the achieved tensile shear force related<br />
to the nominal sonotrode contact area.<br />
(a) (b)<br />
Fig. 2. a) Ultrasonic spot welding system for hybrid joints, b) Specimen geometry.<br />
To identify suitable welding parameters for Al/CFRP-joints a statistical model named "central<br />
<strong>composite</strong> design circumscribed (CCC)" was used. In comparison to a stepwise variation <strong>of</strong> each<br />
welding parameter, this model for non-linear relationships allows to find the optimum parameters with<br />
considerably less welding steps. A further important advantage <strong>of</strong> the CCC-model is the description <strong>of</strong><br />
the mutual dependence <strong>of</strong> the three central welding parameters oscillation amplitude, welding force and<br />
energy in relation to the achievable tensile shear strength <strong>of</strong> the joints [10]. The design <strong>of</strong> the<br />
CCC-model is based on the three significant process parameters mentioned above with five different<br />
settings for each. The suitable ranges <strong>of</strong> the process parameters, which allow high strength joints, were<br />
estimated in preliminary investigations. For joints <strong>of</strong> AA5754 and CF-PA66 <strong>composite</strong>s appropriate<br />
welding parameters for the force FUS ranges between 100 N and 220 N, for the amplitude u between<br />
37 µm up to 43 µm and for the energy WUS between 1700 Ws and 2300 Ws. The used CCC-model leads<br />
to 18 different parameter triples and allows to reduce the necessary welds at a factor <strong>of</strong> 7 in comparison<br />
to a conventional stepwise procedure. Simultaneously the reproducibility <strong>of</strong> the joint strength could be
F Balle, D Eifler / Monotonic and cyclic deformation behavior <strong>of</strong> ultrasonically welded hybrid joints between light metals and CFRP<br />
improved. All combinations <strong>of</strong> the welding parameters were proved in tensile shear tests. For each<br />
parameter combination twelve welds were performed at least.<br />
In basic investigations it was proved that thermoplastic carbon fiber <strong>composite</strong>s can be welded to<br />
aluminum alloys by using ultrasonic plastic or ultrasonic metal welding. In comparison to ultrasonic<br />
plastic welding, 100% higher tensile shear strengths can be achieved by using ultrasonic metal welding<br />
[6]. The advantage <strong>of</strong> an ultrasonic oscillation parallel to the surface <strong>of</strong> the joining partners, which is<br />
typical for ultrasonic metal welding, is the possibility to realise a direct contact between the metal and<br />
the load bearing fibers <strong>of</strong> the reinforced <strong>composite</strong>. Thereby the welding process does not damage any<br />
fibers. By scanning electron micrographs (SEM) <strong>of</strong> the welding zones it is shown that the ultrasonic<br />
metal welding process removes the matrix between the fiber reinforcement and the metal, whereby the<br />
metallic surface gets into contact to the fibers [7-10].<br />
2.3 Setup for fatigue testing<br />
A servo-hydraulic testing system <strong>of</strong> the type MTS 858 was used to examine the fatigue behavior <strong>of</strong><br />
ultrasonically welded Al/CFRP-joints. For single overlap samples the hydraulic grip was modified and<br />
adjusted by a bending strut to avoid bending stresses (see figure 3a). A constraint in <strong>loading</strong> direction is<br />
prohibited by the use <strong>of</strong> Teflon disks. The cyclic <strong>loading</strong> was performed with a frequency <strong>of</strong> 5 Hz. A<br />
stress ratio <strong>of</strong> R ≥ 0 was selected to realize application-oriented conditions for single overlap joints.<br />
First, the cyclic deformation behavior was investigated by stepwise load increase tests (LIT).<br />
Therefore the force amplitude Fa was increased stepwise at125 N from an initial value <strong>of</strong> 100 N up to<br />
the failure <strong>of</strong> the joint. The length <strong>of</strong> each load step was fixed with 10 4 cycles. The maximum number <strong>of</strong><br />
cycles was 2 × 10 6 .<br />
Based on the LIT selected single step tests (SST) were performed with the same test conditions. The<br />
cyclic displacement was measured as a function <strong>of</strong> the force amplitude with strain gauges mounted onto<br />
the surface <strong>of</strong> the aluminum and CFRP sheets in the area <strong>of</strong> the sonotrode tip, see figure 3b).<br />
a) b)<br />
Fig. 3. a) <strong>Fatigue</strong> testing system for single overlap joints, b) Displacement measurement setup (schematic).<br />
Data logging and evaluation were realized with a LabView-based s<strong>of</strong>tware, which was developed at<br />
the Institute <strong>of</strong> Materials Science and Engineering (University <strong>of</strong> Kaiserslautern).<br />
379
380<br />
3. Results and discussion<br />
Fifth International Conference on <strong>Fatigue</strong> <strong>of</strong> Composites<br />
3.1 Monotonic properties <strong>of</strong> ultrasonically welded AA5754/CF-PA66-joints<br />
In this paper selected results <strong>of</strong> joints between AA5754 and the <strong>composite</strong> CF-PA66 are represented.<br />
Figure 4 shows the tensile shear strengths for a constant welding energy WUS <strong>of</strong> 2160 Ws. Tensile<br />
strengths are calculated by the ratio <strong>of</strong> the achieved tensile shear force related to the area <strong>of</strong> the welding<br />
tool, the sonotrode with 100 mm².<br />
Fig. 4. Contour plot (WUS = 2160 Ws) to find suitable process parameters for A5754/CF-PA66-joints.<br />
A maximum average tensile shear strength <strong>of</strong> 31.5 MPa can be determined slightly right to the centre<br />
<strong>of</strong> the diagram. However two-dimensional cuts <strong>of</strong> the diagram are necessary to ascertain the welding<br />
parameters exactly. In Figure 5 the course <strong>of</strong> the tensile shear strength for the three important process<br />
parameters welding force, oscillation amplitude and welding energy are shown separately. In every case<br />
two process parameters are constant. For example, on the left-hand side the oscillation amplitude u was<br />
varied between 38 and 42 µm. Besides the course <strong>of</strong> the average tensile shear strength the lower and<br />
upper confidential interval for 95 % is specified. An increasing amplitude up to 40.5 µm causes an<br />
increased displacement <strong>of</strong> the matrix <strong>of</strong> the CFRP and a better contact between the metal sheet and the<br />
fibers. As a result the tensile shear strength <strong>of</strong> the joints increases. After the peak value a damage <strong>of</strong> the<br />
textile and thus a decrease <strong>of</strong> the tensile shear strength occur at still higher oscillation amplitudes. An<br />
optimum range appears for values around 40 µm. The variation <strong>of</strong> the welding energy and the welding<br />
force shows nearly the same tendencies.<br />
By using mechanical (corundum blasting, CB) and/or chemical (acid pickling, AP) surface<br />
pre-treatments <strong>of</strong> the aluminum sheets, the tensile shear strength <strong>of</strong> the joints can be increased up to<br />
54 MPa and furthermore the long-term stability can be improved significantly [8]. The surfaces <strong>of</strong> the<br />
pre-treated aluminium sheets were characterized by electron microscopy and described quantitatively by<br />
interferometry. In Figure 6 the four different surface conditions are shown. A comparison <strong>of</strong> as rolled<br />
surface with corundum blasted surface show a macroscopic roughness. The mean surface roughness R a<br />
is increased from 0.3 µm to 3.0 µm, see table 2. By acid pickling, the surface roughness is nearly not
F Balle, D Eifler / Monotonic and cyclic deformation behavior <strong>of</strong> ultrasonically welded hybrid joints between light metals and CFRP<br />
affected in a macroscopic manner, so that only selected peaks were removed and only the roughness<br />
pr<strong>of</strong>ile Rt falls from 1.7 to 1.2 µm. A combined pre-treatment leads to a surface with both effects. The<br />
ultrasonic spot welded joints were tested after ageing <strong>of</strong> one and four weeks at different temperatures<br />
and humidity. For a pure mechanical and a combined pre-treatment <strong>of</strong> the aluminum sheets (corundum<br />
blasting and pickling in nitric acid, CB&AP) nearly no decrease <strong>of</strong> the tensile shear strength was<br />
determined [9].<br />
Fig. 5. Single evaluation <strong>of</strong> oscillation amplitude, welding force and energy for AA5754/CF-PA66-joints by using statistical test planning.<br />
Fig. 6. Surface structure <strong>of</strong> pre-treated AA5754 sheets: a) initial state, as rolled (R); b) corundum blasted (CB); c) acid pickled (AP); d) CB & AP.<br />
Table 2. Comparison <strong>of</strong> induced roughness (in µm) by surface pre-treatment <strong>of</strong> AA5754<br />
AA5754 R CB AP CB & AP<br />
Mean surface roughness Ra 0.3 3.0 0.3 2.5<br />
Arithmetical roughness pr<strong>of</strong>ile Rt 1.7 12.5 1.2 12.7<br />
3.2 Microstructure <strong>of</strong> ultrasonically welded AA5754/CF-PA66-joints<br />
To <strong>under</strong>stand the microstructure <strong>of</strong> ultrasonically welded hybrid joints, it is necessary to evaluate the<br />
381
382<br />
Fifth International Conference on <strong>Fatigue</strong> <strong>of</strong> Composites<br />
initial state <strong>of</strong> the polymer joining partner. According to the satin fabric (Atlas 1/4) the polyamide layer<br />
thickness near the surface depends on the position in the CFRP sheet. The transition zone <strong>of</strong> the crimped<br />
fiber bundles is characterized by periodically returning layer thicknesses <strong>of</strong> about 250 µm. Nevertheless,<br />
the differently thick, but the fiber reinforcement covering polymer layer, is displaced by the ultrasonic<br />
transversal waves, in particular in the influencing area <strong>of</strong> the sonotrode, see figure 7.<br />
Fig. 7. Microstructure <strong>of</strong> the CF-PA66 sheet before and after ultrasonic welding.<br />
Digital image analysis clearly shows the reduction <strong>of</strong> the layer thickness within the range <strong>of</strong> the<br />
crimped fiber bundles by the ultrasonic welding process, but not a complete displacement overall. In<br />
Figure 8 micrographs <strong>of</strong> the two characteristic zones are shown. Especially on roughness peaks a direct<br />
contact between the carbon fibers and the aluminum surface was examined, see Figure 8a). In zones<br />
with a polymer layer up to 100 µm in thickness before welding, a direct contact is rarely possible. In<br />
zones between chaining and filling thread a polymer layer with a thickness <strong>of</strong> about 100 µm remains<br />
because <strong>of</strong> the maximum layer thickness in the initial state before welding, see figure 8b). So there is no<br />
direct contact between fibers and metal surface. In the polymer-rich zones an interface very similar to<br />
conventional plastic welding technique will be realized, therefore only adhesive bonding between<br />
polymer and aluminum occurs.<br />
Fig. 8. Micrographs <strong>of</strong> different positions in the joining zone <strong>of</strong> AA5754 (CB)/CF-PA66-joints:<br />
a) polymer poor joining zone, b) polymer rich joining zone.
F Balle, D Eifler / Monotonic and cyclic deformation behavior <strong>of</strong> ultrasonically welded hybrid joints between light metals and CFRP<br />
The ultrasonic metal welding technology differs clearly from conventional procedures to join sheet<br />
metals to fiber reinforced <strong>composite</strong>s. By using transversal shear waves the interface <strong>of</strong> polymer poor<br />
zones is characterized by a high plastic deformation <strong>of</strong> the aluminum surface. The fracture surface <strong>of</strong><br />
pre-treated AA5754/CFRP-joints shows several fiber bundles, which were pulled out during the tensile<br />
shear test, see figure 9. Furthermore characteristic marks <strong>of</strong> the satin fabric were investigated by<br />
scanning electron microscopy. Filling and chaining direction are labelled in figure 9 by circle and arrow.<br />
The micrograph with higher magnification on the right-hand side shows the pronounced contact <strong>of</strong> the<br />
fibers to the aluminum.<br />
Fig. 9. Fracture surface <strong>of</strong> ultrasonic welded AA5754(CB)/CF-PA66-joints after tensile shear test.<br />
3.3 Cyclic behavior <strong>of</strong> ultrasonically welded AA5754/CF-PA66-joints<br />
Beside the monotonic properties, the cyclic deformation behavior <strong>of</strong> the ultrasonic welded hybrid<br />
joints was investigated. Therefore only surface pre-treated AA5754 sheets were ultrasonically welded to<br />
the CFRP to avoid aging effects during cyclic <strong>loading</strong>. At first the fatigue behavior was observed in<br />
stepwise load increase tests (LIT) for the three different pre-treated aluminum sheets. The fracture <strong>of</strong> the<br />
single overlap joint in figure 10 was evaluated with a force amplitude <strong>of</strong> 1975 N equivalent to an upper<br />
force <strong>of</strong> 4000 N which is correlated to 80% <strong>of</strong> the monotonic tensile shear strength with 50 MPa.<br />
Analogue to the monotonic <strong>behaviour</strong> the fatigue fracture occurs in the joining interface between<br />
AA5754 and CFRP.<br />
The displacement was measured with strain gauges near to the tip <strong>of</strong> the sonotrode. Some cycles<br />
before failure a pronounced increase <strong>of</strong> the displacement amplitude was observed. Final failure is<br />
announced by very pronounced increase <strong>of</strong> the displacement amplitude.<br />
On the other hand the displacement amplitude, measured on the aluminum surface, decreases in the<br />
load step before final failure. This effect can be attributed to the single overlap geometry <strong>of</strong> the joint<br />
beside the fatigue damage in the joining zone. An increase <strong>of</strong> the tensile shear load leads to a gradual<br />
increase <strong>of</strong> the bending moment at the overlap ends <strong>of</strong> the specimens. This geometry induced influence<br />
was observed in all fatigue tests. A similar behavior was measured for chemical (AP) and combined<br />
mechanical and chemical pre-treated joints (CB & AP). In figures 11 and 12 the result <strong>of</strong> a characteristic<br />
load increase test for each combination are shown.<br />
383
384<br />
Fifth International Conference on <strong>Fatigue</strong> <strong>of</strong> Composites<br />
Fig. 10. Load-Increase-Test for corundum blasted AA57547CF-PA66-joint.<br />
Fig. 11. Load-Increase-Test for an acid pickled AA57547CF-PA66-joint.<br />
The maximum difference in the realized force amplitudes is in the range <strong>of</strong> about 125 N. Also in this<br />
case the fatigue fracture occurs in the ultrasonically welded interface.<br />
Additionally to the LIT single step tests (SST) with constant force amplitudes were performed to<br />
determine Woehler curves and fatigue life data. The load levels <strong>of</strong> each single step test were estimated<br />
in one load increase test for each surface condition.<br />
Fig. 12. Load-Increase-Test for an acid pickled and corundum blasted AA57547CF-PA66-joint.
F Balle, D Eifler / Monotonic and cyclic deformation behavior <strong>of</strong> ultrasonically welded hybrid joints between light metals and CFRP<br />
Figure 13 summarizes the results <strong>of</strong> single step tests in Fa-N-(Woehler)-Curves for<br />
AA5754/CF-PA66-joints with three different surface pre-treatments <strong>of</strong> the aluminum sheets. A cyclic<br />
force amplitude <strong>of</strong> 1475 N leads to fatigue failure after 10 5 cycles. At the force amplitude 2475 N the<br />
welded specimen reached only 10 3 cycles before a spontaneous failure occured. The corresponding<br />
upper force <strong>of</strong> 5000 N lies in the range <strong>of</strong> the maximum monotonic strength <strong>of</strong> the<br />
AA5754/CF-PA66-joints.<br />
The limiting number <strong>of</strong> cycles in the Woehler tests was 2 × 10 6 . For a force amplitude <strong>of</strong> 975 N, 2 ×<br />
10 6 cycles were reached without failure. These specimens are marked with arrows. Finally, the<br />
endurance limit <strong>of</strong> AA5754/CF-PA66-joints <strong>under</strong> cyclic tensile shear <strong>loading</strong> (R > 0) was determined<br />
to be approximately 35% <strong>of</strong> the monotonic tensile shear strength.<br />
Fig. 13. Fa-N (Woehler) -Curves <strong>of</strong> ultrasonically welded AA5754/CF-PA66-joints for different surface pre-treatments <strong>of</strong> the metallic joining<br />
partner.<br />
4. Conclusions<br />
For the first time the ultrasonic metal welding technique was successfully applied to join metal sheets<br />
with CFRP. Due to the ultrasonic welding process causes the polymer matrix is removed out <strong>of</strong> the<br />
welding zone. This allows a direct contact between the load bearing carbon fibers and the sheet metal<br />
without any damage <strong>of</strong> the carbon fiber reinforcement due to the process. With light and scanning<br />
electron micrographs as well as digital image analysis the microstructure <strong>of</strong> the welds was investigated<br />
in detail. Using the CCC-model it was possible to find optimum welding parameters with only 15% <strong>of</strong><br />
the tests in comparison to a common procedure. Tensile shear strengths <strong>of</strong> more than 30 MPa were<br />
realized for suitable process parameters with AA5754/CF-PA66-joints. This value can be increased up<br />
to 54 MPa by adapted surface pre-treatments <strong>of</strong> the sheet metal. Furthermore the long-term stability can<br />
be significantly influenced by these methods. The fatigue behavior <strong>of</strong> welded hybrid joints was<br />
investigated in load increase as well as single step tests at a servo-hydraulic test system for single<br />
overlap joints at a frequency <strong>of</strong> 5 Hz. The cyclic deformation behavior was described with<br />
displacement-force measurements with strain gauges on the surface <strong>of</strong> both joining partners. The<br />
endurance limit for ultrasonically welded hybrid structures was determined to be approximately 35% <strong>of</strong><br />
385
386<br />
Fifth International Conference on <strong>Fatigue</strong> <strong>of</strong> Composites<br />
the monotonic strength <strong>of</strong> surface pre-treated joints. The possibility to join different sheet metals to<br />
CFRP with high monotonic and cyclic strength allows a considerable extension <strong>of</strong> the application <strong>of</strong> the<br />
ultrasonic metal welding technique. Regarding the efficiency, automation, ecological compatibility and<br />
the achievable mechanical and technological properties ultrasonic metal welding is an attractive<br />
alternative to existing polymer joining techniques.<br />
Acknowledgements<br />
The authors would like to thank the German Research Society (DFG) for the financial support in the<br />
framework <strong>of</strong> the research unit 524. They further thank the state research “Center for Mathematical and<br />
Computational Modelling (CM)²” at the University <strong>of</strong> Kaiserslautern for the financial co-support.<br />
References<br />
[1] Graff, K. Ultrasonic metal welding. In: New developments in advanced welding, Woodhead Publishing, 2005, 241-269<br />
[2] Rotheiser, J., Joining <strong>of</strong> Plastics, Munich: Carl Hanser Verlag, 2004<br />
[3] Greitmann M.J., Adam T., Holzweißig H.G., et. al., Techn. J. <strong>of</strong> Welding and all. Proc., DVS-Verlag GmbH, Düsseldorf, 2003, Issue 5,<br />
268-274<br />
[4] Brodyanski A., Born Ch., Kopnarski, M. nm-scale resolution studies <strong>of</strong> the bond interface between ultrasonically welded Al-alloys by an<br />
analytical TEM: a path to comprehend bonding phenomena? Applied Surface Science 252/1 (2005)<br />
[5] Gutensohn M., Wagner, G., Eifler D. Ultrasonic Welding <strong>of</strong> Aluminum Wires. Welding and Cutting, 2007, 59, 550-554<br />
[6] Krueger S., Wagner, G., D. Eifler D. Ultrasonic Welding <strong>of</strong> Metal/Composite Joints Adv. Eng. Mat., 2004, 6, No. 3, 157-160<br />
[7] Balle, F., Wagner, G., Eifler, D. Ultrasonic Spot Welding <strong>of</strong> Aluminum Sheet/Carbon Fiber Reinforced Polymer – Joints. Mat. Science<br />
and Eng. Technology, 2007, 38, No. 11, 934-938<br />
[8] Balle, F., Wagner, G., Eifler, D. Ultrasonic Welding <strong>of</strong> Aluminium/CFRP-Joints – An Innovative Technology for a Multi-Material Design<br />
in Lightweight Structures. In: Aluminium Alloys – Their Physical and Mechanical Properties, Wiley (Germany), 2008, 1905-1910<br />
[9] Balle F., Wagner, G., Eifler, D. Joining <strong>of</strong> Aluminum 5754 Alloy to carbon fiber reinforced polymers (CFRP) by ultrasonic welding. In:<br />
Aluminum Alloys: Fabrication, Characterization and Applications II, TMS (The Minerals, Metals & Materials Society), USA, 2009,<br />
191-196<br />
[10] Balle, F., Wagner, G., Eifler, D. Ultrasonic Metal Welding <strong>of</strong> Aluminium Sheets to Carbon Fiber Reinforced Thermoplastic Composites.<br />
Adv. Eng. Mat., 2009, 11, 35-39


![Introduction to RF Stealth [Book Review] - Antennas and ...](https://img.yumpu.com/16857890/1/190x245/introduction-to-rf-stealth-book-review-antennas-and-.jpg?quality=85)