Article

De Novo Long-Read Whole-Genome Assemblies and the Comparative Pan-Genome Analysis of Ascochyta Blight Pathogens Affecting Field Pea

1
Agriculture Victoria, AgriBio, Centre for AgriBioscience, 5 Ring Road, Melbourne, VIC 3083, Australia
2
School of Applied Systems Biology, La Trobe University, Melbourne, VIC 3086, Australia
3
Centre for Crop and Disease Management, School of Molecular and Life Sciences, Curtin University, Perth, WA 6102, Australia
*
Author to whom correspondence should be addressed.
J. Fungi 2022, 8(8), 884; https://doi.org/10.3390/jof8080884
Submission received: 22 June 2022 / Revised: 12 August 2022 / Accepted: 15 August 2022 / Published: 22 August 2022
(This article belongs to the Special Issue Plant Fungal Pathogenesis 2022)

Abstract

:
Ascochyta Blight (AB) is a major disease of many cool-season legumes globally. In field pea, three fungal pathogens have been identified to be responsible for this disease in Australia, namely Peyronellaea pinodes, Peyronellaea pinodella and Phoma koolunga. Limited genomic resources for these pathogens have been generated, which has hampered the implementation of effective management strategies and breeding for resistant cultivars. Using Oxford Nanopore long-read sequencing, we report the first high-quality, fully annotated, near-chromosome-level nuclear and mitochondrial genome assemblies for 18 isolates from the Australian AB complex. Comparative genome analysis was performed to elucidate the differences and similarities between species and isolates using phylogenetic relationships and functional diversity. Our data indicated that P. pinodella and P. koolunga are heterothallic, while P. pinodes is homothallic. More homology and orthologous gene clusters are shared between P. pinodes and P. pinodella compared to P. koolunga. The analysis of the repetitive DNA content showed differences in the transposable repeat composition in the genomes and their expression in the transcriptomes. Significant repeat expansion in P. koolunga’s genome was seen, with strong repeat-induced point mutation (RIP) activity being evident. Phylogenetic analysis revealed that genetic diversity can be exploited for species marker development. This study provided the much-needed genetic resources and characterization of the AB species to further drive research in key areas such as disease epidemiology and host–pathogen interactions.

1. Introduction

Ascochyta Blight (AB), also referred to as black spot, is a devastating disease of many cool-season legumes of commercial importance, including field pea, lentil, chickpea, and faba bean. AB, caused by fungal species from the phylum Ascomycota, is a foliar disease affecting all of the above-ground organs of the plant, including the stem, leaves, pods, and flowers. AB affects most legume growing regions around the world, especially Europe, Australia, New Zealand, and North America. It is a major production constraint in all of the areas where these crops are produced, presenting significant crop losses as well as a reduction in yield and grain quality [1,2,3].
Unlike other legumes where only one ascochyta species is responsible for the disease, there are at least seven reported species which are responsible for AB in field peas, including: Ascochyta pisi Lib., Peyronellaea pinodes (Berk. and A. Bloxham) (Synonyms: Ascochyta pinodes, Mycosphaerella pinodes, Teleomorph: Didymella pinodes), Peyronellaea pinodella (L.K. Jones) (Synonym: Ascochyta pinodella, syn. Phoma medicaginis var. pinodella), Phoma koolunga, Phoma herbarum, Boerma exigua var. exigua, and Phoma glomerata [4,5,6,7,8,9,10]. Significant yield losses have been reported across the world, although varying environmental conditions and cropping systems affect the level of damage due to ascochyta blight. Up to 50% losses have been reported in Canada, 40% in France, 53% in Ethiopia, and 30% in China; a disease severity of 72% has been reported in Spain [11,12,13,14,15]. In Australia, AB is the second most important biotic stress affecting field pea production after bacterial blight caused by Pseudomonas syringae. Average annual losses to AB are from 10 to 60% in Australia, with higher losses observed when environmental conditions such as rain and wind favour disease progression [16,17]. Economic losses can occur through a reduction in crop biomass or the infection of pods and seeds that makes the grain unmarketable [18,19,20,21,22].
In Australia, AB presents as a complex of mainly P. pinodes; P. pinodella and P. koolunga in varying proportions, with P. pinodella seemingly being the least prevalent. With three causal pathogen species, the management of AB is challenging and complex, and requires a combination of management strategies [16,20,23,24]. The frequency of individual pathogen species varies within the growing season, further limiting the effectiveness of more generalized management approaches. The most efficient management system is the use of resistant cultivars; however, due to the multi-species disease complex, breeding for AB resistance has been difficult [16,25]. Resistance to one species has no significant impact on crop and yield loss because this leads to the increased prevalence of the other AB complex species infecting the crop.
The characterization of AB species in chickpea and lentil is well advanced [26,27,28]; nonetheless, there is a gap in the knowledge of the AB pathogen complex in field pea. The morphological characterization of AB species can vary significantly, and is largely dependent on culturing techniques; the similar colony morphology for different species also makes it challenging to assign isolates to species [29]. Extensive genetic characterization of the AB complex is lacking, and in addition, P. pinodes and P. pinodella are not easily distinguishable using current molecular methods due to their high genomic similarity. P. koolunga, discovered in 2009, seems to be more taxonomically different from P. pinodes and P. pinodella, [29,30,31,32]. Whole-genome assemblies are required in order to characterize the different AB species, understand host–pathogen interactions, and enable genomically assisted breeding for the development of resistant varieties. To date, no whole genome sequence assembly of the field pea Ascochyta species has been published, although there is a published mitochondrial genome for M. pinodes [33].
Whole-genome information is vital for the development of reliable field diagnostic tests that can accurately identify different AB species that can co-exist on the crop. This will advance our understanding of the disease epidemiology [6,29] and help to define appropriate management strategies. Research reveals that sexual reproduction and host genetic diversity contribute to virulence; therefore, the determination of the mating type for the AB species—especially for P. koolunga, the mating type of which has not yet been determined—could drive further research [16,34]. Understanding host–pathogen interactions is also crucial for the elucidation of the primary features of the plant immune response. These findings can unravel the genetic mechanisms underlying plant defenses and disease resistance, which facilitates functional marker development and application in crop breeding programs. Fungal whole-genome assemblies can help with the eludication of host–pathogen interactions because fungal genome plasticity and transposable elements enable them to evolve and adapt at a rapid rate, making it challenging to develop suitable management strategies to aid plant protection [35,36,37]. Thus, an in-depth genetic characterization of the main AB complex species is an important first step towards finding better ways to control disease outbreaks, develop targeted and effective fungicides, and advance the development of AB-resistant field pea varieties.
One approach to better understand the genetic diversity and gene distribution within species is to combine comparative genomics with pan-genome analysis. Comparative genomics compares the genomic content of one species to another at micro- as well as macro-syntenic levels, based on gene annotation, the characterization of genome plasticity, and other evolutionary events, and resolves phylogenetic relationships [38,39,40,41]. While comparative genomic analysis can span kingdoms, pan-genome analysis was developed to narrow down the understanding of similarities and differences between strains or isolates of the same species or genus [42,43,44,45,46]. Pan-genome analysis enables the investigation of the functional diversity and abundance of genes, as well as the core and accessory gene distribution between species. Genome-based studies have shown that lineage-specific accessory genes can encode virulence determinants (avirulence genes), and the identification of such genes can enable targeted breeding for the improvement of plant resistance genes in order to prevent disease [47,48,49,50].
Advances in next-generation sequencing technologies (NGS) have enabled the sequencing of many non-model organisms at a reduced cost. This provides genetic resources that are useful for comprehensive comparative analysis. NGS includes short-read sequencing technologies such as Illumina and long-read sequencing platforms such as Oxford Nanopore Technologies (ONT) [51,52,53]. The assembly methods for short-read sequencing lack the resolution and capability to account for structural variants and sequence repeats, which are major features of complex eukaryotes such as fungi. Biodiversity research using molecular markers that exceed 550 bp for greater taxonomic resolution is also significantly impeded [54,55,56,57]. In contrast, long-read sequencing technologies resolves all of these drawbacks through individual reads long enough to cover entire repeat sequences. and the bioinformatic tools available for error correction and polishing can help to resolve their high error rate [58,59,60,61,62,63,64]. Consequently, species and genotype-level taxonomic resolutions have been greatly improved using long-read sequencing in fungi, which in turn, could improve disease monitoring strategies, epidemiological studies and diagnostic tool development [65,66].
To the best of our knowledge, no genome assembly is available for these three AB species to date. Using long- and short-read sequencing technology, the aim of this study was to obtain high-quality genome assemblies that will play an important role in future research to understand these species and how they interact with their host plant and the environment. Here, we present the first fully annotated nuclear and mitochondrial draft genome assemblies for 18 AB isolates, six each of P. pinodes, P. pinodella and P. koolunga. Our investigations included comparative and pan-genome analysis, genome annotation, and the exploration of secondary metabolites, CAZymes, orthologs and phylogenetic relationships. We have generated a valuable resource.

2. Materials and Methods

2.1. Fungal Culture

Eighteen field pea AB isolates were obtained from the Ascochyta pathogen culture collection at the Centre for Crop and Disease Management, Curtin University, Western Australia. The isolates were received as dried cultures on filter paper preserved with desiccants in airlocked bags. Six isolates for each species were used for this study. These included P. pinodes (Isolate3Pp; Isolate4Pp; Isolate5Pp; Isolate87Pp; Isolate88Pp; Isolate97Pp), P. pinodella (Isolate18Ppll; Isolate27Ppll; Isolate72Ppll; Isolate58Ppll; Isolate104Ppll; Isolate113Ppll) and P. koolunga (Isolate1Pk; Isolate2Pk; Isolate22Pk; Isolate32Pk; Isolate36Pk; Isolate42Pk). The isolates were cultured on potato dextrose agar (Difco laboratories, USA) and grown in a temperature- and light-controlled incubator for 5–15 days with a photoperiod of 12 h/23 °C dark and 12 h/19 °C black light (a UV-A fluorescent tube). The mycelial plugs were cut from media plates and grown in potato dextrose broth for 3–4 days at 22 °C in an incubator shaker at 150 rpm in the dark.

2.2. Nucleic Acid Extraction

For the DNA extraction, mycelial samples were harvested and freeze dried for 24 h. The total DNA was isolated from the freeze-dried samples using the Wizard® Genomic DNA Purification System (Promega, Madison, WI, USA) as per the manufacturer’s instructions to achieve high-molecular-weight DNA. The eluted DNA was quantified using a QubitTM dsDNA BR Assay Kit (Thermo Fisher Scientific, Waltham, MA, USA), and the quality was assessed using a Nanodrop 2000 (Thermo Fisher Scientific). The integrity and molecular weight were assessed using an Agilent TapeStation 2200 system (Agilent Technologies, Santa Clara, CA, USA) following manufacturer’s instructions.
For RNA extraction, mycelial samples were collected into 1.5 mL Eppendorf tubes and stored at −80 °C until they were processed. The RNA extraction was carried out using a Plant/Fungi Total RNA Purification Kit (Norgen Biotek Corp., Thorold, ON, Canada). Quality was assessed using a Nanodrop 2000 spectrophotometer (Thermo Fisher Scientific), and integrity was assessed using an Agilent TapeStation 2200 system.

2.3. Oxford Nanopore Technologies (ONT) Sequencing

All of the ONT flow cells, library preparation kits and other consumables were sourced from Oxford Nanopore Technology (Oxford, England). The genome libraries for the isolates P. pinodes (Isolate3Pp; Isolate4Pp; Isolate5Pp), P. pinodella (Isolate18Ppll) and P. koolunga (Isolate1Pk; Isolate2Pk) were prepared using the ONT 1D ligation sequencing kit (SQK-LSK109) for MinION, with no shearing. For the remaining isolates, genome libraries were prepared using the SQK-LSK109 native barcode genomic DNA protocol for PromethION. The libraries were prepared according to the manufacturer’s instructions; however, the loading concentrations were adjusted to achieve the optimum loading of the flow cell.
Six high-molecular-weight ONT libraries with sizes ranging from 20 Kb to approximately 60 Kb for Isolate1Pk, Isolate2Pk, Isolate3Pp, Isolate4Pp, Isolate5Pp and Isolate18Ppll were sequenced using the ONT MinION platform. Each library was sequenced on one R9.4 flow cell (FLO-MIN106, ONT), except for Isolate2Pk, which was sequenced on two R9.4 flow cells, and the reads were combined. Additional sequencing was undertaken with all 18 high-molecular-weight ONT libraries, with sample sizes ranging from 10 Kb to approximately 60 Kb being sequenced using the ONT PromethION platform. Each library was sequenced on a PromethIon flow cell (FLO-PRO002, ONT). Fastq data from MinION and PromethION for each isolate were combined before proceeding to further analysis.

2.4. Transcriptome Sequencing and Alignment

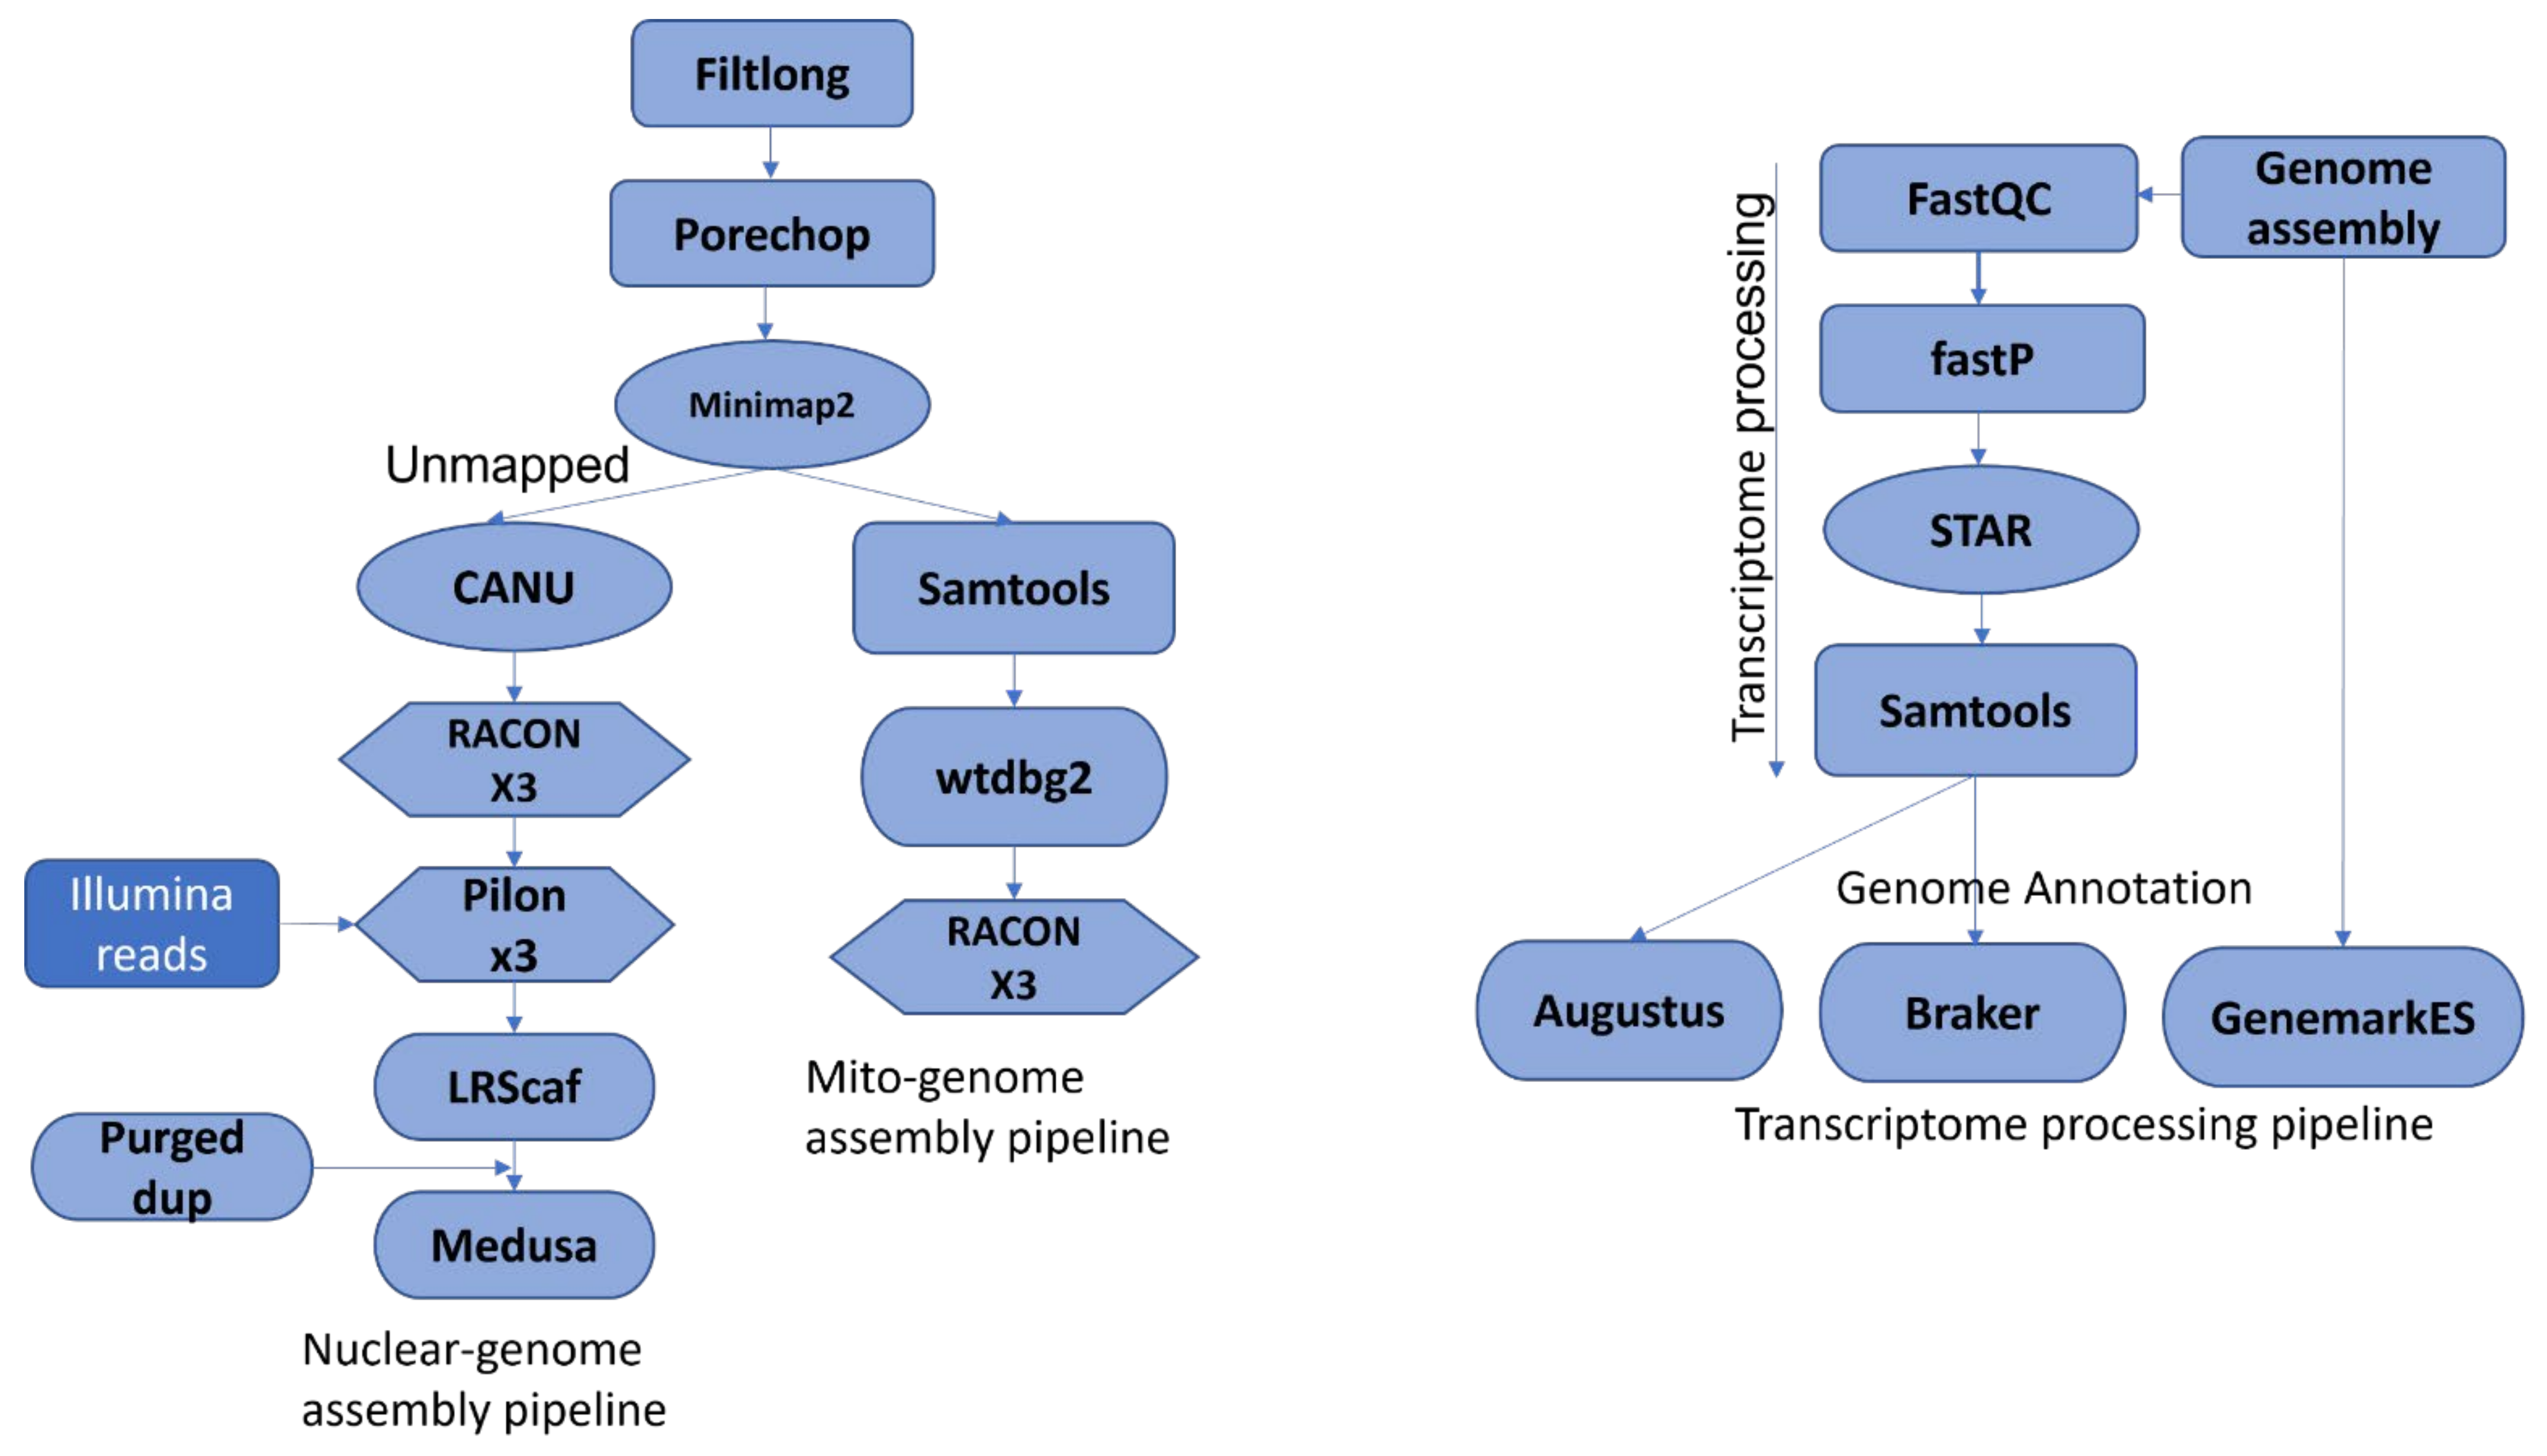
RNA samples extracted as detailed above were used to prepare transcriptome libraries for all 18 isolates in triplicate using Agilent’s Sure Select Strand Specific RNA Library Preparation Kit (Agilent Technologies) according to the manufacturer’s protocol. The RNA concentrations were estimated by running a sample of each library on an Illumina MiSeq sequencer (Illumina, Inc., San Diego, CA, USA) to measure library-specific barcode concentrations, and were pooled to achieve even proportions of each library in the pooled sample. Paired end sequencing (151 cycles + 151 cycles) was carried out on a NovaSeq 3000 (Illumina, Inc., San Diego, CA, USA). The RNA-seq data were processed according to the pipeline shown in Figure 1. FastQC v0.11.8 (http://www.bioinformatics.babraham.ac.uk/projects/fastqc/ was used to check the quality of the sequencing data. Fastp v0.21.0 [67] was used to trim the adaptors. STAR v2.7.3 [68] was used to align the processed transcripts to the respective genomes generating transcript alignment files in BAM format to be used for genome annotation.

2.5. Repeat Expression Analysis

The results from RepeatMasker for all of the isolates in GFF3 format were used to extract repeat sequences from the assembled AB genomes with getfasta in bedtools [69]. Repeat fasta files were separated by species and concatenated into a single file per species before clustering to obtain only the unique repeats present in each species using CDHITS [70]. The transcripts were quantified using Salmon [71] to obtain the number of reads for each repeat element.

2.6. Nuclear and Mitochondrial Genome Assembly, and Post Assembly Analysis

Sequencing data from MinION and PromethION was acquired using MinKNOW v0.51.1.62 (Oxford Nanopore Technologies. Oxford, United Kingdom). Raw fastq reads were processed as shown in Figure 1 and were categorized into “pass” or “fail” based on an average quality score > Q7. Only fastq pass reads were used for further processing and genome assembly. The reads were first filtered based on quality using the Filtlong package v0.2.0 (https://github.com/rrwick/Filtlong), and then adaptors were removed using the Porechop package v0.2.4 (https://github.com/rrwick/Porechop. Minimap2 v10.2.0 [72] was used to extract mitochondrial reads through the sequence alignment of processed reads to the published M. pinodes mitochondrial genome [73]. The post-processing of sequence alignment data, including conversion from SAM to BAM format and the sorting of BAM files, before separating mapped and unmapped reads as fastq files, was carried out using Samtools v1.12 [74]. Mapped reads were processed to assemble mitochondrial genomes, and unmapped reads were processed to generate nuclear genome assemblies for each isolate. Nuclear genomes were assembled with CANU v2.0 [75]. Approximate genome sizes for all three species were determined using CANU, wtdgb2 v2.2, [76] and Flye v2.6 [77] for input into CANU: P. pinodes (35 Mbp), P. pinodella (45 Mbp), P. koolunga (60 Mbp). Assemblies were carried out with three different minReadLength values (1000, 3000, 5000), and the assemblies with the lowest number of contigs were chosen as the final assemblies for each isolate. These draft assemblies were polished three times using Racon v1.4.10 [78] and Pilon v1.23 [79]. The nuclear assemblies for Isolate1Pk, Isolate2Pk, Isolate3Pp, Isolate4Pp, Isolate5Pp had Illumina short-reads available on the SRA database (SRR8284140, SRR8284141, SRR8284142, SRR8284136, SRR8284138, SRR8284139), and these were used for the hybrid Pilon polishing. The assembled genomes were assessed for quality using Quast v5.0.2 [80], and scaffolding was carried out using LRScaf v1.1.10 [81] and MeDuSa v1.6 [82]. The completeness of the genome assemblies was determined using BUSCO [83], and duplicated genes were removed using PurgeDup v20201029 [84]. Final genome assemblies were again assessed using the BUSCO Fungi_Odb10 database on GenSAS (JL Humann, et al., 2019).
Known fungal single-copy genes, elongation factor 1-α (EF1-α), elongation factor 3-α (EF3-α), and the second largest subunit of RNA polymerase II (RPB2) were used to test for duplications in the assemblies that would indicate assembly errors using Blastn. The sequences used included Aspergillus tanneri translational elongation factor EF-1α (TEF3; XM_033570262.1), Ascochyta pisi strain CBS 122785 DNA-directed RNA polymerase II second-largest subunit (RPB2; MT018244.1), and Aspergillus oryzae strain translation elongation factor 1- α (tef-1-α; JCM10114).
The mitochondrial genomes were assembled using wtdgb2. The assemblies were quality checked by increasing the value of the estimated genome size parameter -g (65, 70, 80) in order to confirm the mitochondrial genome size and contig number before polishing three times using Racon version 1.4.10.

2.7. Genome Annotation

Automated genome annotation was carried out using the GenSAS web server platform, which includes pipelines and databases developed for fungi accessed on 11 Jan 2021. The transcriptome data generated above were used for the further refinement of the gene annotation. Detailed annotation of repeats in the genome assemblies was carried out using RepeatMasker v4.0.7 [85] and RepeatModeler v1.0.11 (http://www.repeatmasker.Org. RIPper [86], a web-based tool, was used to identify repeat-induced mutation activity in the assembled genomes of the reference isolates for each of the three AB species. Repeats were masked for all of the assemblies before the functional and structural annotation was performed. Transcripts were predicted and aligned using BLAST nucleotide (blastn) [87], BLAT [88], and Program to Assemble Spliced Alignments (PASA) [89] against NCBI refseq fungi databases with default parameters. Trembl, SwissProt (https://www.uniprot.org/) and DIAMOND proteins v0.9.22 [90] were used to predict the protein sequence with NCBI refseq fungi and database default parameters. Gene prediction was performed using Augustus v3.3.1 [91] with the A. fumigatus library as a hint annotation model, GenemarkES v4.38 [92], and Braker v2.1.1 (https://github.com/Gaius-Augustus/BRAKER). The most complete prediction was used for further downstream annotation. RNAmmer tool v1.2 [93] was used to annotate 5s/8s, 16s/18s, and 23s/28s ribosomal RNA in the nuclear genomic sequences. SSR Finder v1.0 (http://www.fresnostate.edu/ssrfinder/) was used to find Simple Sequence Repeats (SSR), and tRNAscan-SE v2.0 [94] was used to identify tRNA genes in the AB genome assemblies. Functional annotation was carried out to enable the assignment of function and gene names. Conserved protein domains for the gene models were annotated using BLAST protein vs protein (blastp) version 2.7.1, DIAMOND, InterProScan v5.29–68.0 [95], and PFAM v1.6 [96]. SignalP v4.1 [97] was used to predict the presence and location of signal peptide cleavage sites in the predicted protein sequences. The completeness and quality of the structural annotation was assessed using Benchmarking Universal Single-Copy Orthologs (BUSCO) v3 with the Fungi_Odb10 database. GC content analysis was carried out using a 1000k sliding window.
Mitochondrial genomes were annotated using web servers for MITOS2 (http://mitos.bioinf.uni-leipzig.de/index.py accessed on 28 May 2021) [98], RNAweasel, and MFannot (https://megasun.bch.umontreal.ca/RNAweasel/; accessed on 28 May 2021). Codon usage was calculated using the web server, a Sequence Manipulation Suite (http://www.bioinformatics.org/sms2/codon_usage.html; accessed on 28 May 2021).

2.8. AB GC Content Variation

Each genome was cut into non-overlapping 1 kb pieces, and the GC content of each 1 kb piece was measured. The %GC for each piece was rounded to an integer value and summed by the %GC value for each genome to create a %GC frequency distribution.

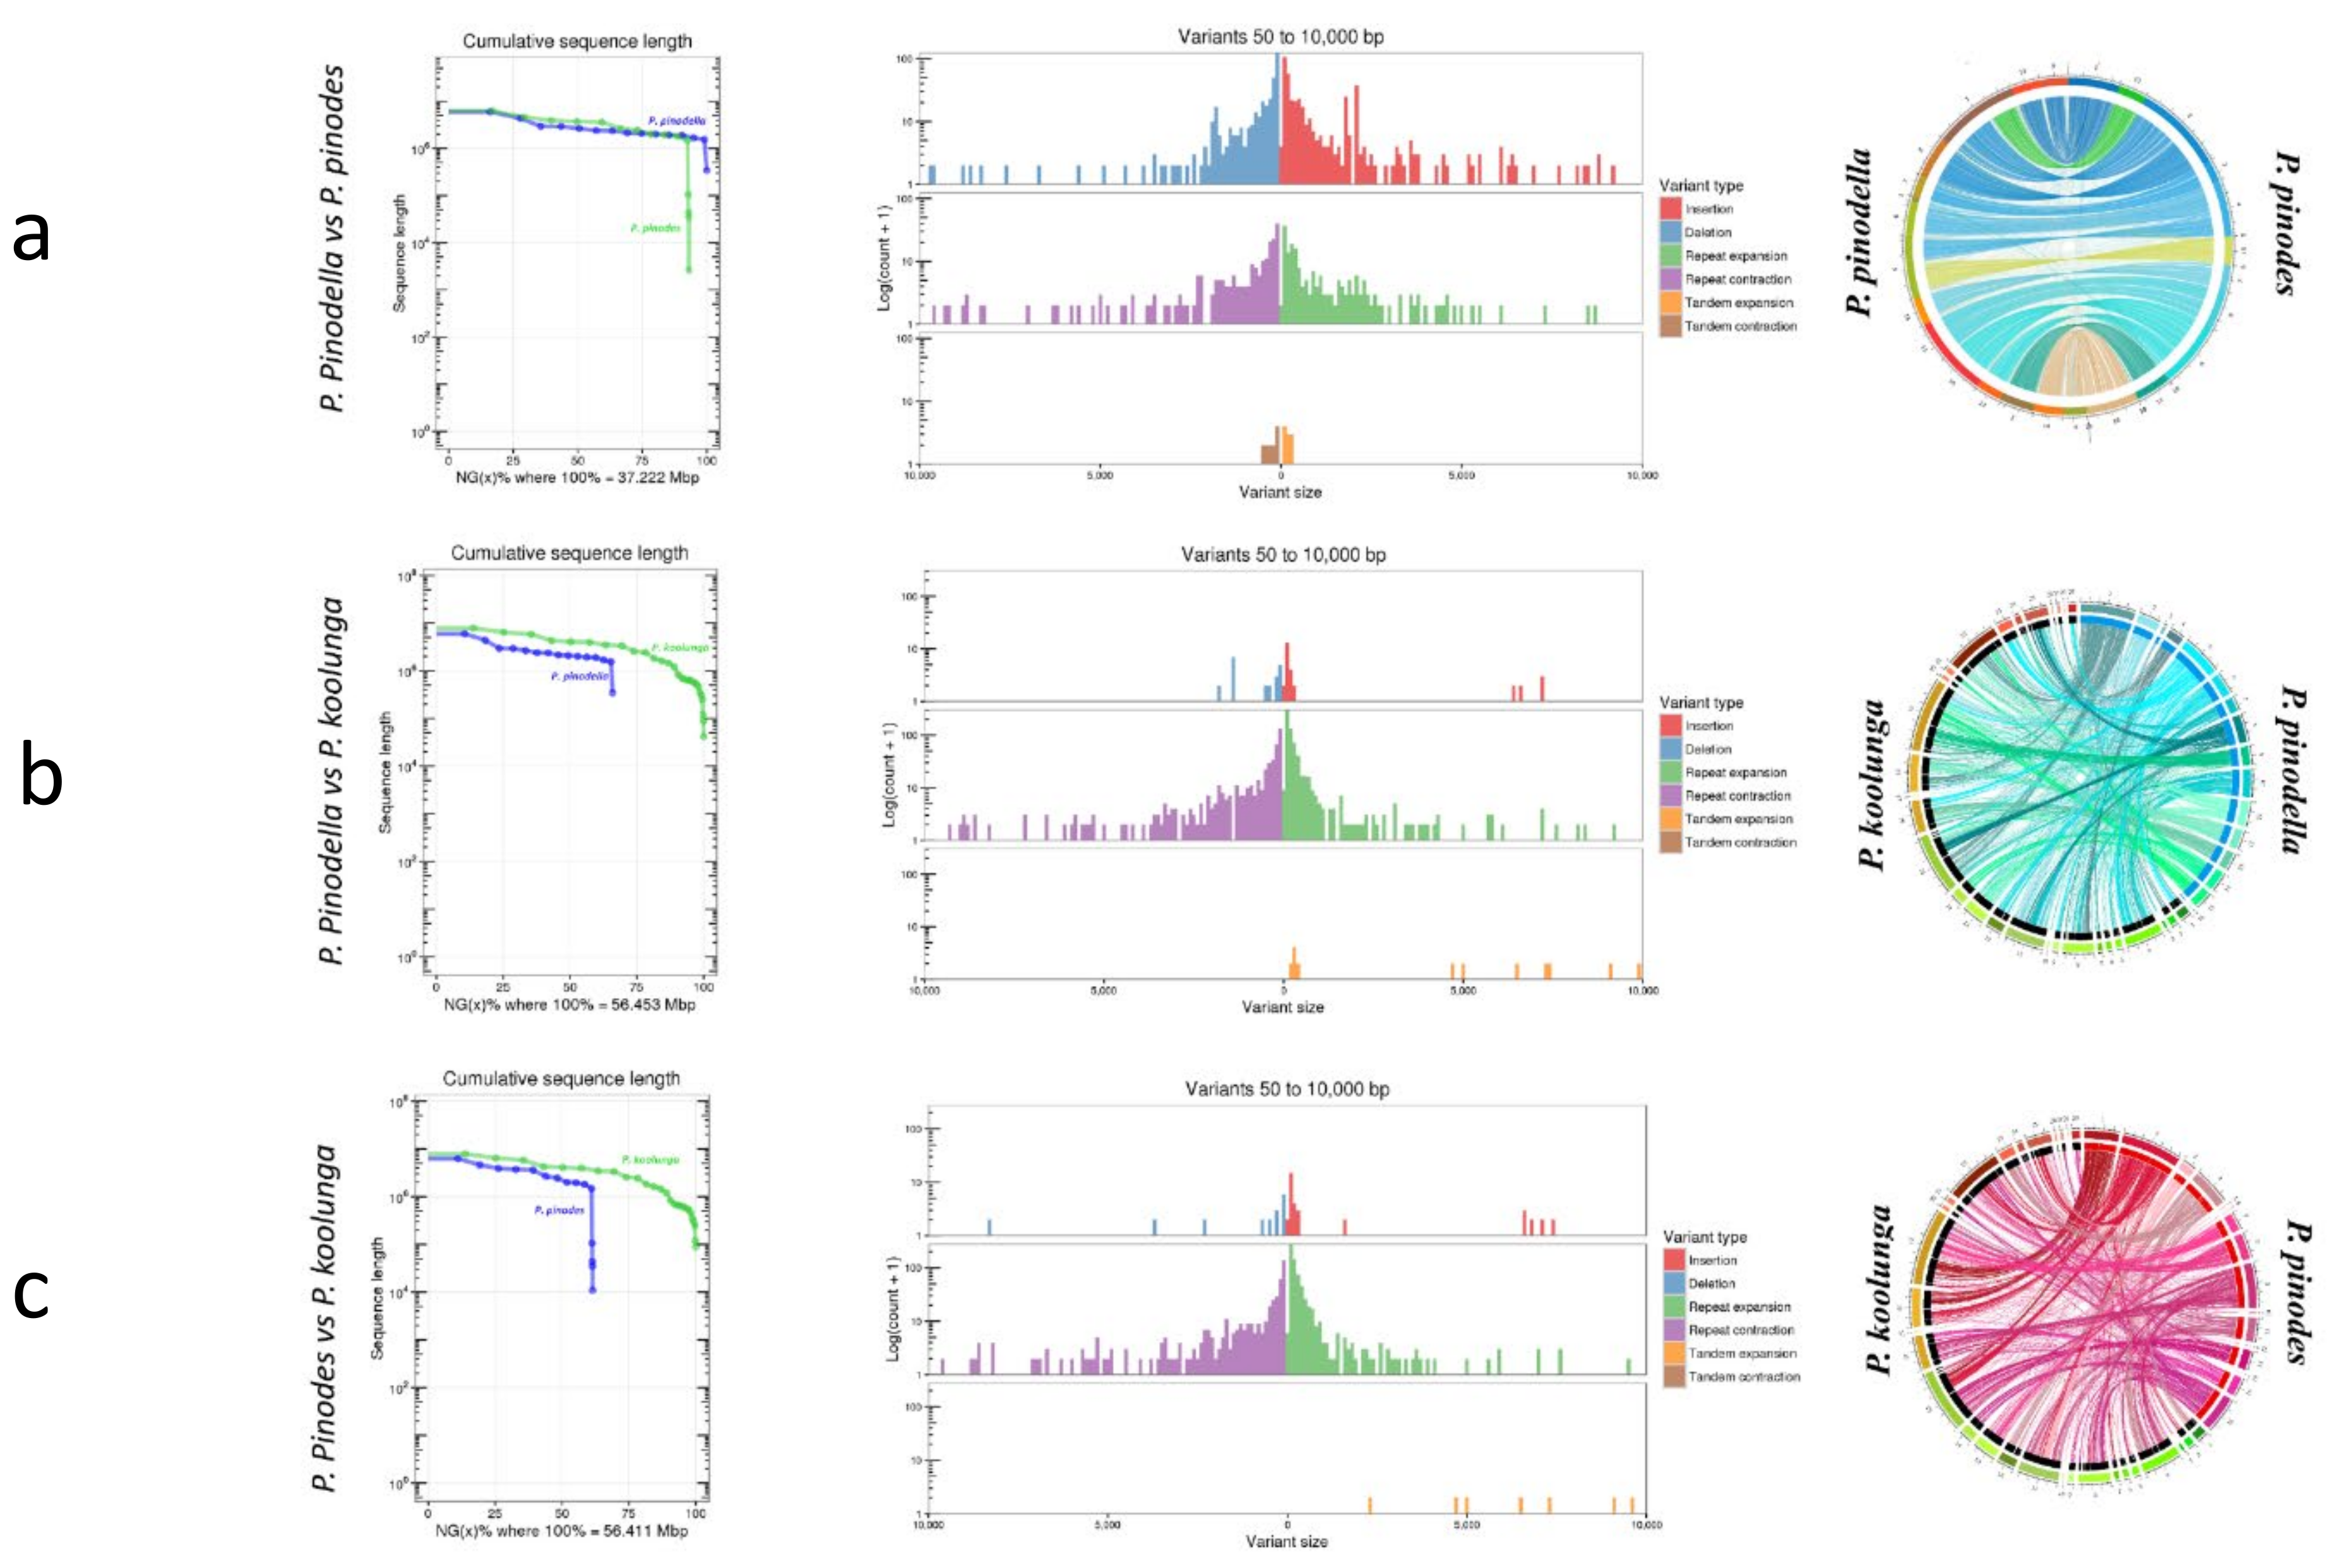
2.9. AB Nuclear Genome Structural Variation and Synteny Analysis

Genome-wide comparisons of structural variation between pairs of AB reference genome assemblies were carried out using Nucmer v4.0 [99] to generate delta alignment files that were used as input into Assemblytics [100]. Genome similarity data were generated for reference isolates (Isolate2Pk P. koolunga, Isolate3Pp P. pinodes and Isolate18Ppll P. pinodella) using Nucmer with the --mum setting. The identification and analysis of the genome similarities among AB isolates was carried out using CIRCOS software v 0.69–9 [101] using the links function to illustrate genomic regions identified by Nucmer to have a high level of nucleotide sequence homology.

2.10. BLASTn Similarity and Blast2go Analysis

Sequence similarity checks for the assembled nuclear genomes against the NCBI fungal genome nr/nt database were carried out using blastn, blastp and blastx. The parameters were set to allow only the top hits for each contig in the assembly being queried. Blast2go software was used to generate the top blast hits for the genome assemblies using annotated CDS gene files for reference isolates within each AB species.

2.11. Mating Type Determination

A. lentis MAT1-1 (DQ341314.1) and MAT1-2 (DQ341315.2), as well as P. pinodella MAT1-1 (JF815529.1) and MAT1-2 (JF815531.1) genes (accessed on 25 February 2021), were blasted against assembled nuclear genomes using blastn to determine their mating type according to homologous genes described by Cherif et al. (2006).

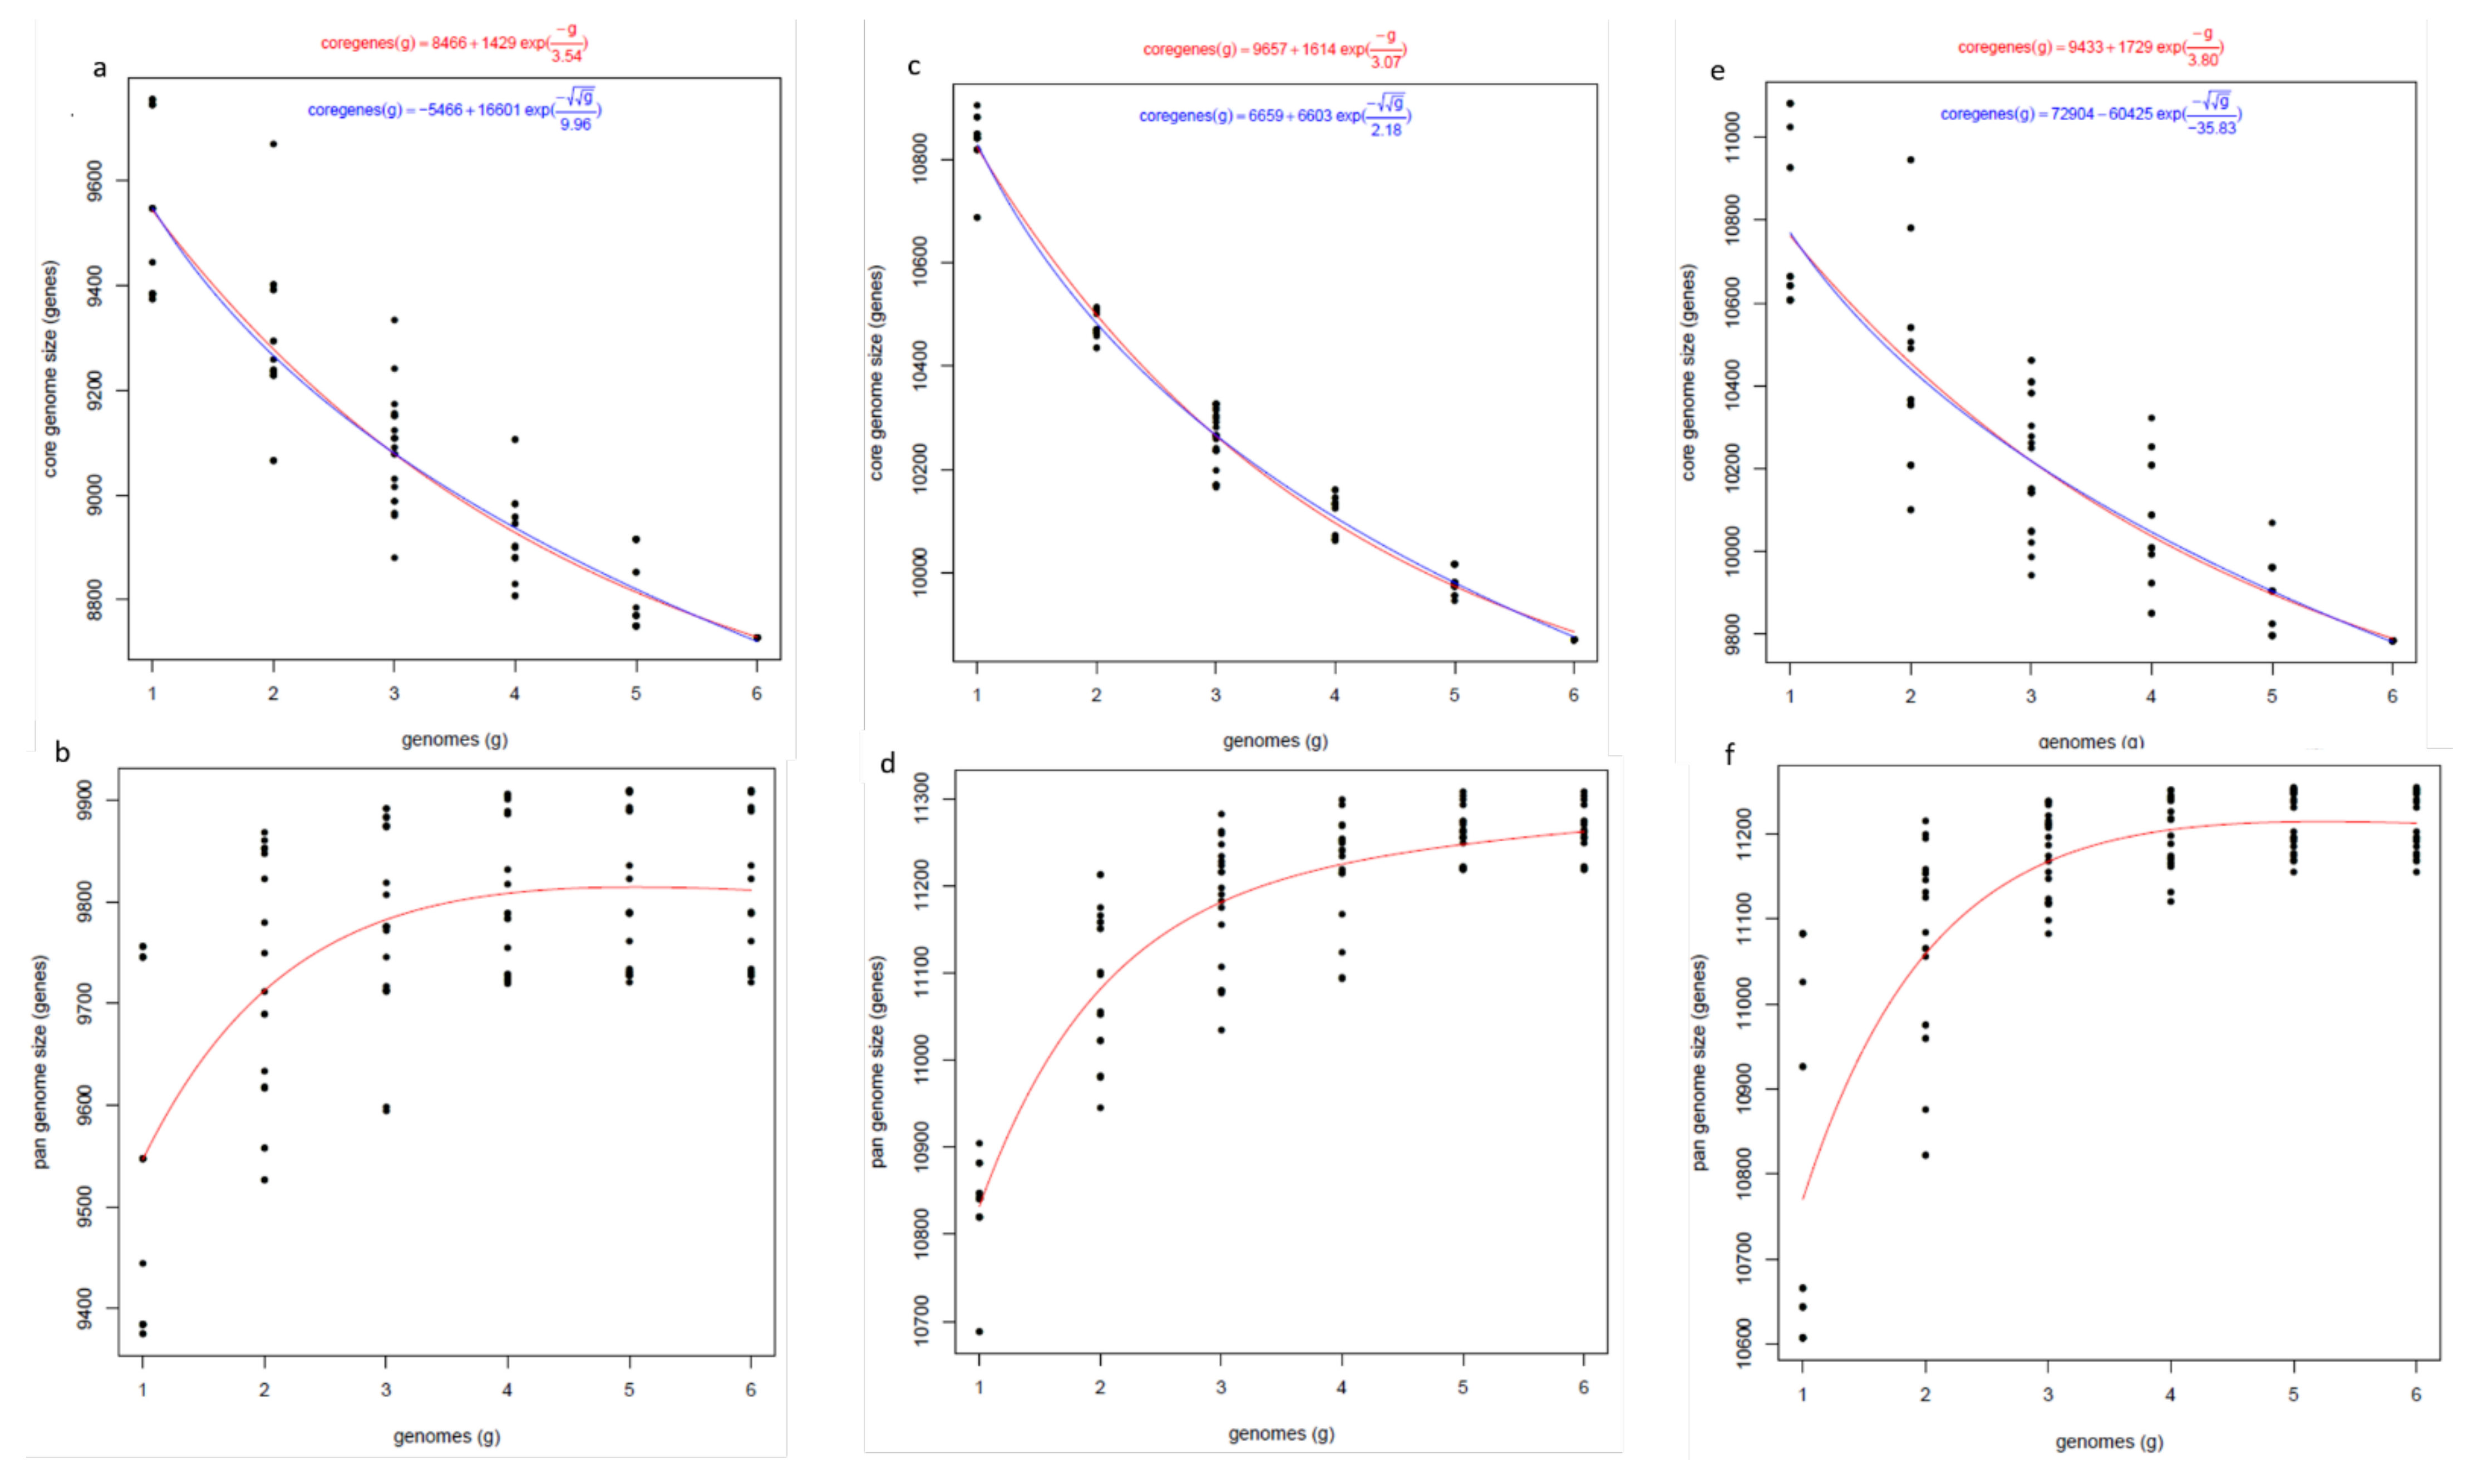
2.12. Ortholog Analysis

Predicted protein sequences in FASTA format for the AB species were used to predict orthologous gene clusters with the web program OrthoVenn [102], which utilizes OrthoMCL, a well-known heuristic approach for the identification of ortholog groups [103]. Gene families were analysed, and core and accessory genes were identified and used to describe pangenomes for the respective field pea AB species.

2.13. Phylogenetic Analysis

Whole-genome phylogeny for the field pea AB isolates was determined using kSNP3 [104]. The resulting parsimony tree was uploaded into FigTree version 1.4.3 (http://tree.bio.ed.ac.uk/software/figtree/) for drawing, rooting, and ordering nodes. OrthoFinder version 2.3.8 [105] was also used to infer phylogeny using predicted protein sequences. Fourteen fungal species sourced on 4 February 2021 from public databases (NCBI) were included in the analysis, in order to determine the phylogenetic relationships. All of the species used in the analysis are from the phylum Ascomycota, except Ustilago maydis, which is from the phylum Basidiomycota. Using Nei’s pairwise genetic distance calculation method, neighbour-joining (NJ) dendrograms were generated for rDNA internal transcribed spacer (ITS) and protein coding genes β-tubulin, the second largest subunit of RNA polymerase II (RPB2), transcription elongation factor 1-α (TEF1α) and topoisomerase 1 (TOP1), with NCBI accession numbers GU237883.1, KX838493.1, AB007770.1, and NW_017306212.1, respectively (accessed on 11 February 2021).

2.14. Carbohydrate-Active Enzyme (CAZymes) Analysis

CAZymes annotation was carried out using the dbCAN2 annotation pipeline (http://bcb.unl.edu/dbCAN2/, accessed on 26 August 2021), a web-based application [106]. This application annotates for putative homology to protein sequences in the CAZymes database using three tools: (i) HMMER, a dbCAN HMM (hidden Markov model) database [107]; (ii) DIAMOND, a CAZy pre-annotated CAZyme sequence database [90]; and (iii) Hotpep, a conserved CAZyme short peptide database [108].

2.15. Secondary Metabolite Gene Cluster Analysis

Secondary metabolite biosynthetic clusters were identified using the antiSMASH web server (fungal version) (https://fungismash.secondarymetabolites.org/, accessed on 12 February 2021) with the default settings [109,110].

3. Results

3.1. Genome Sequencing

The genome sequencing of 18 AB isolates (Supplementary Table S1), based on Oxford Nanopore long-read sequencing technology, produced draft genome assemblies that were near complete. The raw sequencing data size generated for the isolates ranged from 2.9 Gb to 30 Gb, the total sequencing read length ranged from 2 Gbp to 15 Gb, and the sequencing coverage ranged from 40× to 339× (Supplementary Table S2). After adaptor removal and quality filtering, the total read length was between approximately 2 Gb and 9 Gb, and coverage was from 32× to 197×. Isolate 32 had the lowest total read length, and isolate18 had the highest. The number of raw RNA reads generated from different isolates ranged from 6.9 M to 50 M, with the lowest being for isolate42 and the highest being for isolate1 (Supplementary Table S3). More than 90% of the total reads had a quality score of more than 20 (Q20), and the average GC content was approximately 55%.

3.2. Genome Assembly Statistics

Some of the genome assemblies were assembled at a near-chromosome-level resolution. The number of scaffold/pseudochromosomes ranged from 12 to 270, with an average genome length of 56.7 Mbp, 37.5 Mbp and 35.1 Mbp for P. koolunga, P. pinodella and P. pinodes, respectively (Table 1). The scaffold N50 averages were 2.9 Mbp; 2.9 Mbp and 3.0 Mbp, and the average GC% content was 44%, 51% and 52% for P. koolunga, P. pinodella and P. pinodes, respectively. An assessment of the completeness of the assemblies, determined using Quast v5.0.2, indicated that all of the isolate genome assemblies were greater than 93% complete, with the highest percentage of 99% being attained for assemblies that were polished with Illumina reads. Isolate2Pk, Isolate3Pp and Isolate18Ppll were designated as species reference genomes based on their high BUSCO completeness and low scaffold number.

3.3. Genome Annotation

A higher number of genes were predicted using Augustus compared to Braker and GenemarkES, with the latter two programs being similar in their predicted number of genes (Table 2). BUSCO assessment of annotation, using the Fungi 10db dataset, showed that GenemarkES resulted in the highest completeness percentage for most isolates, and Augustus was the lowest. Annotation data from GenemarkES, with a predicted number of genes ranging from about 9700 to 12,900, was used for all of the subsequent comparative analysis. tRNAs and rRNAs annotated using tRNAscan-SE and RNAmmer on GenSAS, respectively (Table 2), indicated that the average numbers of tRNAs among the isolates were 138, 139, and 129, and those of rRNAs were 82, 69 and 73 for P. koolunga, P. pinodella and P. pinodes, respectively. We observed that the total rRNA number for most isolates was under 100; however, three isolates (one in each AB species) had over 100 rRNAs.

3.4. Blastn and Blast2go Analysis

Nucleotide BLAST analysis of the predicted genes for AB isolates against the NCBI nr/nt databases revealed sequence similarity to other species in the Ascomycota phylum. High-scoring matches for the scaffolds included Parastagonospora nodorum, Alternaria sp., Leptosphaeria sp., Didymella rabiei, Ascochyta pisi, Phoma sp. 1 OB-2014, and Bipolaris sp. for the nt database, and Ascochyta rabiei for nr database. Blast2go analysis showed A. lentis and A. rabiei as top blast hits for P. koolunga. Didymella keratinophila and Didymella heteroderae were top hits for P. pinodes and P. pinodella (Supplementary Figure S1). D. keratinophila and D. heteroderae are human fungal pathogens, and emerge closest to the AB species, likely because they are Didymella species similar to P. pinodes (previously Didymella pinodes) and P. pinodella.

3.5. AB Nuclear Genome Structural Variation (SVs) and Synteny Analysis

Differences in gene sequence and presence–absence variation play a key role in the specificity for host and cultivar in closely related plant pathogenic fungi. These variations have been linked to the conferring of advantageous qualities to the isolate. A whole-genome comparison of AB species using the assembled genomes of reference isolates for each of the three species revealed structural variants between AB species, including insertions, deletions, tandem expansions/contractions, and repeat expansions/contractions (Figure 2). The alignment of P. pinodes and P. pinodella showed that insertions and deletions were more prevalent, while the alignments of P. koolunga with either P. pinodes or P. pinodella showed that repeat expansion and contraction were the most prevalent SVs. The SVs observed between the AB species were mostly between 50 and 2500 bp. The total number of structural variants was higher for P. pinodella vs. P. koolunga (1176) compared to P. pinodella vs. P. pinodes (1155) and P. pinodes vs P. koolunga (1146). The total bases affected by structural variants on the other hand was greater for P. pinodella vs. P. pinodes (1.27 Mb) compared to P. pinodella vs. P. koolunga (0.87 Mb) and P. pinodes vs. P. koolunga (0.87 Mb). Nucmer considers only the regions of the genomes that align to each other, and so the SVs observed between the species only depict regions that are homologous between the species. Dot plots of alignment showed overall good collinearity between P. pinodella and P. pinodes, as well as indels, inversions and translocations (Supplementary Figure S2). A marked difference in genome rearrangement was observed between P. koolunga and the other two AB species. The nuclear genomes of the AB isolates plotted using Circos revealed genome similarity and conservation. The colored rings in the plot link annotate genes which were found to be conserved between the species, while the white spaces show absence of homology (Figure 2). Gene conservation was observed among the AB species, with a higher degree of conservation and synteny between P. pinodes and P. pinodella compared to P. koolunga.

3.6. Repeat Analysis of Genome Assemblies

Fungal genomes have highly variable sizes and compositions, which contribute to genome plasticity and expansion, which is typically driven by the activity of repeat elements [111]. Repeat analysis using RepeatMasker and RepeatModeler indicated some degree of overlap, although many more repeats were observed from RepeatModeler analysis. Elements such as Copia, Gypsy, Mariner, Tad1 and simple repeats were annotated by both RepeatMasker and RepeatModeler. P. koolunga genomes were found to have a greater quantity of repeat elements compared to P. pinodes and P. pinodella (Supplementary Figure S3). RepeatModeler showed that, on average, 44% of the P. koolunga genome sequence contained repeat elements, whilst RepeatMasker only indicated 11%. Simple repeats were the most abundant, followed by Gypsy (Supplementary Table S4). Unique repeat elements that were observed with RepeatModeler but not with RepeatMasker included hAT-Restless, TcMar-Tc1, TcMar-Fot1, L1-Tx1 and DNA/Academ. L1 and DNA/Academ were only present in P. pinodella isolate113 and isolate18, respectively. BCBOTYPOL and POT2 were only observed in P. koolunga and P. pinodella, respectively. Isolate-specific repeat elements FTF1 and AFLAV were observed for P. pinodella Isolate104Ppll and P. koolunga Isolate22Pk, respectively.
GC content variation analysis (Figure 3a) showed a distinctive bimodal distribution for P. pinodella and P. koolunga, with P. koolunga having near-similar bimodal peaks. P. pinodes shows a strong primary peak with what seems to be a very slight secondary peak much closer to the primary peak compared to those observed for P. pinodella and P. koolunga. RIP (repeat-induced point mutation) analysis using the web browser tool RiPPER revealed large RIP-affected genomic regions. The results showed a significant impact to a total of 0.5 Mb, 3.7 Mb and 22 Mb of the genomes of P. pinodes, P. pinodella and P. koolunga, respectively. P. koolunga shows the most significant impact by RIP activity, followed by P. pinodella, which is proportional in pattern to the RIP percentage (Figure 3b) observed and the repeat analysis results acquired for the AB species.

3.7. Repeat Analysis using Transcriptome Data

In order to investigate whether the repeats annotated in the genomes are active, we carried out transcriptome analysis of the repeat elements observed in the genome. The results (Table 3) showed that I_1_A0, a non-LTR retrotransposon of the i clade, is the most expressed repeat of the AB species, although this result was split among the P. pinodes isolates. Three P. pinodes isolates (Isolate 4Pp, Isolate5Pp and Isolate87Pp) showed that Mariner, a DNA transposon, was the most expressed transposable element (TE); it comprises mobile DNA sequences that move within the genome. P. pinodes (53,361) and P. pinodella (68,806) had much higher read counts of repeat expressed compared to P. koolunga (8062), which has the highest repeat content in its genome (Table 3).
Observing the top five most expressed TE in the AB species showed that P. pinodella and P. koolunga have a similar repeat expression profile compared to P. pinodes (Figure 2a), despite being more phylogenetically distant. Mariner and Gypsy are expressed at higher levels in P. pinodes compared to the other AB species, and Copia is expressed at higher levels in P. pinodella. There are also some species-specific TE expression patterns which were observed, such as AFUT1 specific to P. koolunga, CFT1 and TFO1 specifically expressed in P. pinodes, and POT2, which was only observed to be expressed in P. pinodella (Table 3).
For the pangenome analysis, we determined the number of core and accessory (isolate specific) genes using Get-HomologueEST. The number of genes shared within species, upon the sequential addition of new isolates from the same species, was extrapolated by the program. The results of all of the permutations of our six isolates for each species are shown in Figure 4. In order to remove low-confidence sequences, only the clusters found in at least two genomes were included in the pangenome analysis. For all of the AB species, the number of core (shared) genes decreased with successive additions of new genome sequences. The pangenome size for our AB species, as expected, increased with the number of genomes added, and began to plateau at six genomes, which indicated the possibility of a closed genome; however, the addition of more genomes would be required to confirm this.

3.8. Mating Type Determination

The mating type gene analyses for P. pinodes and P. pinodella were consistent with the literature, with P. pinodes being homothallic and P. pinodella being heterothallic (Supplementary Table S5). While P. pinodella MAT genes did not identify any mating type genes in P. koolunga, A. lentis MAT gene analysis identified P. koolunga as being heterothallic.

3.9. Orthogroup Analysis

Orthologous cluster analysis carried out using Orthovenn, as summarised in Table 4, indicated a higher number of protein clusters in P. pinodella and P. pinodes isolates (11,782; 11,653) compared to P. koolunga isolates (10,305). A substantial number of orthologous clusters were observed in P. pinodella (3543) compared to the other AB species, whereas for single-copy orthogroup clusters P. pinodes (9215) was observed to be greater compared to the other species.
The analysis of the orthologous clusters shared by all of the isolates within a species revealed the extent of the homology within that species. A greater homology in P. pinodella (9898) was observed (Figure 5a–c), and P. koolunga (8694) had the least observed homology among species. P. pinodes Isolate5Pp (43) had the most unique orthologous clusters.
The comparison of the orthologs against the AB reference isolates resolved 10,781 protein clusters, of which 2412 were shared by at least two species and 8532 were common among all of the species (Figure 5d). There were some unique clusters observed for all of the AB species. Gene ontology (GO) annotation of the unique clusters revealed proteins that are unique to each AB species (Table 5). The number of clusters shared between P. pinodes and P. pinodella was higher (1867) than that between P. pinodes and P. koolunga (226), and P. pinodella and P. koolunga (86).

3.10. Phylogeny

A phylogenetic tree using the whole-genome assemblies for 18 AB isolates was generated. The tree was rooted using Ustilago maydis as an outgroup, and the nodes were ordered. The clustering showed the clear separation of the different AB species (Supplementary Figure S4a). OrthoFinder was used to resolve phylogeny using Protein fasta files from the respective genome annotations. Analysis with 13 ascomycete species, including A_fumigatus, A_lentis, L_maculans, C_albicans, A_alternata, A_brassicicola, A_tenuissima, A_rabiei, A_arborescens, S_cerevisiae, N_crassa, F_oxysporum and U_maydis, as well as the field pea AB species, identified 341,319 total proteins (95.3% of total) assigned to 17,621 orthologous gene clusters. The OrthoFinder results showed that 50% of all of the proteins were in orthogroups containing 29 or more proteins (G50 = 29), and were contained in the largest orthogroups (O50 = 4714). There were 2221 orthogroups with all of the species present, and 547 of these consisted entirely of single-copy orthogroup proteins. A phylogenetic tree was generated using 1189 orthogroups with minimum of 93.3% of species having single-copy proteins in any orthogroup. The ortholog phylogeny of the AB species (Supplementary Figure S4b) showed that P. pinodes, P. pinodella, P. koolunga, A. rabiei and A. lentis diverged from a common ancestor. Evolutionary events led to the divergence in the tree, with P. pinodes and P. pinodella being more closely related to each other, and P. koolunga being more closely related to A. rabiei and A. lentis.
The percentages of core (84%) versus variable (16%) genes from Orthovenn2 were highly similar across the species, although the number of genes in each class was different (Supplementary Table S6). The Orthovenn2 results were confirmed using OrthoFinder, and the results were very similar, with only small variations.

3.11. Gene Duplication Events

OrthoFinder considers gene events to be well supported when both copies of the duplicated gene are retained in at least 50% of the descendant species. Seventy-eight well-supported gene duplication events were revealed at node N8 (Supplementary Figure S4c), leading to the speciation of P. pinodes, P. pinodella, P. koolunga, A. rabiei and A. lentis. One hundred gene duplication events occurred at node N11, where P. pinodes separated from P. pinodella, and further duplication events took place to differentiate the isolates within these species. Furthermore, at node N10, 29 gene duplication events led to the speciation of P. koolunga, A. rabiei and A. lentis.

3.12. CAZyme Analysis

The degradation of plant cell walls plays an important role in the colonization and pathogenicity of plant pathogenic fungi. The fungal CAZyme repertoire provides crucial information on their lifestyle. The annotation of carbohydrate active enzymes (CAZymes) performed using HMMER, DIAMOND, Hotpep and CGCFinder indicated that the annotated number of CAZymes ranges from 457 to 609, which was on average 4.6% of the total predicted proteins for these isolates (Supplementary Table S7). CAZymes were grouped according to their classification, which included glycoside hydrolases (GHs), glycosyl transferases (GTs), polysaccharide lyases (PLs), carbohydrate esterases (CEs), auxiliary activities (AAs), and carbohydrate-binding modules (CBMs), as shown in Supplementary Table S7. The results revealed that GHs were the most abundant CAZyme class for all of our AB isolates, followed by GTs and AAs, with the least abundant CAZyme class being CBMs. All of the AB isolates across the three species showed similar CAZyme profiles. There was a positive correlation observed between the total number of CAZymes and the number of predicted protein coding genes (PCGs) in the genome (Supplementary Figure S5a). The total number of CAZymes and the distribution of different CAZyme classes for reference Isolate2Pk (P. koolunga), Isolate3Pp (P. pinodes) and Isolate18Ppll (P. pinodella) were compared to other Ascomycota species (Figure 6a) and, collectively, similar profiles were observed with other published AB species, Ascochyta rabiei and A. lentis.
The analysis of plant-cell-wall-degrading CAZymes (Figure 6b) revealed an abundance of lignin degradation enzymes AA3 and AA9. The next most abundant CAZymes were β-glycosidases (GH3), cellulases (GH5) and the hemicellulolytic enzyme α-arabinosidase (GH43). The pectin depolymerizing enzymes included polygalacturonases (GH28 and GH78) and polygalacturonic lyases (PL1, and PL3). For the ascomycete-specific CAZymes GH94, GH130, PL10 and GH76, analysis showed from seven to 11 copies of GH76, one to two copies of GH94, and no GH130 or PL10, in our dataset. For CAZymes involved in fungal cell wall degradation, the analysis revealed the highest numbers for chitinase (GH18) and glucanase (GH16) compared to the other CAZymes such as GH27, GH92, and GH79 (Supplementary Figure S6).

3.13. Secondary Metabolite Gene Cluster Analysis

The analysis of biosynthetic gene clusters (BGCs) using the fungal AntiSMASH web server identified 19 to 28 BGCs per genome (Supplementary Figure S7a). The BGCs observed included non-ribosomal peptide synthase (NRPS, NRPS-like), polyketide synthase (PKS), terpene, indole cluster, ribosomally synthesized and post-translationally modified peptides (RiPPs), β-lactone, and various hybrids of PKS/NRPS clusters. Fungal-RiPPs and β-lactone were specific to P. pinodella and P. pinodes species. The hybrid NRPS/T1PKS/indole was found in only isolate1Pk of P. koolunga. P. koolunga species generally had higher numbers of NRPS and T1PKS (Type1 PKS) clusters, while P. pinodella and P. pinodes generally had higher numbers of terpene clusters (Supplementary Figure S7b–d).

3.14. AB Species Mitochondrial Genomes

Sequencing reads that mapped to the M. pinodes mitogenome were assembled using wtdgb2, which resulted in single mitochondrial contigs for all of the AB isolates. The published M. pinodes mitogenome (55.9 Mbp) is very similar in length to the P. pinodes mitogenome assembled in this study (Table 6). The total base pair length ranged from 48 kb to 73 kb, with P. koolunga isolates having the largest mitochondrial genomes and P. pinodella isolates having the smallest. The GC content was between 28% and 29% for all of the isolates (Table 6). The genes identified included twelve core protein coding genes and two ribosomal RNA coding sequences and tRNAs corresponding to all 20 amino acids, with total numbers ranging from 25 to 29 (Supplementary Table S8). The NADH-dehydrogenase subunit 5 encoding gene (nad5) copy number was significantly lower in P. koolunga (3–5) compared to the other AB species (8–13). In addition, two putative mitochondrial ribosomal protein genes (rps3 and rps5) were identified for the AB isolates, as well as two mitochondrial ribosomal RNA genes (rrnL and rrnS). The DNA-dependent RNA polymerase gene (rpo) was only observed in P. koolunga isolates. A graphical representation of the genomes for the reference isolates was drawn using CHLOROBOX (Figure 6a–c). The genes on the outside of the ring are from the direct strand, and the genes on the inside are from the reverse strand. RNAweasel analysis (Supplementary Table S9) revealed the presence of the RNA subunit of the mitochondrial RNAse P gene (rnpB). P. koolunga mitochondrial genes had the largest number of introns compared to the other AB species, followed by P. pinodes. P. koolunga species also had the highest number of mitochondrial tRNA genes compared to P. pinodella and P. pinodes.
The mitochondrial ribosomal protein gene rps3 was observed to be present in all of the AB isolates; however, the rps5 gene was observed only in some isolates across species, including Isolate1Pk, Isolate22Pk, Isolate42Pk, Isolate113Ppll, Isolate4Pp, and Isolate5Pp (Supplementary Table S8). The location of the rps3 and rps5 genes varied among the species. In P. koolunga, rps3 and rps5 genes were usually located between nad1 and nad2 genes; however, rps3 was sometimes found between trnL1 and trnF genes. In both P. pinodella and P. pinodes, rps3 was generally located between nad4 and cob.
Mitochondrial genome annotation revealed the presence of only Group 1 introns in all of the field pea AB isolates sequenced in the study. The total number of mitochondrial introns ranged from 34 to 47 (Supplementary Table S9), with P. koolunga having the highest number of introns in its mitochondrial genome and P. pinodella having the lowest number. The Cox1 gene that encodes cytochrome c oxidase I had the highest number of introns in all of the AB species, followed by cob in P. koolunga and P. pinodes (Supplementary Table S10). In P. pinodella, Cob, Cox2 and Cox3 had the second-highest number of introns. Several homing endonucleases (HEs) from the family LAGLIDADG and GIY, which aid in the self-splicing of introns, were observed in all of the AB isolates. Potential trans-splicing was also detected for the Cox1, Cox2, Nad5, Cob and Nad2 genes.
Synteny analysis using Mauve showed mitochondrial gene order conservation across AB species (Figure 7). Highly syntenic homologous regions were detected within species, and variations in gene order and length were observed between species. P. koolunga species showed mitochondrial genome architectures that were distinct from P. pinodes and P. pinodella. P. pinodes and P. pinodella were quite similar, although an inversion was observed within P. pinodella species, as illustrated by the blue colinear block (Figure 7d).
Codon usage bias has been studied in order to understand the codon usage pattern of the AB species and has been shown in previous studies to provide insight into their evolutionary trajectories. Codon usage was observed to be similar in pattern among the AB species (Supplementary Table S11). Overall, P. koolunga had a slightly greater number of total amino acids, followed by P. pinodes. The codons with a significantly high frequency (>900) include Phe (TTT), Lys (AAA), Leu (TTA), Tyr (TAT), Asn (AAT) and Ile (ATA, ATT). There is about a two-fold preference of stop codon TAA usage compared to TAG across the AB species.

4. Diagnostics

Previous studies have shown that differentiating the AB species, particularly P. pinodes and P. pinodella, is challenging using traditional morphological methods. We mapped the field pea AB whole-genome assemblies to the most relevant fungal barcoding genes, which included protein coding genes, which are known for resolving fungal species. The comparison of AB genome assemblies to fungal barcoding genes such as internal transcribed spacer (ITS), RPB2, transcription elongation factor 1α (Tef1), β-tubulin and topoisomerase 1 (TOP1) was consistent with the whole-genome phylogeny in revealing that P. koolunga is more distantly related to the other AB species. It was difficult to distinguish P. pinodes from P. pinodella using ITS, β-tubulin and RPB2. Tef1 and TOP1 were found to be the best candidates for species differentiation (Supplementary Figure S8a–e) between the two Peyronellaea species. Furthermore, genetic distance based on kmers was used to build a parsimony mitochondrial phylogenetic tree (Supplementary Figure S8f) showing the mitogenome relationship among the AB species. The clear separation of P. pinodes, P. koolunga and P. pinodella was observed, as is consistent with the phylogeny determined using whole-genome assemblies.

5. Discussion

Although AB of field peas has been studied for many years, with literature on the subject dating as far back as 1944 [112], there remain significant gaps in the literature that limit our understanding of the essential features of the disease. Elements such as the molecular basis underlying the pathogenesis, pathogen–complex interaction, host–pathogen interaction, and disease epidemiology require the detailed genome analysis of the pathogens causing AB. This study reports the first whole-genome assemblies and comparative analysis of P. koolunga, P. pinodella and P. pinodes, the three primary species of the AB complex in Australia. The draft genome assemblies generated from long-read sequencing were within the expected genome size for the Ascomycota phylum (average 36.9 Mb), with some isolates having genomes larger than the average genome size for plant pathogenic fungi of 39.4 Mb [113,114,115]. The genome sizes for P. pinodella and P. pinodes at approximately 36 Mb were comparable to the assembled draft genomes of other Ascochyta species affecting legumes such as A. rabiei (40 Mb) [116] and A. lentis (42 Mb) [117]. However, a larger genome of approximately 56 Mb was observed for P. koolunga, which is unsurprising, as large genomes have been confirmed for Dothideomycete species [118,119,120]. The large genome size for P. koolunga is almost entirely due to a high proportion of repeat elements, including repeat expansion and contraction, and this could be the driving force for genome evolution in the species, as has been observed for Pyrenophora teres that cause net blotch in barley, with genome sizes ranging from 41 Mb to 51 Mb for the two Formae speciales f.sp. maclata and f.sp teres [121].

5.1. Near-Chromosome-Level Genome Assembly

The chromosome number for fungal species has been observed to range from as few as three (Zolan, 1995) to 21 (haploid) [117,122], which is comparable to our reference genome assemblies. The manual observation of our assemblies revealed the presence of TTAGGG repeats that are characteristic of fungal telomeres at the ends of P. pinodes and P. pinodella scaffolds. Pulsed-field gel electrophoresis of A. rabiei isolates from 21 countries, close relatives to the field pea AB species, revealed a chromosome number between 12 and 16. Other techniques such as optical mapping have been used to improve genome assemblies [123]. Optical mapping can further be used to improve assemblies such as Isolate22Pk with over 200 contigs and a sequencing depth of 32×. However, Isolate3Pp, Isolate18Ppll, Isolate72Ppll, and Isolate87Ppll, with scaffold numbers between 12 and 18 having had deep long-read sequencing coverage up to 190× with correction, even without optical mapping, are near chromosome-level assemblies [116,122]. There is a complete lack of descriptions of 1n and 2n forms of the AB fungi in the literature; the original descriptions of the species [17] and large taxonomic papers [6] lack this information. Information about ploidy is important in order to carry out genetic engineering and design efficient gene manipulation tools for the AB species. Although AB species ploidy was not estimated in this study, the assemblies generated can be used to determine it using computing tools such as nQuire and the K-mer counting approach [124,125]. The number of coding gene sequences (9717–12,249) was also within the range observed for Ascomycota species such as N. crassa (9820), A. lentis (11,638), and L. maculans (12,469). The rRNA and tRNA numbers were comparable to what has been found in the literature for fungal species within the Ascomycota phylum [116,117,126,127,128,129]. Overall, these AB genome assemblies are of high quality, and will be a valuable tool to facilitate the characterization of field pea AB populations, identify evolutionary drivers, and develop diagnostic and monitoring tools that would enable the advancement of durable and targeted management strategies.

5.2. AB Nuclear Genome Structural Variation

The synteny analysis of our isolates revealed high genomic conservation between species, mostly between P. pinodes and P. pinodella compared to P. koolunga. Host and cultivar specificity in closely related plant pathogenic fungi can be influenced by chromosomal rearrangements and presence–absence variations in key pathogenicity genes.
Chromosomal rearrangements were observed between the AB species, including the sectional translocation of genomic regions among species, which has been observed in other fungi, including A. rabiei and A. lentis [130,131,132,133]. The high repeat expansion observed for P. koolunga compared with other field pea AB species confirms that the large genome size of P. koolunga is likely due to large-scale evolution through repeat element expansion, and this could have an impact on pathogenicity and lineage-specificity, as genes near TEs could be altered, giving them new functions [121,134]. The presence of species- and isolate-specific TEs among AB species sheds some light on the level of genome diversity possible within AB populations. Simple sequence repeats (SSRs) are the most abundant in the AB genomes, followed by long terminal repeat (LTR) elements such as Gypsy. The most abundant TEs in the literature are the LTR retrotransposons Gypsy and Copia, and DNA Transposons such as Mariner. The percentages of repeat elements and TEs in fungal genomes have been reported to vary significantly among species [120,135,136,137]. TEs are known to play diverse roles in the genome, including the promotion of genome variability, expansion, increased fitness, and adaptability [138]. The DNA transposon OPHIO was identified in the P. pinodella and P. pinodes genome assemblies. These have been reported to provide genomic responses to biotic and abiotic stressors in the environment, highlighting possible roles in these species [139]. Further investigation into these TEs will provide clarity on whether they are functional, and information about the specific roles they play in the AB species genome architecture.
The distinct bimodal distribution of GC content bias observed for P. koolunga and P. pinodella signifies the presence of large proportions of AT-rich regions, especially in P. koolunga, which is consistent with the BUSCO GC% obtained for the AB genome assemblies. Highly AT-rich genomes are usually associated with a high content of repeat elements such as transposable elements (TE) [36,140]. TEs have been linked to the conferring of advantages in genetic diversity, adaptation and environmental fitness when expressed in the genome [141]. This gave rise to the “two speed genome” model, which was developed to account for the fact that TEs were observed to be in gene-sparse areas of the genome, and were associated with effector genes [36,119,142]. However, the presence of a high percentage of repeat elements in the genome does not always translate to high expression rates, as we can see in the AB transcriptome repeat analysis results. P. koolunga, having the highest repeat percentage, seems to have the lowest number of expressed repeats compared to P. pinodes and P. pinodella. This could be due to the fungal mechanism designed against the propagation of transposable elements known as repeat-induced point mutation (RIP) [143,144]. RIP has been found to deplete GC content, thereby increasing AT content through irreversible transitions of cytosine (C) to thymine (T) [145]. In silico RIP analysis showed the presence of RIP in all of the field pea AB species analysed, with P. koolunga having the most extensive RIP (42%) compared to P. pinodella (11%) and P. pinodes (3%). This suggests that most of the repeats in the P. koolunga genome have been silenced, which explains why even though P. koolunga has the highest repeat content in its assembled genome, it expresses the lowest number of repeat elements in its transcriptome. RIP tends to occur during the sexual phase when dikaryotic cells proliferate [146]. Extensive RIP is often found in fungi with sexual reproduction capabilities [147], and given that the sexual stages of P. pinodella and P. koolunga have not yet been observed, this result suggests that P. pinodella and P. koolunga too might have the capacity for cryptic sexual reproduction, as has been reported for Aspergillus and Penicillium species [146], or might represent ancestral RIP activity, as has been observed in other asexual fungi [146,148,149]. Overall, the differences in the repeat content, both in the genome and transcriptome, suggest the AB pathogens have had different evolutionary trajectories, which should be taken into consideration when developing disease management strategies. The presence of diverse drivers of evolution between field pea AB species would elicit different host response genes among the species upon infection, as has been observed previously [150].

5.3. Orthologous Gene Cluster and Pangenome Analysis

Much more intra-species homology was observed among P. pinodes isolates compared to P. pinodella and P. koolunga. P. pinodes had more homology with P. pinodella compared to P. koolunga, corroborating our results from phylogeny. Pangenome analysis using protein homology did not show significant genome variation among AB species, with about 16% of the genomes accounting for accessory genes. However, some fungal species have been reported to have a higher percentage of accessory genes, such as the 63% reported for Zymoseptoria tritici [151]; the 16% observed in the AB species is sufficient to provide diversity in adaptability, virulence and pathogenicity in the field pea AB species, as has been observed for other fungal species, including Saccharomyces cerevisiae (~14%) and Aspergillus fumigatus (~16%) [46]. The gene ontology (GO) analysis of unique orthologous gene clusters revealed genes responsible for various metabolic processes and molecular functions, including pathogenesis. Interestingly, heterokaryon incompatibility protein 6 is unique to P. pinodes. This protein is responsible for non-self-recognition, which plays a crucial role in the vegetative recognition system in filamentous fungi. P. pinodes is the only species with a homothallic mating type, and so heterokaryon incompatibility protein 6 could play a role in the regulation of genotypic diversity and gene flow in the species.

5.4. AB Mating Type Determination

Mating type genes have been confirmed previously for P. pinodella and P. pinodes [152,153,154]. P. pinodella has been observed to exhibit a heterothallic mating pattern, having either one or the other mating type locus, and P. pinodes has been observed to be homothallic, having both mating types [154]. Our results from whole-genome sequencing agree with these findings, with heterothallism being evident for all of the P. pinodella isolates sequenced, and with homothallism being evident for all of the P. pinodes isolates. The two idiomorphs of the homothallic P. pinodes isolates were observed to be on the same scaffold and in close proximity, as has been reported for homothallic ascomycete species in Gibberella zeae [155] and Chaetomium globosum [156]. On the other hand, the mating type for P. koolunga has not been defined previously, and from our analysis we can conclude that the species exhibits a heterothallic mating pattern. This is similar to the mating type patterns observed for A. rabiei, A. lentis and A. fabae, which show a very close phylogenetic relationship to P. koolunga, as well as Phoma species such as Phoma clematidina [117,154,157,158,159].

5.5. Phylogeny

The congruence observed between the whole-genome and ortholog inference phylogeny of AB species showed a clear separation of the species, particularly P. pinodella and P. pinodes. The clear speciation of the AB species inferred in the phylogenetic analysis implies there is enough genetic variation between these species to be able to develop molecular markers for diagnostics. Previous research has reported the inability to differentiate P. pinodella and P. pinodes using ITS, and our results confirm this, showing P. pinodella and P. pinodes clustering together in the ITS dendrogram. Although protein coding genes have been proven to give a better resolution of the phylogeny, not all of them are able to provide a high resolution for all of the fungal species. Our results showed the low resolution of the species observed for RPB2 and Beta tubulin. These AB species were classified using a CAPS assay based on RPB2 gene, and the misidentification of some of the isolates has been observed, signifying the low resolution of the RPB2 gene for AB species P. pinodella and P. pinodes. Tef1 and TOP1 displayed the high species resolution of P. pinodella and P. pinodes, making them strong candidates as barcoding markers for AB species identification.
Gene duplication events have been known to play important roles in the evolution of species by giving rise to new genes that code for proteins with potentially novel functions, which could include increased fitness and phenotypic diversity [160,161,162,163]. Here, we see that gene duplication played a major role in the speciation of the AB species separating P. pinodes and P. pinodella. Further analysis can be carried out to identify the specific genes duplicated, the resulting genomic structure, and the impact of the duplication events.

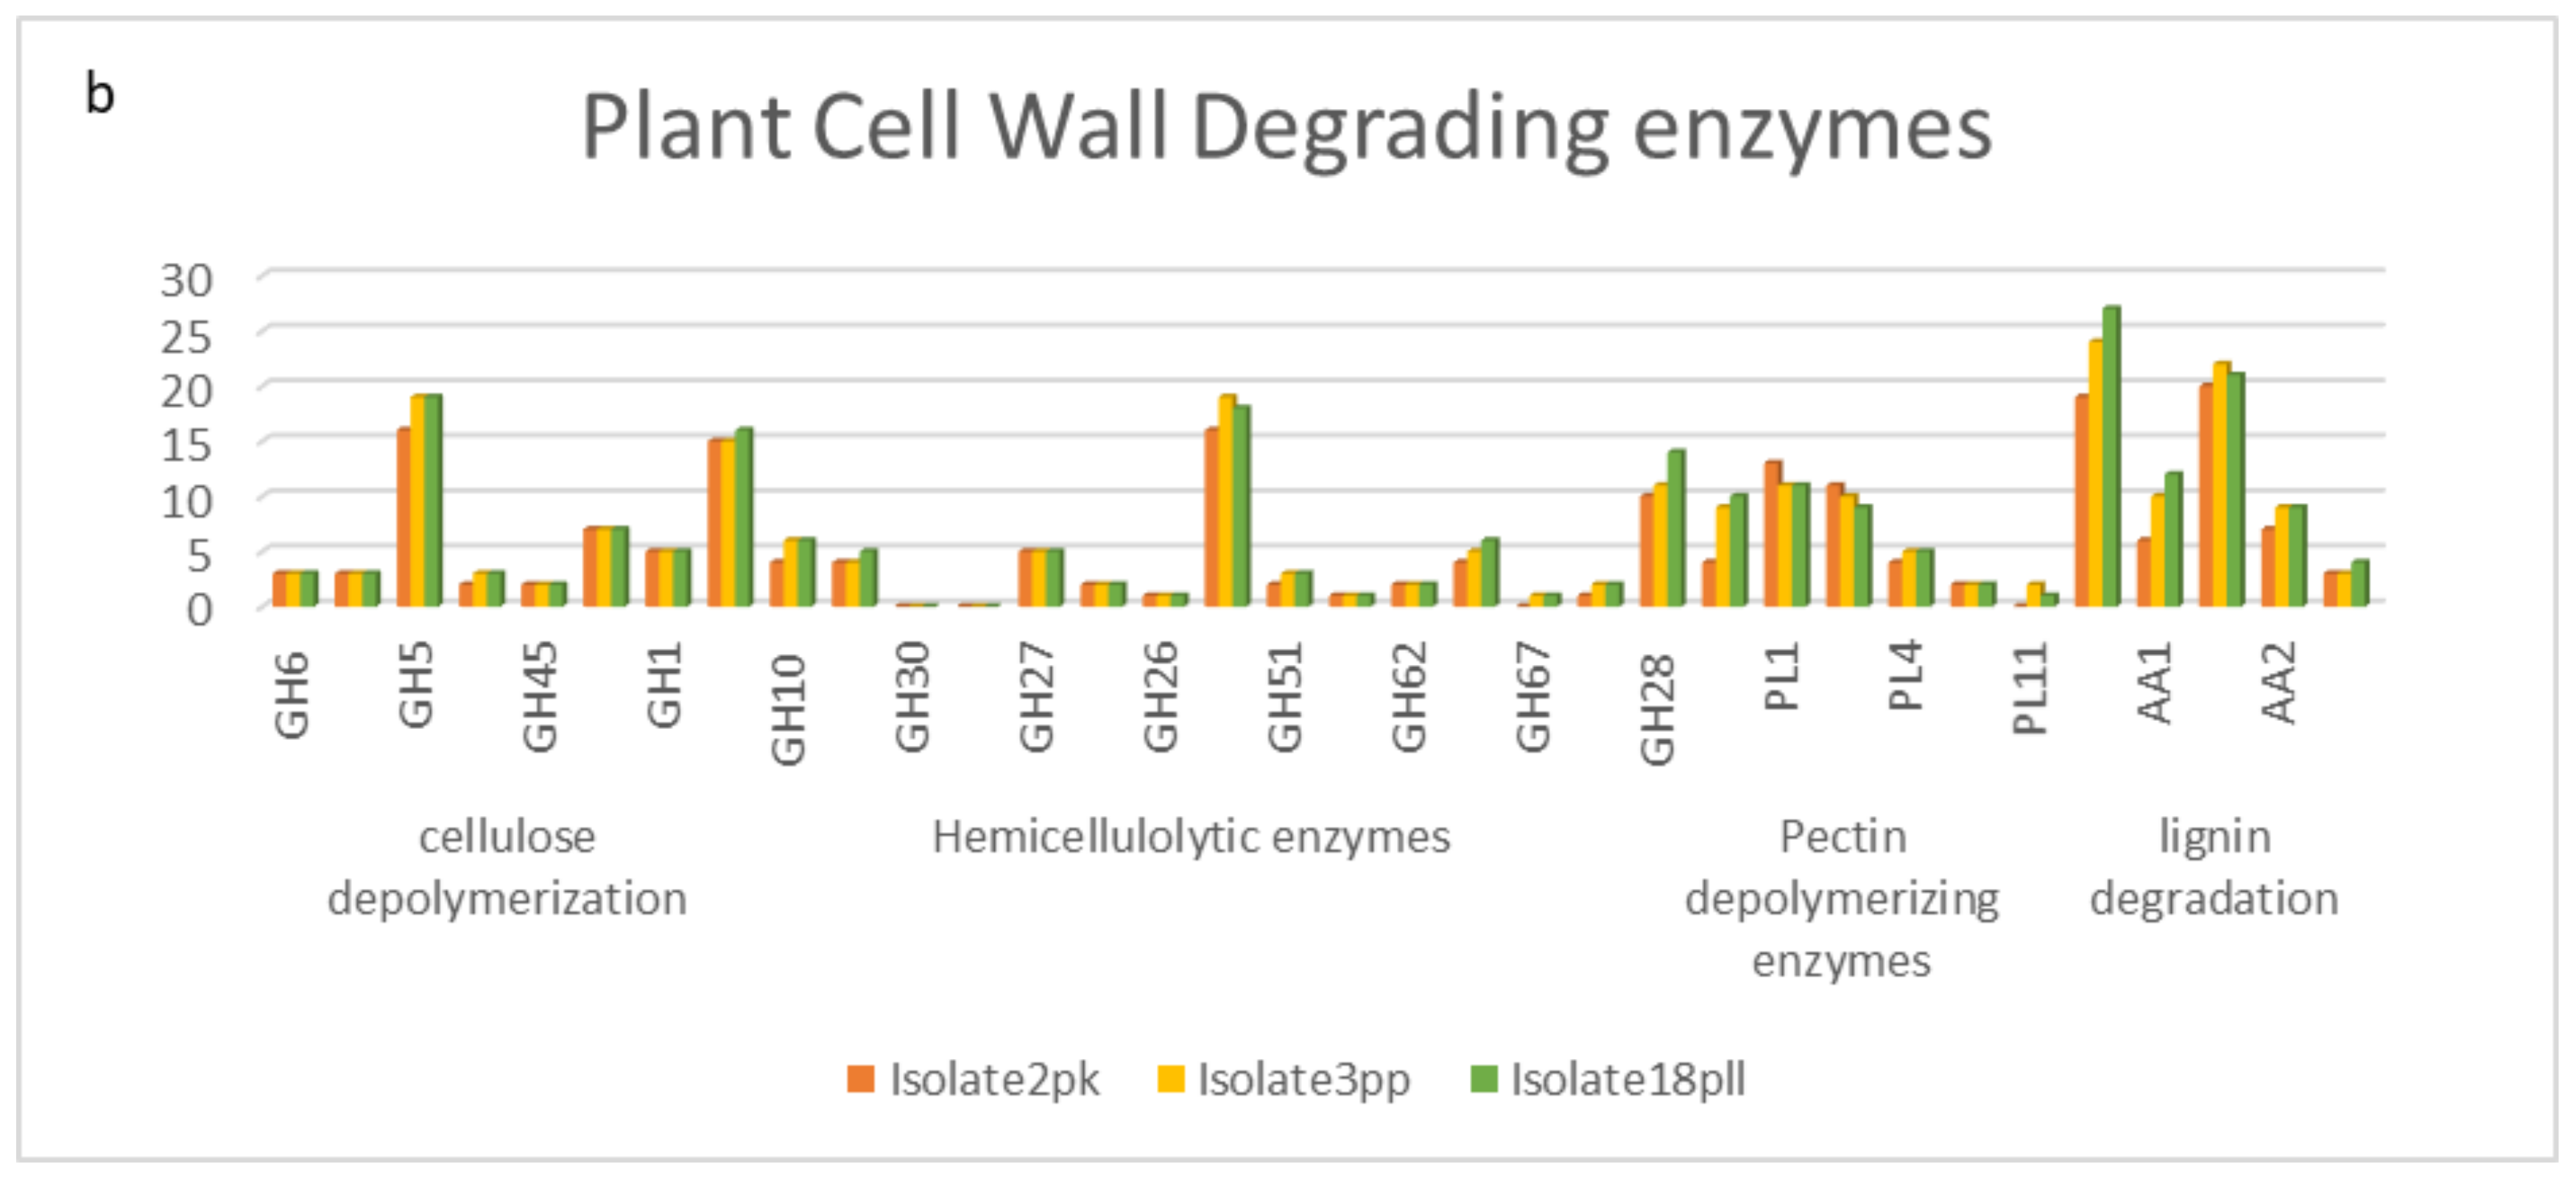
5.6. CAZyme Analysis

Predicted CAZymes also fall within the range of number and class distributions reported for plant necrotrophic fungi, with approximately 400–850 CAZymes in total, which is in line with the observed necrotrophic lifestyle for the field pea AB isolates [164]. The analysis of specific cell wall degrading enzymes reveals a high number of cellulose depolymerization, hemicellulolytic, pectin depolymerization and lignin degradation enzymes signifying major food sources for AB fungus. Pea has been reported to contain 32% hemicellulose, 27% cellulose, 41% pectin and at least 5.3% lignin. The AB species cell wall degradation repertoire reflects the enzymes that are responsible for successful pathogenicity of the pea plant [165,166]. An increased host range is equally proportional to the diversity of CAZymes in the fungal genome, as has been described for Macrophomina phaseolina (Islam MS, et al., 2012). The large CAZyme repertoire for the AB species suggests a broad host range, which is in congruence with host specificity experiments carried out for the species [167,168,169,170].

5.7. Secondary Metabolite Analysis

Fungal secondary metabolites (SMs) have been reported to play significant roles in pathogenicity, infection, and host specificity in necrotrophs [171,172,173]. Biosynthesis of fungal SMs is carried out by co-regulated genes, usually clustered at a genomic locus referred to as a biosynthetic gene cluster (BGCs). AB species’ genome-wide BCGs are in the range observed for C. fulvum (23) and S. sclerotiorum (29) which are also plant pathogenic fungi [174,175]. Ascomycete-specific PKS-NRPs hybrids were present in all of the AB isolates, and this agrees with their phylum identification [176]. Hybrid metabolites are known to be common in fungi, and we observed a few of them with moieties from different classes, including NRPS, T1PKS, and indole observed in one P. koolunga isolate.
Fungal-RiPPs are a class of BGCs that produce metabolites with a diverse variety of bioactivities involved in defence, competition, communication, and virulence [177,178,179,180]. RiPPs have been extensively characterized in plants and bacteria but are underexplored in fungi, although their first identification was in a fungus [181]. Fungal-RiPPs were observed in P. pinodella and P. pinodes species, indicating a possible role specific to these species compared to P. koolunga. Further characterization would be needed in order to identify the biosynthetic potential of these BCGs in these species. β-Lactones are also an underexplored class of fungal BGCs linked to several antimicrobial activities [182], and were also found to be specific to P. pinodella and P. pinodes species.
Terpenes and terpenoids play diverse roles in fungi: they can function as toxins, promote growth, and have antifungal properties [176,183]. The high production of terpenes has been observed in Phoma sp., which along with other volatile organic chemicals exhibit antifungal properties to certain fungal species, which is a possible defence mechanism [184]. However, it is unsurprising that P. koolunga, also a Phoma sp., exhibited a higher production of terpenes compared to the other AB species. Consequently, all of the AB species can be present on the plant at the same time, and so our results imply that the SMs repertoire of the individual AB species could either be tolerant to the other AB species in the complex or could serve to reduce competition; the latter has been reported [185].
Overall, the SMs diversity observed for the field pea AB species reveals that P. pinodella and P. pinodes species are more alike in their SM repertoire compared to P. koolunga. Although their host specificity overlaps, they seem to deploy different bioactive mechanisms, which could be why they elicit different host response genes, and resistance to one species does not translate to resistance to other species within the complex. P. pinodes is a broad host range fungus, being able to infect numerous legumes [169]; however, no research on host range specificity has been conducted for P. pinodella. Given the high genomic similarity between these two AB species, P. pinodella could possibly have a similar host range beyond field pea, similarly to P. pinodes.

5.8. Mitochondrial Genome Assembly

Although the mitochondrial genome size varied among the species and isolates, the numbers fall within the reported mitochondrial genomes for Ascomycota species [116,117,186,187,188,189]. There is a positive correlation between the mitochondrial genome length and number of introns. The genome size for P. koolunga was close to that reported for closely related species A. lentis and A. rabiei. The gene order observed shows high synteny within AB species. The number of protein coding genes observed is within that reported for several fungi [190,191]. Recent research characterizing introns and their HEGs across the fungi phyla reveal varying numbers of introns in protein coding genes, with the highest number in the cox1 gene, followed by cob and nad5 [190]. Genes with introns within AB species include cox1, cox2, cox3, cob, nad1, nad5 and nad4L. Similar gene interruptions have been reported for Aspergillus sp., Saccharomyces sp., Podospora sp., Neurospora sp. and Penicillium sp. [188,190,192,193,194]. Interestingly, potential trans-splicing mediated by group 1 introns was observed within cox1, cox2, nad5, cob and nad2 genes across all of the AB species. Trans-splicing has been reported in animals, plants, green algae, and fungi [195,196,197,198,199,200,201]. Most of these reports are for cox1 genes, and nothing has been reported for cox2, nad5, cob and nad2, although Cis-spliced group 1 introns have been observed in cox1 and nad5 in fungi [202]. Additional analysis would be required in order to confirm this based on evidence of a ligated mature mRNA at exon–intron junctions and a complete intron RNA structure [195]. Furthermore, the presence of T7 phage-like single-subunit RNA polymerase (rpo) in only P. koolunga species suggests the insertion of a plasmid into its mitochondrial DNA. These rpo genes have been identified in other ascomycete fungi, and they are reported to be most likely non-functional, possibly fragmented, and eventually lost (Lang 2018). Previous research found that rpo was only found in species belonging to the fungal phyla Ascomycota, Basidiomycota and Chytridiomycota. Although rpo homologs were found in both Ascomycota and Basidiomycota fungal species, this was only in 10% of the Ascomycota species (227) sampled, compared to 57% for Basidiomycota (116) [203]. This means that P. koolunga is among a small percentage of species within the Ascomycota phylum that harbours an rpo homolog. Rpo-based phylogeny revealed both phyla-specific clades and rpo sequences that are shared between species of different phyla. This diversity of rpo sequences observed in the literature suggests a possible horizontal gene transfer between fungal species [203,204,205]. The mitochondrial codon usage for the AB species is similar to that reported for other ascomycete fungi [187]. A preference for AT-rich codons contributes to the low GC content (28–29%) in the AB species which has been observed for Aspergillus sp. and Penicillium sp. [188].
Phylogenetic analysis of the AB mitochondrial genomes reveals clear species separation, which can be further explored as barcoding markers for the species. This can be a standalone marker depending on its specificity to the species, or in addition to the other protein coding gene markers highlighted.

6. Conclusions

AB pathogens appear to have different evolutionary drivers, a broad host range as a result of their large CAZyme repertoire, a diverse secondary metabolite range, and mitochondria that are highly prone to mutation due to the action of homing endonuclease and repeat elements, which could have a significant impact on management strategies and the development of cultivar resistance. Plant pathogenic fungi make use of mitochondria proteins as well as nuclear proteins for the successful invasion, colonization, and pathogenicity of their plant host, provoking disease as well as encoding genes for resistance to host defense mechanisms. The 18 AB mt genomes developed in this study can enable future research into understanding AB mt biological significance with respect to disease pathogenicity, virulence, and function, even at the population level.

Supplementary Materials

The following supporting information can be downloaded at: https://www.mdpi.com/article/10.3390/jof8080884/s1, Table S1: AB species and origin; Table S2: shows raw data generated from sequencing; total read length and coverage for AB isolates.and origin; Table S3: Transcriptome sequencing statistics for AB; Table S4: Top ten repeat elements in AB species (RepeatMasker); Table S5: Mating type determination for AB species; Table S6: Numbers of core, variable, and unique genes in the three AB species using the reference isolates; Isolate2Pk, Isolate3Pp, Isolate18Ppl; Table S7: CAZyme profile of AB species; Table S8: Mitochondrial genome annotation of AB isolates using MITOS2. Pk- P. koolunga, pll- P. pinodella, pp- P. pinodes; Table S9: Mitochondrial annotation of AB isolates using RNAweasel. Pk- P. koolunga, pll- P. pinodella, pp- P. pinodes; Table S10: Mitochondrial genome intron distribution within protein coding genes among AB species. t/s: potential trans-splicing; Table S11: Mitochondrial genome codon usage in AB species; Figure S1: Blast2go top-hit species distribution for AB reference isolates a: P. pinodes, b: P. pinodella and c: P. koolunga; Figure S2: Dot plot comparing intraspecies AB genome assemblies aligned to its reference genomes (top 3 rows) and between the AB species (bottom); Figure S3: Repeat analysis for AB species; Figure S4: Whole genome and ortholog phylogeny of AB species; Figure S5: AB CAZyme analysis; Figure S6: Fungal cell wall degrading CAZyme analysis; Figure S7: Biosynthetic gene cluster (BCG) analysis of AB isolates; Figure S8: Fungal barcoding genes.

Author Contributions

Conceptualization, S.K. and H.D.D.; methodology, Y.O.O., S.K., H.D.D. and T.I.S.; software, Y.O.O., S.K., R.C.L., H.D.D. and T.I.S.; validation, Y.O.O., S.K., R.C.L., H.D.D. and T.I.S.; formal analysis, Y.O.O., T.I.S. and R.C.L.; investigation, Y.O.O.; resources, S.K. and R.C.L.; data curation, Y.O.O.; writing—original draft preparation, Y.O.O.; writing—review and editing, Y.O.O., S.K., R.C.L., H.D.D., B.G.C. and T.I.S.; visualization, Y.O.O., R.C.L. and T.I.S.; supervision, S.K., B.G.C., H.D.D. and T.I.S.; funding acquisition, S.K. All authors have read and agreed to the published version of the manuscript.

Funding

This research was funded by the Victorian Department of Jobs, Precincts and Regions, Australia, and the Grains Research and Development Corporation, Australia.

Institutional Review Board Statement

Not applicable.

Informed Consent Statement

Not applicable.

Data Availability Statement

The genome assemblies generated in this study is deposited in NCBI under BioProject PRJNA867522. The BioSamples accession numbers for the 18 AB isolates are SAMN30203642, SAMN30203643, SAMN30203644, SAMN30203645, SAMN30203646, SAMN30203647, SAMN30203648, SAMN30203649, SAMN30203650, SAMN30203651, SAMN30203652, SAMN30203653, SAMN30203654, SAMN30203655, SAMN30203656, SAMN30203657, SAMN30203658, and SAMN30203659.

Acknowledgments

The authors would like to acknowledge the support of the BASC team and the pulse team at Agriculture Victoria, AgriBio, Centre for AgriBioscience, for their administrative and technical support.

Conflicts of Interest

The authors declare no conflict of interest.

References

  1. Johansen, C.; Baldev, B.; Brouwer, J.B.; Erskine, W.; Jermyn, W.A.; Li-Juan, L.; Malik, B.A.; Ahad Miah, A.; Silim, S.N. Biotic and abiotic stresses constraining productivity of cool season food legumes in Asia, Africa and Oceania. In Expanding the Production and Use of Cool Season Food Legumes: A Global Perspective of Peristent Constraints and of Opportunities and Strategies for Further Increasing the Productivity and Use of Pea, Lentil, Faba Bean, Chickpea and Grasspea in Different Farming Systems; Muehlbauer, F.J., Kaiser, W.J., Eds.; Springer: Dordrecht, The Netherlands, 1994; pp. 175–194. [Google Scholar] [CrossRef]
  2. Timmerman-Vaughan, G.M.; Frew, T.J.; Russell, A.C.; Khan, T.; Butler, R.; Gilpin, M.; Murray, S.; Falloon, K. QTL Mapping of Partial Resistance to Field Epidemics of Ascochyta Blight of Pea. The research was funded by the New Zealand Foundation for Research, Science and Technology and by the Australian Grains R&D Corporation. Crop Sci. 2002, 42, 2100–2111. [Google Scholar] [CrossRef]
  3. Rubiales, D.; Fondevilla, S. Future Prospects for Ascochyta Blight Resistance Breeding in Cool Season Food Legumes. Front. Plant Sci. 2012, 3, 27. [Google Scholar] [CrossRef] [PubMed] [Green Version]
  4. Tivoli, B.; Baranger, A.; Avila, C.M.; Banniza, S.; Barbetti, M.; Chen, W.; Davidson, J.; Lindeck, K.; Kharrat, M.; Rubiales, D.; et al. Screening techniques and sources of resistance to foliar diseases caused by major necrotrophic fungi in grain legumes. Euphytica 2006, 147, 223–253. [Google Scholar] [CrossRef]
  5. Tivoli, B.; Baranger, A.; Muehlbauer, F.J.; Cooke, B.M. Ascochyta Blights of Grain Legumes; Springer: Dordrecht, The Netherlands, 2007. [Google Scholar] [CrossRef]
  6. Aveskamp, M.M.; De Gruyter, J.; Woudenberg, J.H.C.; Verkley, G.J.M.; Crous, P.W. Highlights of the Didymellaceae: A polyphasic approach to characterise Phoma and related pleosporalean genera. Stud. Mycol. 2010, 65, 1–60. [Google Scholar] [CrossRef] [PubMed]
  7. Davidson, J.A.; Wilmshurst, C.J.; Scott, E.S.; Salam, M.U. Relationship between ascochyta blight on field pea (Pisum sativum) and spore release patterns of Didymella pinodesand other causal agents of ascochyta blight. Plant Pathol. 2013, 62, 1258–1270. [Google Scholar] [CrossRef]
  8. Jones, L.K. Studies of the Nature and Control of Blight, Leaf and Pod Spot, and Foot-Rot of Peas Caused by Species of ASCO-Chyta; Number 547; Agricultural Experiment Station: New York, NY, USA, 1927; p. 46. [Google Scholar]
  9. Tran, H.S.; You, M.P.; Lanoiselet, V.; Khan, T.N.; Barbetti, M.J. First Report of Phoma glomerata Associated with the Ascochyta Blight Complex on Field Pea (Pisum sativum) in Australia. Plant Dis. 2014, 98, 427. [Google Scholar] [CrossRef]
  10. Tran, H.S.; Li, Y.P.; You, M.P.; Khan, T.N.; Pritchard, I.; Barbetti, M.J. Temporal and Spatial Changes in the Pea Black Spot Disease Complex in Western Australia. Plant Dis. 2014, 98, 790–796. [Google Scholar] [CrossRef] [Green Version]
  11. Liu, N.; Xu, S.; Yao, X.; Zhang, G.; Mao, W.; Hu, Q.; Feng, Z.; Gong, Y. Studies on the Control of Ascochyta Blight in Field Peas (Pisum sativum L.) Caused by Ascochyta pinodes in Zhejiang Province, China. Front. Microbiol. 2016, 7, 481. [Google Scholar] [CrossRef] [Green Version]
  12. Gorfu, D. Yield losses of fieldpea due to ascochyta blight in central Ethiopia. Pest Manag. J. Ethiop. 2000, 4, 89–95. [Google Scholar]
  13. Warkentin, T.D.; Rashid, K.Y.; Xue, A.G. Fungicidal control of ascochyta blight of field pea. Can. J. Plant Sci. 1996, 76, 67–71. [Google Scholar] [CrossRef]
  14. Xue, A.; Warkentin, T.; Kenaschuk, E. Effects of timings of inoculation with Mycosphaerella pinodes on yield and seed infection of field pea. Can. J. Plant Sci. 1997, 77, 685–689. [Google Scholar] [CrossRef] [Green Version]
  15. Tivoli, B.; Beasse, C.; Lemarchand, E.; Masson, E. Effect of ascochyta blight (Mycosphaerella pinodes) on yield components of single pea (Pisum sativum) plants under field conditions. Ann. Appl. Biol. 1996, 129, 207–216. [Google Scholar] [CrossRef]
  16. Bretag, T.W.; Keane, P.J.; Price, T.V. The epidemiology and control of ascochyta blight in field peas: A review. Aust. J. Agric. Res. 2006, 57, 883–902. [Google Scholar] [CrossRef]
  17. Davidson, J.A.; Hartley, D.; Priest, M.; Herdina, M.K.; McKay, A.; Scott, E.S. A new species of Phoma causes ascochyta blight symptoms on field peas (Pisum sativum) in South Australia. Mycologia 2009, 101, 120–128. [Google Scholar] [CrossRef]
  18. Beasse, C.; Ney, B.; Tivoli, B. Effects of pod infection by Mycosphaerella pinodes on yield components of pea (Pisum sativum). Ann. Appl. Biol. 1999, 135, 359–367. [Google Scholar] [CrossRef]
  19. Beasse, C.; Ney, B.; Tivoli, B. A simple model of pea (Pisum sativum) growth affected by Mycosphaerella pinodes. Plant Pathol. 2000, 49, 187–200. [Google Scholar] [CrossRef]
  20. Davidson, J.A.; Ramsey, M.D. Pea yield decline syndrome in South Australia: The role of diseases and the impact of agronomic practices. Aust. J. Agric. Res. 2000, 51, 347–354. [Google Scholar] [CrossRef]
  21. Garry, G.; Jeuffroy, M.H.; Ney, B.; Tivoli, B. Effects of Ascochyta blight (Mycosphaerella pinodes) on the photosynthesizing leaf area and the photosynthetic efficiency of the green leaf area of dried-pea (Pisum sativum). Plant Pathol. 1998, 47, 473–479. [Google Scholar] [CrossRef]
  22. May, C.L.; Schoeny, A.; Tivoli, B.; Ney, B. Improvement and validation of a pea crop growth model to simulate the growth of cultivars infected with Ascochyta blight (Mycosphaerella pinodes). Eur. J. Plant Pathol. 2005, 112, 1–12. [Google Scholar] [CrossRef]
  23. Warkentin, T.; Xue, A.; McAndrew, D. Effect of mancozeb on the control of Mycosphaerella blight of field pea. Can. J. Plant Sci. 2000, 80, 403–406. [Google Scholar] [CrossRef] [Green Version]
  24. McMurray, L.; Davidson, J.; Lines, M.; Leonforte, A.; Salam, M. Combining management and breeding advances to improve field pea (Pisum sativum L.) grain yields under changing climatic conditions in south-eastern Australia. Euphytica 2011, 180, 69–88. [Google Scholar] [CrossRef]
  25. Davidson, J.A.; Kimber, R.B.E. Integrated disease management of ascochyta blight in pulse crops. Eur. J. Plant Pathol. 2007, 119, 99–110. [Google Scholar] [CrossRef]
  26. Rodda, M.S.; Davidson, J.; Javid, M.; Sudheesh, S.; Blake, S.; Forster, J.W.; Kaur, S. Molecular Breeding for Ascochyta Blight Resistance in Lentil: Current Progress and Future Directions. Front. Plant Sci. 2017, 8, 1136. [Google Scholar] [CrossRef] [Green Version]
  27. Sharma, M.; Ghosh, R. An update on genetic resistance of chickpea to ascochyta blight. Agronomy 2016, 6, 18. [Google Scholar] [CrossRef] [Green Version]
  28. Islam, W.; Qasim, M.; Noman, A.; Idrees, A.; Wang, L. Genetic resistance in chickpea against Ascochyta blight: Historical efforts and recent accomplishments. J. Anim. Plant Sci. 2017, 27, 1941–1957. [Google Scholar]
  29. Faris-Mokaiesh, S.; Boccara, M.; Denis, J.B.; Derrien, A.; Spire, D. Differentiation of the “Ascochyta complex” fungi of pea by biochemical and molecular markers. Curr. Genet. 1996, 29, 182–190. [Google Scholar] [CrossRef]
  30. Madhosingh, C.; Wallen, V.R. Serological differentiation of the Ascochyta species on peas. Can. J. Microbiol. 1968, 14, 449–451. [Google Scholar] [CrossRef]
  31. Padder, B.A.; Kapoor, V.; Kaushal, R.P.; Sharma, P.N. Identification and Genetic Diversity Analysis of Ascochyta Species Associated with Blight Complex of Pea in a Northwestern Hill State of India. Agric. Res. 2012, 1, 325–337. [Google Scholar] [CrossRef] [Green Version]
  32. Tadja, A.; Benkada, M.Y.; Rickauer, M.; Bendahmane, B.S.; Benkhelifa, M. Characterization of Ascochyta as Pathological Species of Pea (Pisum sativum L.) at the North-West of Algeria. J. Agron. 2009, 8, 100–106. [Google Scholar] [CrossRef]
  33. Tayeh, N.; Aubert, G.; Pilet-Nayel, M.-L.; Lejeune-Hénaut, I.; Warkentin, T.D.; Burstin, J. Genomic Tools in Pea Breeding Programs: Status and Perspectives. Front. Plant Sci. 2015, 6, 1037. [Google Scholar] [CrossRef] [Green Version]
  34. Le May, C.; Chilvers, M.I.; Saucereau, A.L.; Guibert, M.; Peever, T.L. Spatiotemporal distribution of Ascochyta pinodes and Ascochyta pinodella during the winter growing season in France. Plant Pathol. 2018, 67, 1031–1045. [Google Scholar] [CrossRef]
  35. Spanu, P.D.; Abbott, J.C.; Amselem, J.; Burgis, T.A.; Soanes, D.M.; Stüber, K.; van Themaat, E.V.L.; Brown, J.K.; Butcher, S.A.; Gurr, S.J. Genome expansion and gene loss in powdery mildew fungi reveal tradeoffs in extreme parasitism. Science 2010, 330, 1543–1546. [Google Scholar] [CrossRef] [PubMed]
  36. Raffaele, S.; Kamoun, S. Genome evolution in filamentous plant pathogens: Why bigger can be better. Nat. Rev. Microbiol. 2012, 10, 417–430. [Google Scholar] [CrossRef]
  37. Chénais, B.; Caruso, A.; Hiard, S.; Casse, N. The impact of transposable elements on eukaryotic genomes: From genome size increase to genetic adaptation to stressful environments. Gene 2012, 509, 7–15. [Google Scholar] [CrossRef] [PubMed]
  38. Abby, S.; Daubin, V. Comparative genomics and the evolution of prokaryotes. Trends Microbiol. 2007, 15, 135–141. [Google Scholar] [CrossRef] [PubMed]
  39. Alcaraz, L.D.; Moreno-Hagelsieb, G.; Eguiarte, L.E.; Souza, V.; Herrera-Estrella, L.; Olmedo, G. Understanding the evolutionary relationships and major traits of Bacillus through comparative genomics. BMC Genom. 2010, 11, 332. [Google Scholar] [CrossRef] [PubMed] [Green Version]
  40. Guimarães, L.C.; de Castro Soares, S.; Trost, E.; Blom, J.; Ramos, R.T.J.; Silva, A.; Barh, D.; Azevedo, V. Genome informatics and vaccine targets in Corynebacterium urealyticum using two whole genomes, comparative genomics, and reverse vaccinology. BMC Genom. 2015, 16, S7. [Google Scholar] [CrossRef] [Green Version]
  41. Kato, R.B.; Jaiswal, A.K.; Tiwari, S.; Barh, D.; Azevedo, V.; Góes-Neto, A. Pan-genomics of fungi and its applications. In Pan-genomics: Applications, Challenges, and Future Prospects; Elsevier: Amsterdam, The Netherlands, 2020; pp. 251–260. [Google Scholar]
  42. Snipen, L.; Almøy, T.; Ussery, D.W. Microbial comparative pan-genomics using binomial mixture models. BMC Genom. 2009, 10, 385. [Google Scholar] [CrossRef] [Green Version]
  43. Lapierre, P.; Gogarten, J.P. Estimating the size of the bacterial pan-genome. Trends Genet. 2009, 25, 107–110. [Google Scholar] [CrossRef]
  44. Muzzi, A.; Masignani, V.; Rappuoli, R. The pan-genome: Towards a knowledge-based discovery of novel targets for vaccines and antibacterials. Drug Discov. Today 2007, 12, 429–439. [Google Scholar] [CrossRef]
  45. Tettelin, H.; Masignani, V.; Cieslewicz, M.J.; Donati, C.; Medini, D.; Ward, N.L.; Angiuoli, S.V.; Crabtree, J.; Jones, A.L.; Durkin, A.S. Genome analysis of multiple pathogenic isolates of Streptococcus agalactiae: Implications for the microbial “pan-genome”. Proc. Natl. Acad. Sci. USA 2005, 102, 13950–13955. [Google Scholar] [CrossRef] [PubMed] [Green Version]
  46. McCarthy, C.G.P.; Fitzpatrick, D.A. Pan-genome analyses of model fungal species. Microb. Genom. 2019, 5, e000243. [Google Scholar] [CrossRef] [PubMed]
  47. Brynildsrud, O.; Bohlin, J.; Scheffer, L.; Eldholm, V. Rapid scoring of genes in microbial pan-genome-wide association studies with Scoary. Genome Biol. 2016, 17, 238. [Google Scholar] [CrossRef] [PubMed] [Green Version]
  48. Plissonneau, C.; Hartmann, F.E.; Croll, D. Pangenome analyses of the wheat pathogen Zymoseptoria tritici reveal the structural basis of a highly plastic eukaryotic genome. BMC Biol. 2018, 16, 5. [Google Scholar] [CrossRef]
  49. Hartmann, F.E.; McDonald, B.A.; Croll, D. Genome-wide evidence for divergent selection between populations of a major agricultural pathogen. Mol. Ecol. 2018, 27, 2725–2741. [Google Scholar] [CrossRef] [Green Version]
  50. Peng, Y.; Li, S.J.; Yan, J.; Tang, Y.; Cheng, J.P.; Gao, A.J.; Yao, X.; Ruan, J.J.; Xu, B.L. Research Progress on Phytopathogenic Fungi and Their Role as Biocontrol Agents. Front. Microbiol. 2021, 12, 670135. [Google Scholar] [CrossRef]
  51. Lu, H.; Giordano, F.; Ning, Z. Oxford Nanopore MinION sequencing and genome assembly. Genom. Proteom. Bioinform. 2016, 14, 265–279. [Google Scholar] [CrossRef] [Green Version]
  52. Jain, M.; Fiddes, I.T.; Miga, K.H.; Olsen, H.E.; Paten, B.; Akeson, M. Improved data analysis for the MinION nanopore sequencer. Nat. Methods 2015, 12, 351–356. [Google Scholar] [CrossRef] [Green Version]
  53. Jain, M.; Olsen, H.E.; Paten, B.; Akeson, M. The Oxford Nanopore MinION: Delivery of nanopore sequencing to the genomics community. Genome Biol. 2016, 17, 239. [Google Scholar] [CrossRef] [Green Version]
  54. Schlaeppi, K.; Bender, S.F.; Mascher, F.; Russo, G.; Patrignani, A.; Camenzind, T.; Hempel, S.; Rillig, M.C.; van der Heijden, M.G. High-resolution community profiling of arbuscular mycorrhizal fungi. New Phytol. 2016, 212, 780–791. [Google Scholar] [CrossRef]
  55. Walder, F.; Schlaeppi, K.; Wittwer, R.; Held, A.Y.; Vogelgsang, S.; van der Heijden, M.G. Community profiling of Fusarium in combination with other plant-associated fungi in different crop species using SMRT sequencing. Front. Plant Sci. 2017, 8, 2019. [Google Scholar] [CrossRef]
  56. Heeger, F.; Bourne, E.C.; Baschien, C.; Yurkov, A.; Bunk, B.; Spröer, C.; Overmann, J.; Mazzoni, C.J.; Monaghan, M.T. Long-read DNA metabarcoding of ribosomal RNA in the analysis of fungi from aquatic environments. Mol. Ecol. Resour. 2018, 18, 1500–1514. [Google Scholar] [CrossRef] [PubMed]
  57. Tedersoo, L.; Albertsen, M.; Anslan, S.; Callahan, B. Perspectives and benefits of high-throughput long-read sequencing in microbial ecology. Appl. Environ. Microbiol. 2021, 87, e0062621. [Google Scholar] [CrossRef]
  58. Rhoads, A.; Au, K.F. PacBio sequencing and its applications. Genom. Proteom. Bioinform. 2015, 13, 278–289. [Google Scholar] [CrossRef] [Green Version]
  59. Ashton, P.M.; Nair, S.; Dallman, T.; Rubino, S.; Rabsch, W.; Mwaigwisya, S.; Wain, J.; O’grady, J. MinION nanopore sequencing identifies the position and structure of a bacterial antibiotic resistance island. Nat. Biotechnol. 2015, 33, 296–300. [Google Scholar] [CrossRef] [Green Version]
  60. Norris, A.L.; Workman, R.E.; Fan, Y.; Eshleman, J.R.; Timp, W. Nanopore sequencing detects structural variants in cancer. Cancer Biol. Ther. 2016, 17, 246–253. [Google Scholar] [CrossRef]
  61. Bolisetty, M.T.; Rajadinakaran, G.; Graveley, B.R. Determining exon connectivity in complex mRNAs by nanopore sequencing. Genome Biol. 2015, 16, 204. [Google Scholar] [CrossRef] [Green Version]
  62. Laver, T.; Harrison, J.; O’neill, P.; Moore, K.; Farbos, A.; Paszkiewicz, K.; Studholme, D.J. Assessing the performance of the oxford nanopore technologies minion. Biomol. Detect. Quantif. 2015, 3, 1–8. [Google Scholar] [CrossRef] [Green Version]
  63. Ip, C.L.; Loose, M.; Tyson, J.R.; de Cesare, M.; Brown, B.L.; Jain, M.; Leggett, R.M.; Eccles, D.A.; Zalunin, V.; Urban, J.M. MinION Analysis and Reference Consortium: Phase 1 data release and analysis. F1000Research 2015, 4, 1075. [Google Scholar] [CrossRef]
  64. Goodwin, S.; Gurtowski, J.; Ethe-Sayers, S.; Deshpande, P.; Schatz, M.C.; McCombie, W.R. Oxford Nanopore sequencing, hybrid error correction, and de novo assembly of a eukaryotic genome. Genome Res. 2015, 25, 1750–1756. [Google Scholar] [CrossRef] [Green Version]
  65. Jamy, M.; Foster, R.; Barbera, P.; Czech, L.; Kozlov, A.; Stamatakis, A.; Bending, G.; Hilton, S.; Bass, D.; Burki, F. Long-read metabarcoding of the eukaryotic rDNA operon to phylogenetically and taxonomically resolve environmental diversity. Mol. Ecol. Resour. 2020, 20, 429–443. [Google Scholar] [CrossRef] [PubMed]
  66. Tedersoo, L.; Anslan, S.; Bahram, M.; Kõljalg, U.; Abarenkov, K. Identifying the ‘unidentified’ fungi: A global-scale long-read third-generation sequencing approach. Fungal Divers. 2020, 103, 273–293. [Google Scholar] [CrossRef]
  67. Chen, S.; Zhou, Y.; Chen, Y.; Gu, J. fastp: An ultra-fast all-in-one FASTQ preprocessor. Bioinformatics 2018, 34, i884–i890. [Google Scholar] [CrossRef] [PubMed]
  68. Dobin, A.; Davis, C.A.; Schlesinger, F.; Drenkow, J.; Zaleski, C.; Jha, S.; Batut, P.; Chaisson, M.; Gingeras, T.R. STAR: Ultrafast universal RNA-seq aligner. Bioinformatics 2012, 29, 15–21. [Google Scholar] [CrossRef]
  69. Quinlan, A.R.; Hall, I.M. BEDTools: A flexible suite of utilities for comparing genomic features. Bioinformatics 2010, 26, 841–842. [Google Scholar] [CrossRef] [Green Version]
  70. Huang, Y.; Niu, B.; Gao, Y.; Fu, L.; Li, W. CD-HIT Suite: A web server for clustering and comparing biological sequences. Bioinformatics 2010, 26, 680–682. [Google Scholar] [CrossRef]
  71. Patro, R.; Duggal, G.; Love, M.I.; Irizarry, R.A.; Kingsford, C. Salmon provides fast and bias-aware quantification of transcript expression. Nat. Methods 2017, 14, 417–419. [Google Scholar] [CrossRef] [Green Version]
  72. Li, H. Minimap2: Pairwise alignment for nucleotide sequences. Bioinformatics 2018, 34, 3094–3100. [Google Scholar] [CrossRef]
  73. Okorski, A.; Pszczolkowska, A.; Jastrzebski, J.P.; Paukszto, L.; Okorska, S. The complete mitogenome of Mycosphaerella pinodes (Ascomycota, Mycosphaerellaceae). Mitochondrial DNA B Resour. 2016, 1, 48–49. [Google Scholar] [CrossRef] [Green Version]
  74. Li, H.; Handsaker, B.; Wysoker, A.; Fennell, T.; Ruan, J.; Homer, N.; Marth, G.; Abecasis, G.; Durbin, R.; Subgroup, G.P.D.P. The Sequence Alignment/Map format and SAMtools. Bioinformatics 2009, 25, 2078–2079. [Google Scholar] [CrossRef] [Green Version]
  75. Koren, S.; Walenz, B.P.; Berlin, K.; Miller, J.R.; Bergman, N.H.; Phillippy, A.M. Canu: Scalable and accurate long-read assembly via adaptive k-mer weighting and repeat separation. Genome Res. 2017, 27, 722–736. [Google Scholar] [CrossRef] [PubMed] [Green Version]
  76. Ruan, J.; Li, H. Fast and accurate long-read assembly with wtdbg2. Nat. Methods 2020, 17, 155–158. [Google Scholar] [CrossRef] [PubMed]
  77. Kolmogorov, M.; Yuan, J.; Lin, Y.; Pevzner, P.A. Assembly of Long Error-Prone Reads Using Repeat Graphs. bioRxiv 2018. [Google Scholar] [CrossRef] [PubMed]
  78. Vaser, R.; Sović, I.; Nagarajan, N.; Šikić, M. Fast and accurate de novo genome assembly from long uncorrected reads. Genome Res. 2017, 27, 737–746. [Google Scholar] [CrossRef] [PubMed] [Green Version]
  79. Walker, B.J.; Abeel, T.; Shea, T.; Priest, M.; Abouelliel, A.; Sakthikumar, S.; Cuomo, C.A.; Zeng, Q.; Wortman, J.; Young, S.K.; et al. Pilon: An Integrated Tool for Comprehensive Microbial Variant Detection and Genome Assembly Improvement. PLoS ONE 2014, 9, e112963. [Google Scholar] [CrossRef] [PubMed]
  80. Gurevich, A.; Saveliev, V.; Vyahhi, N.; Tesler, G. QUAST: Quality assessment tool for genome assemblies. Bioinformatics 2013, 29, 1072–1075. [Google Scholar] [CrossRef] [PubMed]
  81. Qin, M.; Wu, S.; Li, A.; Zhao, F.; Feng, H.; Ding, L.; Ruan, J. LRScaf: Improving draft genomes using long noisy reads. BMC Genom. 2019, 20, 955. [Google Scholar] [CrossRef] [Green Version]
  82. Bosi, E.; Donati, B.; Galardini, M.; Brunetti, S.; Sagot, M.F.; Lió, P.; Crescenzi, P.; Fani, R.; Fondi, M. MeDuSa: A multi-draft based scaffolder. Bioinformatics 2015, 31, 2443–2451. [Google Scholar] [CrossRef] [Green Version]
  83. Simão, F.A.; Waterhouse, R.M.; Ioannidis, P.; Kriventseva, E.V.; Zdobnov, E.M. BUSCO: Assessing genome assembly and annotation completeness with single-copy orthologs. Bioinformatics 2015, 31, 3210–3212. [Google Scholar] [CrossRef] [Green Version]
  84. Guan, D.; McCarthy, S.A.; Wood, J.; Howe, K.; Wang, Y.; Durbin, R. Identifying and removing haplotypic duplication in primary genome assemblies. Bioinformatics 2020, 36, 2896–2898. [Google Scholar] [CrossRef] [Green Version]
  85. Nishimura, D. RepeatMasker. Biotech Softw. Internet Rep. 2000, 1, 36–39. [Google Scholar] [CrossRef]
  86. Van Wyk, S.; Harrison, C.H.; Wingfield, B.D.; De Vos, L.; van Der Merwe, N.A.; Steenkamp, E.T. The RIPper, a web-based tool for genome-wide quantification of Repeat-Induced Point (RIP) mutations. PeerJ 2019, 7, e7447. [Google Scholar] [CrossRef] [Green Version]
  87. Camacho, C.; Coulouris, G.; Avagyan, V.; Ma, N.; Papadopoulos, J.; Bealer, K.; Madden, T.L. BLAST+: Architecture and applications. BMC Bioinform. 2009, 10, 421. [Google Scholar] [CrossRef] [Green Version]
  88. Kent, W.J. BLAT—The BLAST-like alignment tool. Genome Res. 2002, 12, 656–664. [Google Scholar]
  89. Haas, B.J.; Delcher, A.L.; Mount, S.M.; Wortman, J.R.; Smith, R.K., Jr.; Hannick, L.I.; Maiti, R.; Ronning, C.M.; Rusch, D.B.; Town, C.D. Improving the Arabidopsis genome annotation using maximal transcript alignment assemblies. Nucleic Acids Res. 2003, 31, 5654–5666. [Google Scholar] [CrossRef] [Green Version]
  90. Buchfink, B.; Xie, C.; Huson, D.H. Fast and sensitive protein alignment using DIAMOND. Nat. Methods 2015, 12, 59–60. [Google Scholar] [CrossRef]
  91. Stanke, M.; Morgenstern, B. AUGUSTUS: A web server for gene prediction in eukaryotes that allows user-defined constraints. Nucleic Acids Res. 2005, 33, W465–W467. [Google Scholar] [CrossRef] [Green Version]
  92. Lomsadze, A.; Ter-Hovhannisyan, V.; Chernoff, Y.O.; Borodovsky, M. Gene identification in novel eukaryotic genomes by self-training algorithm. Nucleic Acids Res. 2005, 33, 6494–6506. [Google Scholar] [CrossRef]
  93. Lagesen, K.; Hallin, P.; Rødland, E.A.; Stærfeldt, H.-H.; Rognes, T.; Ussery, D.W. RNAmmer: Consistent and rapid annotation of ribosomal RNA genes. Nucleic Acids Res. 2007, 35, 3100–3108. [Google Scholar] [CrossRef]
  94. Lowe, T.M.; Chan, P.P. tRNAscan-SE On-line: Integrating search and context for analysis of transfer RNA genes. Nucleic Acids Res. 2016, 44, W54–W57. [Google Scholar] [CrossRef]
  95. Jones, P.; Binns, D.; Chang, H.-Y.; Fraser, M.; Li, W.; McAnulla, C.; McWilliam, H.; Maslen, J.; Mitchell, A.; Nuka, G. InterProScan 5: Genome-scale protein function classification. Bioinformatics 2014, 30, 1236–1240. [Google Scholar] [CrossRef] [Green Version]
  96. Finn, R.D.; Coggill, P.; Eberhardt, R.Y.; Eddy, S.R.; Mistry, J.; Mitchell, A.L.; Potter, S.C.; Punta, M.; Qureshi, M.; Sangrador-Vegas, A. The Pfam protein families database: Towards a more sustainable future. Nucleic Acids Res. 2016, 44, D279–D285. [Google Scholar] [CrossRef]
  97. Petersen, T.N.; Brunak, S.; von Heijne, G.; Nielsen, H. SignalP 4.0: Discriminating signal peptides from transmembrane regions. Nat. Methods 2011, 8, 785–786. [Google Scholar] [CrossRef]
  98. Bernt, M.; Donath, A.; Jühling, F.; Externbrink, F.; Florentz, C.; Fritzsch, G.; Pütz, J.; Middendorf, M.; Stadler, P.F. MITOS: Improved de novo metazoan mitochondrial genome annotation. Mol. Phylogenet. Evol. 2013, 69, 313–319. [Google Scholar] [CrossRef]
  99. Kurtz, S.; Phillippy, A.; Delcher, A.L.; Smoot, M.; Shumway, M.; Antonescu, C.; Salzberg, S.L. Versatile and open software for comparing large genomes. Genome Biol. 2004, 5, R12. [Google Scholar] [CrossRef] [Green Version]
  100. Nattestad, M.; Schatz, M.C. Assemblytics: A web analytics tool for the detection of variants from an assembly. Bioinformatics 2016, 32, 3021–3023. [Google Scholar] [CrossRef] [Green Version]
  101. Krzywinski, M.; Schein, J.; Birol, I.; Connors, J.; Gascoyne, R.; Horsman, D.; Jones, S.J.; Marra, M.A. Circos: An information aesthetic for comparative genomics. Genome Res. 2009, 19, 1639–1645. [Google Scholar] [CrossRef] [Green Version]
  102. Wang, Y.; Coleman-Derr, D.; Chen, G.; Gu, Y.Q. OrthoVenn: A web server for genome wide comparison and annotation of orthologous clusters across multiple species. Nucleic Acids Res. 2015, 43, W78–W84. [Google Scholar] [CrossRef]
  103. Li, L.; Stoeckert, C.J.; Roos, D.S. OrthoMCL: Identification of ortholog groups for eukaryotic genomes. Genome Res. 2003, 13, 2178–2189. [Google Scholar] [CrossRef] [Green Version]
  104. Gardner, S.N.; Slezak, T.; Hall, B.G. kSNP3. 0: SNP detection and phylogenetic analysis of genomes without genome alignment or reference genome. Bioinformatics 2015, 31, 2877–2878. [Google Scholar] [CrossRef] [Green Version]
  105. Emms, D.; Kelly, S. OrthoFinder2: Fast and accurate phylogenomic orthology analysis from gene sequences. BioRxiv 2018. [Google Scholar] [CrossRef]
  106. Zhang, H.; Yohe, T.; Huang, L.; Entwistle, S.; Wu, P.; Yang, Z.; Busk, P.K.; Xu, Y.; Yin, Y. dbCAN2: A meta server for automated carbohydrate-active enzyme annotation. Nucleic Acids Res. 2018, 46, W95–W101. [Google Scholar] [CrossRef] [PubMed] [Green Version]
  107. Eddy, S.R. Hidden markov models. Curr. Opin. Struct. Biol. 1996, 6, 361–365. [Google Scholar] [CrossRef]
  108. Busk, P.K.; Pilgaard, B.; Lezyk, M.J.; Meyer, A.S.; Lange, L. Homology to peptide pattern for annotation of carbohydrate-active enzymes and prediction of function. BMC Bioinform. 2017, 18, 214. [Google Scholar] [CrossRef] [Green Version]
  109. Medema, M.H.; Blin, K.; Cimermancic, P.; De Jager, V.; Zakrzewski, P.; Fischbach, M.A.; Weber, T.; Takano, E.; Breitling, R. antiSMASH: Rapid identification, annotation and analysis of secondary metabolite biosynthesis gene clusters in bacterial and fungal genome sequences. Nucleic Acids Res. 2011, 39, W339–W346. [Google Scholar] [CrossRef]
  110. Blin, K.; Shaw, S.; Steinke, K.; Villebro, R.; Ziemert, N.; Lee, S.Y.; Medema, M.H.; Weber, T. antiSMASH 5.0: Updates to the secondary metabolite genome mining pipeline. Nucleic Acids Res. 2019, 47, W81–W87. [Google Scholar] [CrossRef] [Green Version]
  111. Seidl, M.F.; Thomma, B.P. Sex or no sex: Evolutionary adaptation occurs regardless. Bioessays 2014, 36, 335–345. [Google Scholar] [CrossRef] [Green Version]
  112. Walker, J.C.; Hare, W.W. Ascochyta Diseases of Canning Pea. Agricultural Experiment Station University of Wisconsin Research Bulletin. Available online: https://agris.fao.org/agris-search/search.do?recordID=US201300438150 (accessed on 11 January 2021).
  113. Mohanta, T.K.; Bae, H. The diversity of fungal genome. Biol. Proced. Online 2015, 17, 8. [Google Scholar] [CrossRef] [Green Version]
  114. Aylward, J.; Steenkamp, E.T.; Dreyer, L.L.; Roets, F.; Wingfield, B.D.; Wingfield, M.J. A plant pathology perspective of fungal genome sequencing. IMA Fungus 2017, 8, 1–15. [Google Scholar] [CrossRef] [Green Version]
  115. Castanera, R.; Lopez-Varas, L.; Borgognone, A.; LaButti, K.; Lapidus, A.; Schmutz, J.; Grimwood, J.; Perez, G.; Pisabarro, A.G.; Grigoriev, I.V. Transposable elements versus the fungal genome: Impact on whole-genome architecture and transcriptional profiles. PLoS Genet. 2016, 12, e1006108. [Google Scholar] [CrossRef] [Green Version]
  116. Shah, R.M.; Williams, A.H.; Hane, J.K.; Lawrence, J.A.; Farfan-Caceres, L.M.; Debler, J.W.; Oliver, R.P.; Lee, R.C. Reference Genome Assembly for Australian Ascochyta rabiei Isolate ArME14. G3 Genes Genomes Genet. 2020, 10, 2131–2140. [Google Scholar] [CrossRef]
  117. Lee, R.C.; Farfan-Caceres, L.; Debler, J.W.; Williams, A.H.; Syme, R.A.; Henares, B.M. Reference genome assembly for Australian Ascochyta lentis isolate Al4. G3 Genes Genomes Genet. 2021, 11, jkab006. [Google Scholar] [CrossRef]
  118. Grandaubert, J.; Balesdent, M.-H.; Rouxel, T. Evolutionary and adaptive role of transposable elements in fungal genomes. In Advances in Botanical Research; Elsevier: Amsterdam, The Netherlands, 2014; Volume 70, pp. 79–107. [Google Scholar]
  119. Ohm, R.A.; Feau, N.; Henrissat, B.; Schoch, C.L.; Horwitz, B.A.; Barry, K.W.; Condon, B.J.; Copeland, A.C.; Dhillon, B.; Glaser, F. Diverse lifestyles and strategies of plant pathogenesis encoded in the genomes of eighteen Dothideomycetes fungi. PLoS Pathog. 2012, 8, e1003037. [Google Scholar] [CrossRef] [Green Version]
  120. Möller, M.; Stukenbrock, E.H. Evolution and genome architecture in fungal plant pathogens. Nat. Rev. Microbiol. 2017, 15, 756–771. [Google Scholar] [CrossRef]
  121. Syme, R.A.; Martin, A.; Wyatt, N.A.; Lawrence, J.A.; Muria-Gonzalez, M.J.; Friesen, T.L.; Ellwood, S.R. Transposable element genomic fissuring in Pyrenophora teres is associated with genome expansion and dynamics of host-pathogen genetic interactions. Front. Genet. 2018, 9, 130. [Google Scholar] [CrossRef]
  122. Zolan, M.E. Chromosome-length polymorphism in fungi. Microbiol. Rev. 1995, 59, 686–698. [Google Scholar] [CrossRef]
  123. Akamatsu, H.O.; Chilvers, M.I.; Kaiser, W.J.; Peever, T.L. Karyotype polymorphism and chromosomal rearrangement in populations of the phytopathogenic fungus. Ascochyta Rabiei. Fungal Biol. 2012, 116, 1119–1133. [Google Scholar] [CrossRef]
  124. Sen, D.; Paul, K.; Saha, C.; Mukherjee, G.; Nag, M.; Ghosh, S.; Das, A.; Seal, A.; Tripathy, S. A unique life-strategy of an endophytic yeast Rhodotorula mucilaginosa JGTA-S1—A comparative genomics viewpoint. DNA Res. 2019, 26, 131–146. [Google Scholar] [CrossRef] [Green Version]
  125. Weiß, C.L.; Pais, M.; Cano, L.M.; Kamoun, S.; Burbano, H.A. nQuire: A statistical framework for ploidy estimation using next generation sequencing. BMC Bioinform. 2018, 19, 122. [Google Scholar] [CrossRef] [Green Version]
  126. Garber, R.C.; Gillian Turgeon, B.; Selker, E.U.; Yoder, O. Organization of ribosomal RNA genes in the fungus Cochliobolus heterostrophus. Curr. Genet. 1988, 14, 573–582. [Google Scholar] [CrossRef]
  127. Ma, L.; Chen, Z.; Huang, D.W.; Kutty, G.; Ishihara, M.; Wang, H.; Abouelleil, A.; Bishop, L.; Davey, E.; Deng, R.; et al. Genome analysis of three Pneumocystis species reveals adaptation mechanisms to life exclusively in mammalian hosts. Nat. Commun. 2016, 7, 10740. [Google Scholar] [CrossRef]
  128. Ma, L.-J.; Ibrahim, A.S.; Skory, C.; Grabherr, M.G.; Burger, G.; Butler, M.; Elias, M.; Idnurm, A.; Lang, B.F.; Sone, T.; et al. Genomic Analysis of the Basal Lineage Fungus Rhizopus oryzae Reveals a Whole-Genome Duplication. PLoS Genet. 2009, 5, e1000549. [Google Scholar] [CrossRef]
  129. Lofgren, L.A.; Uehling, J.K.; Branco, S.; Bruns, T.D.; Martin, F.; Kennedy, P.G. Genome-based estimates of fungal rDNA copy number variation across phylogenetic scales and ecological lifestyles. Mol. Ecol. 2019, 28, 721–730. [Google Scholar] [CrossRef]
  130. Smith, A.W.; Collis, K.; Ramsden, M.; Fox, H.M.; Peberdy, J.F. Chromosome rearrangements in improved cephalosporin C-producing strains of Acremonium chrysogenum. Curr. Genet. 1991, 19, 235–237. [Google Scholar] [CrossRef]
  131. Suzuki, T.; Miyamae, Y.; Ishida, I. Variation of colony morphology and chromosomal rearrangement in Candida tropicalis pK233. Microbiology 1991, 137, 161–167. [Google Scholar] [CrossRef] [Green Version]
  132. Olarte, R.A.; Menke, J.; Zhang, Y.; Sullivan, S.; Slot, J.C.; Huang, Y.; Badalamenti, J.P.; Quandt, A.C.; Spatafora, J.W.; Bushley, K.E. Chromosome rearrangements shape the diversification of secondary metabolism in the cyclosporin producing fungus Tolypocladium inflatum. BMC Genom. 2019, 20, 120. [Google Scholar] [CrossRef]
  133. Rajeh, A.; Lv, J.; Lin, Z. Heterogeneous rates of genome rearrangement contributed to the disparity of species richness in Ascomycota. BMC Genom. 2018, 19, 282. [Google Scholar] [CrossRef] [Green Version]
  134. Sipos, G.; Prasanna, A.N.; Walter, M.C.; O’Connor, E.; Bálint, B.; Krizsán, K.; Kiss, B.; Hess, J.; Varga, T.; Slot, J. Genome expansion and lineage-specific genetic innovations in the forest pathogenic fungi Armillaria. Nat. Ecol. Evol. 2017, 1, 1931–1941. [Google Scholar] [CrossRef] [Green Version]
  135. Daboussi, M.-J.; Capy, P. Transposable elements in filamentous fungi. Annu. Rev. Microbiol. 2003, 57, 275–299. [Google Scholar] [CrossRef]
  136. de la Chaux, N.; Wagner, A. BEL/Pao retrotransposons in metazoan genomes. BMC Evol. Biol. 2011, 11, 154. [Google Scholar] [CrossRef] [Green Version]
  137. Piednoël, M.; Carrete-Vega, G.; Renner, S.S. Characterization of the LTR retrotransposon repertoire of a plant clade of six diploid and one tetraploid species. Plant J. 2013, 75, 699–709. [Google Scholar] [CrossRef] [PubMed]
  138. Galagan, J.E.; Henn, M.R.; Ma, L.-J.; Cuomo, C.A.; Birren, B. Genomics of the fungal kingdom: Insights into eukaryotic biology. Genome Res. 2005, 15, 1620–1631. [Google Scholar] [CrossRef] [PubMed] [Green Version]
  139. Bouvet, G.F.; Jacobi, V.; Plourde, K.V.; Bernier, L. Stress-induced mobility of OPHIO1 and OPHIO2, DNA transposons of the Dutch elm disease fungi. Fungal Genet. Biol. 2008, 45, 565–578. [Google Scholar] [CrossRef] [PubMed]
  140. Spanu, P.D. The genomics of obligate (and nonobligate) biotrophs. Annu. Rev. Phytopathol. 2012, 50, 91–109. [Google Scholar] [CrossRef]
  141. Biémont, C. A brief history of the status of transposable elements: From junk DNA to major players in evolution. Genetics 2010, 186, 1085–1093. [Google Scholar] [CrossRef] [Green Version]
  142. Croll, D.; McDonald, B.A. The accessory genome as a cradle for adaptive evolution in pathogens. PLoS Pathog. 2012, 8, e1002608. [Google Scholar] [CrossRef] [Green Version]
  143. Selker, E.U. Repeat-induced gene silencing in fungi. Adv. Genet. 2002, 46, 439–450. [Google Scholar]
  144. Gladyshev, E. Repeat-induced point mutation and other genome defense mechanisms in fungi. In The Fungal Kingdom; ASM Press: Washington, DC, USA, 2017; pp. 687–699. Available online: https://onlinelibrary.wiley.com/doi/abs/10.1128/9781555819583.ch33 (accessed on 11 January 2021).
  145. Cambareri, E.B.; Jensen, B.C.; Schabtach, E.; Selker, E.U. Repeat-induced GC to AT mutations in Neurospora. Science 1989, 244, 1571–1575. [Google Scholar] [CrossRef]
  146. Braumann, I.; Van Den Berg, M.; Kempken, F. Repeat induced point mutation in two asexual fungi, Aspergillus niger and Penicillium chrysogenum. Curr. Genet. 2008, 53, 287–297. [Google Scholar] [CrossRef]
  147. Van Wyk, S.; Wingfield, B.D.; De Vos, L.; Van der Merwe, N.A.; Steenkamp, E.T. Genome-wide analyses of repeat-induced point mutations in the Ascomycota. Front. Microbiol. 2021, 11, 3625. [Google Scholar] [CrossRef]
  148. Leslie, J.; Summerell, B. The Fusarium Laboratory Manual; Leslie, J.F., Summerell., B.A., Eds.; Blackwell: Hoboken, NJ, USA, 2006; pp. 1–388. [Google Scholar]
  149. Xu, C.; Zhang, R.; Sun, G.; Gleason, M.L. Comparative Genome Analysis Reveals Adaptation to the Ectophytic Lifestyle of Sooty Blotch and Flyspeck Fungi. Genome Biol. Evol. 2017, 9, 3137–3151. [Google Scholar] [CrossRef] [Green Version]
  150. Tran, H.S.; You, M.P.; Khan, T.N.; Barbetti, M.J. Relative Host Resistance to Black Spot Disease in Field Pea (Pisum sativum) is Determined by Individual Pathogens. Plant Dis. 2015, 99, 580–587. [Google Scholar] [CrossRef] [Green Version]
  151. Badet, T.; Oggenfuss, U.; Abraham, L.; McDonald, B.A.; Croll, D. A 19-isolate reference-quality global pangenome for the fungal wheat pathogen Zymoseptoria tritici. BMC Biol. 2020, 18, 12. [Google Scholar] [CrossRef] [Green Version]
  152. Baumann, G. Untersuchungen zur Biologie van Mycosphaerella pinodes (Berk. et. Blox.) Stone. Kühn-Archiv 1953, 67, 305–383. [Google Scholar]
  153. Bowen, J.K.; Lewis, B.G.; Matthews, P. Discovery of the teleomorph of Phoma medicaginis var. pinodella in culture. Mycol. Res. 1997, 101, 80–84. [Google Scholar] [CrossRef]
  154. Woudenberg, J.H.; De Gruyter, J.; Crous, P.W.; ZWIERS, L.H. Analysis of the mating-type loci of co-occurring and phylogenetically related species of Ascochyta and Phoma. Mol. Plant Pathol. 2012, 13, 350–362. [Google Scholar] [CrossRef] [PubMed]
  155. Yun, S.-H.; Arie, T.; Kaneko, I.; Yoder, O.; Turgeon, B.G. Molecular organization of mating type loci in heterothallic, homothallic, and asexual Gibberella/Fusarium species. Fungal Genet. Biol. 2000, 31, 7–20. [Google Scholar] [CrossRef]
  156. Debuchy, R.; Turgeon, B. Mating-type structure, evolution, and function in Euascomycetes. In Growth, Differentiation and Sexuality; Springer: Berlin/Heidelberg, Germany, 2006; pp. 293–323. [Google Scholar]
  157. Trapero-Casas, A.; Kaiser, W. Development of Didymella rabiei, the teleomorph of Ascochyta rabiei, on chickpea straw. Phytopathology 1992, 82, 1261–1266. [Google Scholar] [CrossRef]
  158. Wilson, A.D.; Kaiser, W. Cytology and genetics of sexual incompatibility in Didymella rabiei. Mycologia 1995, 87, 795–804. [Google Scholar] [CrossRef]
  159. Barve, M.; Arie, T.; Salimath, S.; Muehlbauer, F.; Peever, T. Cloning and characterization of the mating type (MAT) locus from Ascochyta rabiei (teleomorph: Didymella rabiei) and a MAT phylogeny of legume-associated Ascochyta spp. Fungal Genet. Biol. 2003, 39, 151–167. [Google Scholar] [CrossRef]
  160. Friedman, R.; Hughes, A.L. The temporal distribution of gene duplication events in a set of highly conserved human gene families. Mol. Biol. Evol. 2003, 20, 154–161. [Google Scholar] [CrossRef] [PubMed] [Green Version]
  161. Hughes, A.L. The evolution of functionally novel proteins after gene duplication. Proc. R. Soc. Lond. Ser. B Biol. Sci. 1994, 256, 119–124. [Google Scholar]
  162. Ohno, S. The enormous diversity in genome sizes of fish as a reflection of nature’s extensive experiments with gene duplication. Trans. Am. Fish. Soc. 1970, 99, 120–130. [Google Scholar] [CrossRef]
  163. Lynch, M.; Conery, J.S. The evolutionary fate and consequences of duplicate genes. Science 2000, 290, 1151–1155. [Google Scholar] [CrossRef] [PubMed] [Green Version]
  164. Zhao, Z.; Liu, H.; Wang, C.; Xu, J.-R. Correction: Comparative analysis of fungal genomes reveals different plant cell wall degrading capacity in fungi. BMC Genom. 2014, 15, 6. [Google Scholar] [CrossRef] [Green Version]
  165. Kaur, J. Chemistry and biological activity of lignin from pea (Pisum sativum L.) peel. Chemistry 2017, 102824589. Available online: https://www.semanticscholar.org/paper/Chemistry-and-biological-activity-of-lignin-from-Kaur/c7a341e64ef3fbafa9a8deaf2995a55e86a93116 (accessed on 11 January 2021).
  166. Talbott, L.D.; Ray, P.M. Molecular size and separability features of pea cell wall polysaccharides: Implications for models of primary wall structure. Plant Physiol. 1992, 98, 357–368. [Google Scholar] [CrossRef] [Green Version]
  167. Keirnan, E.C.; Davidson, J.A.; Correll, R.L.; Scott, E.S. Host range investigation of Phoma koolunga, a causal agent of ascochyta blight of field pea. Australas. Plant Pathol. 2020, 49, 707–719. [Google Scholar] [CrossRef]
  168. Le May, C.; Guibert, M.; Baranger, A.; Tivoli, B. A wide range of cultivated legume species act as alternative hosts for the pea aschochyta blight fungus, D idymella pinodes. Plant Pathol. 2014, 63, 877–887. [Google Scholar] [CrossRef]
  169. Barilli, E.; Cobos, M.J.; Rubiales, D. Clarification on Host Range of Didymella pinodes the Causal Agent of Pea Ascochyta Blight. Front. Plant Sci. 2016, 7, 592. [Google Scholar] [CrossRef]
  170. Kinsey, G. IMI Descriptions of Fungi and Bacteria. Biology 2002, 151, 88439022. [Google Scholar]
  171. García-Pajón, C.; Collado, I.G. Secondary metabolites isolated from Colletotrichum species. Nat. Prod. Rep. 2003, 20, 426–431. [Google Scholar] [CrossRef]
  172. Rao, S.; Nandineni, M.R. Genome sequencing and comparative genomics reveal a repertoire of putative pathogenicity genes in chilli anthracnose fungus Colletotrichum truncatum. PLoS ONE 2017, 12, e0183567. [Google Scholar] [CrossRef] [Green Version]
  173. Takano, K.; Tatlisumak, T.; Bergmann, A.G.; Gibson, D.G., III; Fisher, M. Reproducibility and reliability of middle cerebral artery occlusion using a silicone-coated suture (Koizumi) in rats. J. Neurol. Sci. 1997, 153, 8–11. [Google Scholar] [CrossRef]
  174. Islam, M.S.; Haque, M.S.; Islam, M.M.; Emdad, E.M.; Halim, A.; Hossen, Q.M.M.; Hossain, M.Z.; Ahmed, B.; Rahim, S.; Rahman, M.S. Tools to kill: Genome of one of the most destructive plant pathogenic fungi Macrophomina phaseolina. BMC Genom. 2012, 13, 493. [Google Scholar] [CrossRef] [Green Version]
  175. De Wit, P.J.; Van Der Burgt, A.; Ökmen, B.; Stergiopoulos, I.; Abd-Elsalam, K.A.; Aerts, A.L.; Bahkali, A.H.; Beenen, H.G.; Chettri, P.; Cox, M.P. The genomes of the fungal plant pathogens Cladosporium fulvum and Dothistroma septosporum reveal adaptation to different hosts and lifestyles but also signatures of common ancestry. PLoS Genet. 2012, 8, e1003088. [Google Scholar] [CrossRef]
  176. Pusztahelyi, T.; Holb, I.J.; Pócsi, I. Secondary metabolites in fungus-plant interactions. Front. Plant Sci. 2015, 6, 573. [Google Scholar] [CrossRef] [Green Version]
  177. Ding, W.; Liu, W.-Q.; Jia, Y.; Li, Y.; Van Der Donk, W.A.; Zhang, Q. Biosynthetic investigation of phomopsins reveals a widespread pathway for ribosomal natural products in Ascomycetes. Proc. Natl. Acad. Sci. USA 2016, 113, 3521–3526. [Google Scholar] [CrossRef] [Green Version]
  178. Duquesne, S.; Destoumieux-Garzón, D.; Peduzzi, J.; Rebuffat, S. Microcins, gene-encoded antibacterial peptides from enterobacteria. Nat. Prod. Rep. 2007, 24, 708–734. [Google Scholar] [CrossRef]
  179. Drider, D.; Rebuffat, S. Prokaryotic Antimicrobial Peptides: From Genes to Applications; Springer: Berlin/Heidelberg, Germany, 2011. [Google Scholar]
  180. Li, Y.; Rebuffat, S. The manifold roles of microbial ribosomal peptide-based natural products in physiology and ecology. J. Biol. Chem. 2020, 295, 34–54. [Google Scholar] [CrossRef] [Green Version]
  181. Kessler, S.C.; Chooi, Y.-H. Out for a RiPP: Challenges and advances in genome mining of ribosomal peptides from fungi. Natural Product Reports 2022, 39, 222–230. [Google Scholar] [CrossRef] [PubMed]
  182. Robinson, S.L.; Christenson, J.K.; Wackett, L.P. Biosynthesis and chemical diversity of β-lactone natural products. Nat. Prod. Rep. 2019, 36, 458–475. [Google Scholar] [CrossRef] [PubMed]
  183. Keller, N.P. Fungal secondary metabolism: Regulation, function and drug discovery. Nat. Rev. Microbiol. 2019, 17, 167–180. [Google Scholar] [CrossRef] [PubMed]
  184. Strobel, G.; Singh, S.K.; Riyaz-Ul-Hassan, S.; Mitchell, A.M.; Geary, B.; Sears, J. An endophytic/pathogenic Phoma sp. from creosote bush producing biologically active volatile compounds having fuel potential. FEMS Microbiol. Lett. 2011, 320, 87–94. [Google Scholar] [CrossRef] [PubMed] [Green Version]
  185. Le May, C.; Ney, B.; Lemarchand, E.; Schoeny, A.; Tivoli, B. Effect of pea plant architecture on spatiotemporal epidemic development of ascochyta blight (Mycosphaerella pinodes) in the field. Plant Pathol. 2009, 58, 332–343. [Google Scholar] [CrossRef]
  186. Song, N.; Geng, Y.; Li, X. The mitochondrial genome of the phytopathogenic fungus Bipolaris sorokiniana and the utility of mitochondrial genome to infer phylogeny of Dothideomycetes. Front. Microbiol. 2020, 11, 863. [Google Scholar] [CrossRef]
  187. Yuan, X.-L.; Cao, M.; Shen, G.-M.; Zhang, H.-B.; Du, Y.-M.; Zhang, Z.-F.; Li, Q.; Gao, J.-M.; Xue, L.; Wang, Z.-P. Characterization of Nuclear and Mitochondrial Genomes of Two Tobacco Endophytic Fungi Leptosphaerulina chartarum and Curvularia trifolii and Their Contributions to Phylogenetic Implications in the Pleosporales. Int. J. Mol. Sci. 2020, 21, 2461. [Google Scholar] [CrossRef] [Green Version]
  188. Joardar, V.; Abrams, N.F.; Hostetler, J.; Paukstelis, P.J.; Pakala, S.; Pakala, S.B.; Zafar, N.; Abolude, O.O.; Payne, G.; Andrianopoulos, A. Sequencing of mitochondrial genomes of nine Aspergillus and Penicillium species identifies mobile introns and accessory genes as main sources of genome size variability. BMC Genom. 2012, 13, 698. [Google Scholar] [CrossRef]
  189. Sandor, S.; Zhang, Y.; Xu, J. Fungal mitochondrial genomes and genetic polymorphisms. Appl. Microbiol. Biotechnol. 2018, 102, 9433–9448. [Google Scholar] [CrossRef]
  190. Megarioti, A.H.; Kouvelis, V.N. The coevolution of fungal mitochondrial introns and their homing endonucleases (GIY-YIG and LAGLIDADG). Genome Biol. Evol. 2020, 12, 1337–1354. [Google Scholar] [CrossRef]
  191. Nie, Y.; Wang, L.; Cai, Y.; Tao, W.; Zhang, Y.-J.; Huang, B. Mitochondrial genome of the entomophthoroid fungus Conidiobolus heterosporus provides insights into evolution of basal fungi. Appl. Microbiol. Biotechnol. 2019, 103, 1379–1391. [Google Scholar] [CrossRef]
  192. Cummings, D.J.; McNally, K.L.; Domenico, J.M.; Matsuura, E.T. The complete DNA sequence of the mitochondrial genome of Podospora anserina. Curr. Genet. 1990, 17, 375–402. [Google Scholar] [CrossRef]
  193. Foury, F.; Roganti, T.; Lecrenier, N.; Purnelle, B. The complete sequence of the mitochondrial genome of Saccharomyces cerevisiae. FEBS Lett. 1998, 440, 325–331. [Google Scholar] [CrossRef] [Green Version]
  194. Field, D.J.; Sommerfield, A.; Saville, B.J.; Collins, R.A. A group II intron in the Neurospora mitochondrial col gene: Nucleotide sequence and implications for splicing and molecular evolution. Nucleic Acids Res. 1989, 17, 9087–9099. [Google Scholar] [CrossRef]
  195. Nadimi, M.; Beaudet, D.; Forget, L.; Hijri, M.; Lang, B.F. Group I intron–mediated trans-splicing in mitochondria of gigaspora rosea and a robust phylogenetic affiliation of arbuscular mycorrhizal fungi with mortierellales. Mol. Biol. Evol. 2012, 29, 2199–2210. [Google Scholar] [CrossRef] [Green Version]
  196. Burger, G.; Yan, Y.; Javadi, P.; Lang, B.F. Group I-intron trans-splicing and mRNA editing in the mitochondria of placozoan animals. Trends Genet. 2009, 25, 381–386. [Google Scholar] [CrossRef]
  197. Grewe, F.; Viehoever, P.; Weisshaar, B.; Knoop, V. A trans-splicing group I intron and tRNA-hyperediting in the mitochondrial genome of the lycophyte Isoetes engelmannii. Nucleic Acids Res. 2009, 37, 5093–5104. [Google Scholar] [CrossRef] [Green Version]
  198. Pombert, J.-F.; Keeling, P.J. The mitochondrial genome of the entomoparasitic green alga Helicosporidium. PLoS ONE 2010, 5, e8954. [Google Scholar] [CrossRef]
  199. Hecht, J.; Grewe, F.; Knoop, V. Extreme RNA editing in coding islands and abundant microsatellites in repeat sequences of Selaginella moellendorffii mitochondria: The root of frequent plant mtDNA recombination in early tracheophytes. Genome Biol. Evol. 2011, 3, 344–358. [Google Scholar] [CrossRef] [Green Version]
  200. Pelin, A.; Pombert, J.F.; Salvioli, A.; Bonen, L.; Bonfante, P.; Corradi, N. The mitochondrial genome of the arbuscular mycorrhizal fungus Gigaspora margarita reveals two unsuspected trans-splicing events of group I introns. New Phytol. 2012, 194, 836–845. [Google Scholar] [CrossRef]
  201. Pombert, J.-F.; Otis, C.; Turmel, M.; Lemieux, C. The mitochondrial genome of the prasinophyte Prasinoderma coloniale reveals two trans-spliced group I introns in the large subunit rRNA gene. PLoS ONE 2013, 8, e84325. [Google Scholar] [CrossRef] [PubMed]
  202. Kamikawa, R.; Shiratori, T.; Ishida, K.-I.; Miyashita, H.; Roger, A.J. Group II intron-mediated trans-splicing in the gene-rich mitochondrial genome of an enigmatic eukaryote, Diphylleia rotans. Genome Biol. Evol. 2016, 8, 458–466. [Google Scholar] [CrossRef] [PubMed] [Green Version]
  203. Fonseca, P.L.; De-Paula, R.B.; Araújo, D.S.; Tomé, L.M.R.; Mendes-Pereira, T.; Rodrigues, W.F.C.; Del-Bem, L.-E.; Aguiar, E.R.; Góes-Neto, A. Global characterization of fungal mitogenomes: New insights on genomic diversity and dynamism of coding genes and accessory elements. Front. Microbiol. 2021, 12, 787283. [Google Scholar] [CrossRef] [PubMed]
  204. Beaudet, D.; Nadimi, M.; Iffis, B.; Hijri, M. Rapid mitochondrial genome evolution through invasion of mobile elements in two closely related species of arbuscular mycorrhizal fungi. PLoS ONE 2013, 8, e60768. [Google Scholar] [CrossRef] [PubMed] [Green Version]
  205. Handa, H. Linear plasmids in plant mitochondria: Peaceful coexistences or malicious invasions? Mitochondrion 2008, 8, 15–25. [Google Scholar] [CrossRef] [PubMed]
Figure 1. Assembly and annotation pipelines for nuclear, mitochondrial, and RNAseq data.
Jof 08 00884 g001
Figure 2. Structural variant (SV) analysis and Circos plots of AB species’ nuclear genomes between reference Isolate3Pp (P. pinodes), Isolate18Ppll (P. pinodella) and Isolate2Pk (P. koolunga). (a) SV analysis showing the higher occurrence of indels compared to repeats between the species and syntenic homology of P. pinodes (16 scaffolds, red) and P. pinodella (16 scaffolds, blue). (b) A comparison of P. pinodella (16 scaffolds, blue) and P. koolunga (29 scaffolds, black) reveals that repeat expansion and contraction are the most prevalent SV. Less homology is observed in (b) compared to (a). (c) Similarly to (b), a comparison of P. pinodes (16 scaffolds, red) and P. koolunga (29 scaffolds, black) shows that the most prevalent SV is repeat expansion and contraction, and there is less homology between the species compared to (a).
Jof 08 00884 g002
Figure 3. Repeat analysis. (a) GC content variation among AB species, with the top five TE expressed as a pie chart for each AB species. (b) Total RIP-affected regions per genome assembly for the AB species using the reference isolates for comparison.
Jof 08 00884 g003
Figure 4. Pangenome analysis of the cDNA sequence (CDS) annotation for AB species. Core and pan-genome growth simulation plots for the AB species. Isolate CDS data were added in a random order by adding up six permutation experiments per species. P. koolunga (Panel (a,b)), P. pinodella (Panel (c,d)), and P. pinodes (Panel (e,f)).
Jof 08 00884 g004
Figure 5. Venn diagrams of AB inter and intra-species orthology showing shared gene families (gene clusters). Venn diagrams and summary tables showing orthologs for the reference isolates P. pinodes, P. pinodella, and P. koolunga. (a) Orthologous gene clusters among P. pinodes species. (b) Orthologous gene clusters among P. pinodella species. (c) Orthologous gene clusters among P. koolunga species. (d) Orthologous gene clusters between the three AB species using the reference isolates Isolate2Pk, Isolate3Pp, and Isolate18Ppll.
Jof 08 00884 g005
Figure 6. AB CAZyme analysis. (a) CAZyme analysis profile of Ascomycota species; (b) AB Plant-cell-wall-degrading CAZyme analysis (GH- glycoside hydrolases, GT- glycosyl transferases, PLs- polysaccharide lyases, CEs- carbohydrate esterases, AAs- auxiliary activities and CBMs- carbohydrate-binding modules).
Jof 08 00884 g006aJof 08 00884 g006b
Figure 7. Graphical representation of the AB reference isolate mitochondrial genomes using OGDRAW from the CHLOROBOX web server. (a) P. koolunga, Isolate2Pk; (b) P. pinodella, Isolate18Ppll; and (c) P. pinodes, Isolate3Pp. (d) Mitochondrial gene order synteny among AB species.
Jof 08 00884 g007
Table 1. Genome assembly statistics of AB isolates. Isolates with double asterisks have illumina reads retrieved from NCBI; as such, hybrid assembly was carried out for them.
IsolatesNo. of Contigs/SCAFFOLDLargest Contig/Scaffold (Mb)Total Length (Mb)Scaffold N50GC (%)BUSCO (%)
Isolate1Pk **347.255.93.844.899.2
Isolate2Pk **297.856.54.144.899.6
Isolate22Pk2702.558.71.044.696.5
Isolate32Pk813.057.51.644.595.6
Isolate36Pk278.056.14.344. 897.6
Isolate42Pk408.055.33.444.797.5
Isolate18Ppll166.037.22.650.996.4
Isolate27Ppll264.335.22.451.696.4
Isolate58Ppll483.737.92.250.797.0
Isolate72Ppll127.734.73.451.793.9
Isolate104Ppll424.537.52.051.696.0
Isolate113Ppll453.037.61.751.596.6
Isolate3Pp **166.334.63.752.699.1
Isolate4Pp **203.234.62.052.699.0
Isolate5Pp **184.036.72.752.498.5
Isolate87Pp146.234.53.852.596.6
Isolate88Pp196.234.53.652.695.8
Isolate97Pp234.235.52.452.695.5
** indicates isolates that have illumina reads and assembly was hybrid.
Table 2. Genome annotation—statistics on the number of genes identified and the BUSCO %.
AugustusBrakerGeneMarkESRNAmmertRNAscan-SE
Isolates/SpeciesGeneBUSCO (%)GeneBUSCO (%)GeneBUSCO (%)Total rRNAtRNA
Isolate1Pk16,12766.210,02498.910,19897.753141
Isolate2Pk14,08573.1985198.610,31998.4107139
Isolate22Pk15,57160.510,16584.510,28489.475144
Isolate32Pk15,54854.4979983.9988489.987137
Isolate36Pk12,73769.7991489.110,00992.183142
Isolate42Pk938887.210,45486.6971789.887128
Isolate18Ppll12,58289.813,11790.712,95491.859150
Isolate27Ppll11,09090.213,01485.911,50392.547137
Isolate58Ppll14,90670.810,89788.511,51892.4133135
Isolate72Ppll14,15663.110,74680.511,05688.376135
Isolate104Ppll11,85488.014,40691.712,24990.940144
Isolate113Ppll11,59488.612,21791.411,98891.458135
Isolate3Pp16,56271.410,74297.811,41798.0104129
Isolate4Pp11,01997.210,89897.811,09694.655130
Isolate5Pp17,97071.810,96496.211,79796.958129
Isolate87Pp16,69365.210,87287.310,95390.172129
Isolate88Pp16,85066.710,56988.910,98790.698129
Isolate97Pp11,13787.712,27685.211,56291.254132
Table 3. Read count of the expressed TE in AB species.
TEP. koolungaP. pinodesP. pinodella
I non-LTR721226,40162,440
Mariner32619,1311092
MOLLY16447003552
Gypsy492954410
Copia89321177
MarCry18101105
Tad1501610
PYGGY2115
LMR17715
AFUT13700
REALAA1102
MGR583677
MAGGY180
CFT1080
TFO1020
POT2002
FoHeli3000
Total806253,36168,806
Table 4. Interspecies orthologous statistics showing, the total number of clusters observed across the AB species, orthogroup clusters present in at least two species, and single-copy orthogroup (SCG) clusters in AB species.
SpeciesClustersOrthologous ClustersSCG Clusters
P. pinodella11,78235438239
P. pinodes11,65324389215
P. koolunga10,30518858420
Table 5. Annotation for unique clusters.
SpeciesAnnotationProtein Name
P. pinodesGO:0005525F:GTP binding
GO:0016705F:oxidoreductase activity, acting on paired donors, with incorporation or reduction of molecular oxygen
GO:0004847F:urea carboxylase activity
Q9UV10Heterokaryon incompatibility protein 6, OR allele
P. pinodellaGO:0016125P:sterol metabolic process
GO:0016114P:terpenoid biosynthetic process
GO:0055114P:oxidation-reduction process
GO:0005525F:GTP binding
GO:0006520P:cellular amino acid metabolic process
GO:0008643P:carbohydrate transport
GO:0140041P:cellular detoxification of methylglyoxal
P. koolungaGO:0009405P:pathogenesis
GO:0006364P:rRNA processing
GO:0016746F:transferase activity, transferring acyl groups
GO:0010124P:phenylacetate catabolic process
GO:0034517P:ribophagy
GO:0006487P:protein N-linked glycosylation
GO:0006810P:transport
GO:0004022F:alcohol dehydrogenase (NAD) activity
Table 6. Mitochondrial genome assembly statistics for AB isolates.
IsolatesSpeciesTotal Length (bp)GC Content (%)
Isolate1Pk P. koolunga73,51128.9
Isolate2PkP. koolunga68,28228.7
Isolate22PkP. koolunga68,00328.9
Isolate32PkP. koolunga67,92428.9
Isolate36PkP. koolunga67,82828.9
Isolate42PkP. koolunga65,62228.8
Isolate18PpllP. pinodella48,42928.8
Isolate27PpllP. pinodella50,45729.4
Isolate58PpllP. pinodella49,50729.5
Isolate72PpllP. pinodella50,40529.1
Isolate104PpllP. pinodella50,00929.5
Isolate113PpllP. pinodella50,37429.5
Isolate3PpP. pinodes55,21329.1
Isolate4PpP. pinodes56,22929.2
Isolate5PpP. pinodes56,33029.2
Isolate87PpP. pinodes55,99029.4
Isolate88PpP. pinodes55,56729.3
Isolate97PpP. pinodes55,93129.4
Publisher’s Note: MDPI stays neutral with regard to jurisdictional claims in published maps and institutional affiliations.

