Variations in Values of State, Response Entropy and Haemodynamic Parameters Associated with Development of Different Epileptiform Patterns during Volatile Induction of General Anaesthesia with Two Different Anaesthetic Regimens Using Sevoflurane in Comparison with Intravenous Induct: A Comparative Study

 , , , and
Abstract
:1. Introduction
2. Materials and Methods
2.1. Induction of Anaesthesia
2.2. Electroencephalography and Entropy Analysis
2.3. Statistical Analyses
3. Results
4. Discussion
5. Conclusions
Author Contributions
Funding
Acknowledgments
Conflicts of Interest
Appendix A

| Induction | VIMA-EP N = 10 X ± SD M (IQR) | VCRII-EP N = 7 X ± SD M (IQR) | VIMA-nEP N = 6 X ± SD M (IQR) | VCRII-nEP N = 9 X ± SD M (IQR) | p-Value a | |
|---|---|---|---|---|---|---|
| Level | Parameters | |||||
| STAGE 1 | HR START (beats/min) | 79.3±9.4 83 (13) | 81.1 ± 17.3 73 (31) | 66.2 ± 12.8 62 (19) | 81.6 ± 17.5 82 (5) | p = 0.18 NS |
| SAP START (mmHg) | 151.1 ± 26 156.8 (34.3) | 138.1 ± 11.7 134.3 (24.2) | 143.2 ± 9.9 141 (8.8) | 150.8 ± 36.1 143.4 (40.5) | p = 0.53 NS | |
| DAP START (mmHg) | 89.2 ± 15.1 95.7 (19) | 70.5 ± 10.2 72.1 (18.3) | 82.4 ± 3.3 82.3 (3.2) | 85.6 ± 18.1 85.5 (26) | p = 0.06 NS | |
| MAP START (mmHg) | 113.7 ± 17.5 118.3 (18.2) | 97.3 ± 9.1 98.3 (6.7) | 104.9 ± 5.4 105.4 (3.8) | 109.6 ± 24.1 104.6 (27.6) | p = 0.12 NS | |
| fEMG START | 7 ± 4.7 6 (6.4) | 13.5 ± 11.6 11.2 (20.7) | 7.3 ± 6.6 6.3 (7.5) | 7.5 ± 4.8 5.8 (4.4) | p = 0.79 NS | |
| STAGE 2 | FeAA DURING LOC | 4.4 ± 1.4 4.7 (1.9) | 3.8 ± 1.1 3.8 (2.3) | 4.3 ± 1.5 4.8 (2.7) | 4.8 ± 1.5 4.5 (2.1) | p = 0.53 NS |
| FiAA DURING LOC | 6.2 ± 1.7 6.6 (1.3) | 6.9 ± 1.1 6.8 (1.6) | 6.4 ± 1 6.6 (1.8) | 7.5 ± 0.4 7.6 (0.2) | p = 0.12 NS | |
| MAC DURING LOC | 2.1 ± 0.7 2.3 (0.9) | 1.8 ± 0.5 1.8 (1.1) | 2.1 ± 0.7 2.3 (1.3) | 2.3 ± 0.7 2.2 (1) | p = 0.54 NS | |
| HR DURING LOC (beats/min) | 84.9 ± 21.4 78.5 (34) | 88 ± 17.2 81 (28) | 77.3 ± 24 72 (25) | 92.6 ± 22 96 (14) | p = 0.59 NS | |
| SAP DURING LOC (mmHg) | 158.7 ± 34 155.1 (32.7) | 138.9 ± 11 137.5 (22.3) | 150.4 ± 22.1 150.4 (23.1) | 149.9 ± 37.5 156 (41.4) | p = 0.61 NS | |
| DAP DURING LOC (mmHg) | 86 ± 16.6 88.5 (21.2) | 72.3 ± 9.7 74.7 (8.4) | 86.9 ± 3.8 88 (2.7) | 83.4 ± 17.4 81.5 (26.3) | p = 0.12 NS | |
| MAP DURING LOC (mmHg) | 113.4 ± 19.1 114.8 (17) | 95.6 ± 17.3 100.1 (9.9) | 112 ± 10.9 112.6 (9.9) | 107.6 ± 21.5 101.4 (27.4) | p = 0.20 NS | |
| fEMG DURING LOC | 1.8 ± 1.5 1.2 (1.4) | 15.4 ± 36.6 1.4 (2.4) | 1.6 ± 1.4 1 (1.4) | 1.3 ± 1 1.3 (1.3) | p = 0.62 NS | |
| STAGE 3 | FeAA BEFORE EP (%) | 5.1 ± 0.9 5.2 (1) | 4.9 ± 1.4 4.3 (2.2) | 5 ± 0.4 5 (0.3) | 4.8 ± 0.9 5 (1.2) | p = 0.92 NS |
| FiAA BEFORE EP (%) | 6.6 ± 0.8 6.7 (1.4) | 6.4 ± 0.9 5.8 (1.6) | 6.5 ± 0.9 6.4 (1.2) | 7.1 ± 0.8 7.3 (0.9) | p = 0.45 NS | |
| MAC BEFORE EP | 2.5 ± 0.4 2.5 (0.5) | 2.4 ± 0.7 2.1 (1.1) | 2.4 ± 0.2 2.5 (0.1) | 2.3 ± 0.4 2.4 (0.6) | p = 0.92 NS | |
| HR BEFORE EP (beats/min) | 80.4 ± 17 82.5 (23) | 91.1 ± 20.2 85 (33) | 79.7 ± 19.8 77 (14) | 87.9 ± 16.9 92 (19) | p = 0.55 NS | |
| SAP BEFORE EP (mmHg) | 137.2 ± 20.5 143.3 (24.7) | 138.9 ± 11 137.5 (22.3) | 140.7 ± 26.9 142.5 (41.7) | 147.3 ± 40 138.1 (41.2) | p = 0.98 NS | |
| DAP BEFORE EP (mmHg) | 78.4 ± 16.8 78.4 (27) | 72.8 ± 8.5 74.7 (8.4) | 82.3 ± 11.7 87.3 (8.9) | 81.2 ± 16.6 79.4 (23.8) | p = 0.47 NS | |
| MAP BEFORE EP (mmHg) | 102.8 ± 16.8 104 (21.5) | 101.2 ± 6.6 100.1 (8.2) | 105.3 ± 17.4 108.5 (21) | 105.6 ± 22.9 97.1 (24.2) | p = 0.95 NS | |
| fEMG BEFORE EP | 1.2 ± 2.1 0.3 (1.2) | 0.8 ± 0.6 0.8 (0.8) | 0.8 ± 0.5 0.9 (0.3) | 0.9 ± 1.2 0.4 (0.7) | p = 0.82 NS | |
| STAGE 4 | FeAA ONSET OF EP (%) | 4.6 ± 0.7 4.7 (0.9) | 4.5 ± 0.9 4.4 (1) | 5.7 ± 1.2 5.2 (2.3) | 5 ± 1 4.9 (1) | p = 0.14 NS |
| FiAA ONSET OF EP (%) | 6.1 ± 0.9 6.2 (1.5) | 6.8 ± 0.9 6.7 (1.9) | 6 ± 1.5 6.3 (2.2) | 6.8 ± 0.5 6.9 (0.3) | p = 0.30 NS | |
| MAC ONSET OF EP | 2.3 ± 0.3 2.4 (0.5) | 2.2 ± 0.5 2.2 (0.5) | 2.7 ± 0.7 2.5 (1.3) | 2.4 ± 0.5 2.4 (0.5) | p = 0.43 NS | |
| HR ONSET OF EP (beats/min) | 81.9 ± 23 79 (24) | 101 ± 32.2 94 (59) | 78.5 ± 15.6 79 (9) | 79.2 ± 18.8 83 (22) | p = 0.23 NS | |
| SAP ONSET OF EP (mmHg) | 135.9 ± 26.1 126.2 (33.2) | 122.9 ± 25.7 129.6 (30.7) | 129.5 ± 14.2 128.7 (19.1) | 130.7 ± 27.8 119.9 (34.9) | p = 0.94 NS | |
| DAP ONSET OF EP (mmHg) | 80.2 ± 16.4 81.1 (19.7) | 63.1 ± 13.4 70.2 (25) | 80.7 ± 11.7 85.4 (13.9) | 79.7 ± 17.4 77.8 (12.7) | p = 0.11 NS | |
| MAP ONSET OF EP (mmHg) | 101.1 ± 20.4 98.3 (20.7) | 89.4 ± 18.4 98.3 (24.9) | 97.1 ± 10.8 99.7 (5.6) | 98.4 ± 19.7 92.3 (14.4) | p = 0.84 NS | |
| fEMG ONSET OF EP | 0.2 ± 0.1 0.2 (0.2) | 0.6 ± 0.4 0.8 (0.7) | 0.4 ± 0.6 0.2 (0.2) | 0.3 ± 0.6 0.1 (0) | p = 0.09 NS | |
| STAGE 5 | FeAA DURING EP (%) | 4.4 ± 1.5 4.5 (1.8) | 5.2 ± 1.5 4.7 (2.3) | 5.6 ± 1.6 6.1 (2) | 5.3 ± 1 4.9 (1) | p = 0.36 NS |
| FiAA DURING EP (%) | 5.7 ± 1.7 6.2 (1.8) | 7 ± 0.8 7 (1.2) | 6.1 ± 1.5 6.7 (1.5) | 6.6 ± 0.6 6.6 (0.4) | p = 0.21 NS | |
| MAC DURING EP | 2.3 ± 0.7 2.3 (0.5) | 2.6 ± 0.7 2.3 (1.1) | 2.7 ± 0.8 2.9 (1) | 2.6 ± 0.5 2.4 (0.5) | p = 0.53 NS | |
| HR DURING EP (beats/min) | 82.9 ± 20.1 77.5 (22) | 87.9 ± 18.2 82 (34) | 76.8 ± 12.7 81 (20) | 77.4 ± 15.6 76 (9) | p = 0.59 NS | |
| SAP DURING EP (mmHg) | 132.9 ± 22.9 128.1 (31.1) | 132.1 ± 13.3 132.1 (13.3) | 126.7 ± 12.5 126.9 (5.8) | 129.1 ± 34.2 119.9 (52) | p = 0.89 NS | |
| DAP DURING EP (mmHg) | 80.4 ± 17.3 84.3 (23.6) | 68.1 ± 9.9 71.3 (16.4) | 78.8 ± 11 79.7 (13.9) | 75.3 ± 20.9 76.4 (13.8) | p = 0.47 NS | |
| MAP DURING EP (mmHg) | 101 ± 18.2 101.9 (20.7) | 96.2 ± 9.6 98.6 (4.8) | 95 ± 9 97.4 (5.6) | 95.4 ± 23.4 92.3 (21) | p = 0.71 NS | |
| fEMG DURING EP | 0.3 ± 0.2 0.2 (0.2) | 0.5 ± 0.4 0.4 (0.8) | 0.3 ± 0.6 0.1 (0.1) | 0.3 ± 0.3 0.1 (0.2) | p = 0.08 NS | |
| STAGE 6 | FeAA AFTER EP (%) | 4.1 ± 1.3 4.1 (2.1) | 3.8 ± 1.1 3.9 (1.4) | 4.7 ± 1 4.4 (0.9) | 4.1 ± 0.9 4 (1.1) | p = 0.57 |
| FiAA AFTER EP (%) | 5 ± 1.6 5.5 (2.4) | 5 ± 1.6 5.1 (3.6) | 5.5 ± 1.1 5.3 (1.7) | 4.6 ± 0.9 4.6 (1.3) | p = 0.70 | |
| MAC AFTER EP | 2 ± 0.6 2 (1) | 1.9 ± 0.5 1.9 (0.7) | 2.3 ± 0.5 2.1 (0.4) | 2 ± 0.4 2 (0.5) | p = 0.58 | |
| HR AFTER EP (beats/min) | 82.5 ± 23.8 77.5 (28) | 82.3 ± 20.8 71 (38) | 67 ± 15.5 69 (33) | 81.7 ± 17.1 83 (26) | p = 0.44 | |
| SAP AFTER EP (mmHg) | 139.8 ± 40.9 134.7 (37.1) | 107.9 ± 19.4 108.6 (32.7) | 104.1 ± 26.3 108.7 (47.8) | 111.8 ± 20.4 107.6 (25.5) | p = 0.07 | |
| DAP AFTER EP (mmHg) | 81.6 ± 23.1 84.3 (35.9) | 54.9 ± 10.8 51.1 (15.6) | 64.9 ± 20.8 65.1 (29.5) | 65.9 ± 13 61.4 (24.5) | p = 0.03 p < 0.05 C | |
| MAP AFTER EP (mmHg) | 104 ± 29.6 101.9 (43.1) | 80.5 ± 14.4 75.2 (25.1) | 80.3 ± 21.2 83.9 (32.6) | 83.9 ± 13.8 80.5 (19.9) | p = 0.08 | |
| fEMG AFTER EP | 0.2 ± 0.1 0.2 (0.2) | 0.2 ± 0.1 0.2 (0.2) | 0.2 ± 0.2 0.1 (0.1) | 0.1 ± 0.1 0.1 (0) | p = 0.37 | |
| Parameters | VIMA-EP X ± SD M (IQR) | VCRII-EP X ± SD M (IQR) | VIMA-nEP X ± SD M (IQR) | VCRII-nEP X ± SD M (IQR) | p-Value b | ||||||||||||
|---|---|---|---|---|---|---|---|---|---|---|---|---|---|---|---|---|---|
| Stage | p-Value a | Stage | p-Value a | Stage | p-Value a | Stage | p-Value a | ||||||||||
| 3 | 4 | 5 | 3 | 4 | 5 | 3 | 4 | 5 | 3 | 4 | 5 | ||||||
| FeAA | 5.1 ± 0.9 5.2 (1) | 4.6 ± 0.7 4.7 (0.9) | 4.4 ± 1.5 4.5 (1.8) | p = 0.31 NS | 4.9 ± 1.4 4.3 (2.2) | 4.5 ± 0.9 4.4 (1) | 5.2 ± 1.5 4.7 (2.3) | p = 0.58 NS | 5 ± 0.4 5 (0.3) | 5.7 ± 1.2 5.2 (2.3) | 5.6 ± 1.6 6.1 (2) | p = 0.49 NS | 4.8 ± 0.9 5 (1.2) | 5 ± 1 4.9 (1) | 5.3 ± 1 4.9 (1) | p = 0.46 NS | p = 0.43 NS |
| FiAA (%) | 6.6 ± 0.8 6.7 (1.4) | 6.1 ± 0.9 6.2 (1.5) | 5.7 ± 1.7 6.2 (1.8) | p = 0.06 NS | 6.4 ± 0.9 5.8 (1.6) | 6.8 ± 0.9 6.7 (1.9) | 7 ± 0.8 7 (1.2) | p = 0.63 NS | 6.5 ± 0.9 6.4 (1.2) | 6 ± 1.5 6.3 (2.2) | 6.1 ± 1.5 6.7 (1.5) | p = 0.67 NS | 7.1 ± 0.8 7.3 (0.9) | 6.8 ± 0.5 6.9 (0.3) | 6.6 ± 0.6 6.6 (0.4) | p = 0.09 NS | p = 0.30 NS |
| MAC | 2.5 ± 0.4 2.5 (0.5) | 2.3 ± 0.3 2.4 (0.5) | 2.3 ± 0.7 2.3 (0.5) | p = 0.56 NS | 2.4 ± 0.7 2.1 (1.1) | 2.2 ± 0.5 2.2 (0.5) | 2.6 ± 0.7 2.3 (1.1) | p = 0.58 NS | 2.4 ± 0.2 2.5 (0.1) | 2.7 ± 0.7 2.5 (1.3) | 2.7 ± 0.8 2.9 (1) | p = 0.58 NS | 2.3 ± 0.4 2.4 (0.6) | 2.4 ± 0.5 2.4 (0.5) | 2.6 ± 0.5 2.4 (0.5) | p = 0.46 NS | p = 0.82 NS |
| HR (beats /min) | 80.4 ± 17 82.5 (23) | 81.9 ± 23 79 (24) | 82.9 ± 20.1 77.5 (22) | p = 0.80 NS | 91.1 ± 20.2 85 (33) | 101 ± 32.2 94 (59) | 87.9 ± 18.2 82 (34) | p = 0.39 NS | 79.7 ± 19.8 77 (14) | 78.5 ± 15.6 79 (9) | 76.8 ± 12.7 81 (20) | p = 0.91 NS | 87.9 ± 16.9 92 (19) | 79.2 ± 18.8 83 (22) | 77.4 ± 15.6 76 (9) | p = 0.07 NS | p = 0.43 NS |
| SAP (mmHg) | 137.2 ± 20.5 143.3 (24.7) | 135.9 ± 26.1 126.2 (33.2) | 132.9 ± 22.9 128.1 (31.1) | p = 0.72 NS | 138.9 ± 11 137.5 (22.3) | 122.9 ± 25.7 129.6 (30.7) | 132.1 ± 13.3 132.1 (13.3) | p = 0.17 NS | 140.7 ± 26.9 142.5 (41.7) | 129.5 ± 14.2 128.7 (19.1) | 126.7 ± 12.5 126.9 (5.8) | p = 0.45 NS | 147.3 ± 40 138.1 (41.2) | 130.7 ± 27.8 119.9 (34.9) | 129.1 ± 34.2 119.9 (52) | p = 0.006 p < 0.01 | p = 0.40 NS |
| DAP (mmHg) | 78.4 ± 16.8 78.4 (27) | 80.2 ± 16.4 81.1 (19.7) | 80.4 ± 17.3 84.3 (23.6) | p = 0.93 NS | 72.8 ± 8.5 74.7 (8.4) | 63.1 ± 13.4 70.2 (25) | 68.1 ± 9.9 71.3 (16.4) | p = 0.14 NS | 82.3 ± 11.7 87.3 (8.9) | 80.7 ± 11.7 85.4 (13.9) | 78.8 ± 11 79.7 (13.9) | p = 0.82 NS | 81.2 ± 16.6 79.4 (23.8) | 79.7 ± 17.4 77.8 (12.7) | 75.3 ± 20.9 76.4 (13.8) | p = 0.18 NS | p = 0.32 NS |
| MAP (mmHg) | 102.8 ± 16.8 104 (21.5) | 101.1 ± 20.4 98.3 (20.7) | 101 ± 18.2 101.9 (20.7) | p = 0.94 NS | 101.2 ± 6.6 100.1 (8.2) | 89.4 ± 18.4 98.3 (24.9) | 96.2 ± 9.6 98.6 (4.8) | p = 0.10 NS | 105.3 ± 17.4 108.5 (21) | 97.1 ± 10.8 99.7 (5.6) | 95 ± 9 97.4 (5.6) | p = 0.25 NS | 105.6 ± 22.9 97.1 (24.2) | 98.4 ± 19.7 92.3 (14.4) | 95.4 ± 23.4 92.3 (21) | p = 0.01 p < 0.05 | p = 0.15 NS |
| fEMG | 1.2 ± 2.1 0.3 (1.2) | 0.2 ± 0.1 0.2 (0.2) | 0.3 ± 0.2 0.2 (0.2) | p = 0.02 p < 0.05 | 0.8 ± 0.6 0.8 (0.8) | 0.6 ± 0.4 0.8 (0.7) | 0.5 ± 0.4 0.4 (0.8) | p = 0.50 NS | 0.8 ± 0.5 0.9 (0.3) | 0.4 ± 0.6 0.2 (0.2) | 0.3 ± 0.6 0.1 (0.1) | p = 0.14 NS | 0.9 ± 1.2 0.4 (0.7) | 0.3 ± 0.6 0.1 (0) | 0.3 ± 0.3 0.1 (0.2) | p = 0.02 p < 0.05 | p = 0.12 NS |
References
- Yli-Hankala, A.; Vakkuri, A.; Särkelä, M.; Lindgren, L.; Korttila, K.; Jäntti, V. Epileptiform Electroencephalogram during Mask Induction of Anesthesia with Sevoflurane. Anesthesiology 1999, 91, 1596–1603. [Google Scholar] [CrossRef] [PubMed] [Green Version]
- Vakkuri, A.; Yli-Hankala, A.; Särkelä, M.; Lindgren, L.; Mennander, S.; Korttila, K.; Saarnivaara, L.; Jäntti, V. Sevoflurane mask induction of anaesthesia is associated with epileptiform EEG in children. Acta Anaesthesiol. Scand. 2001, 45, 805–811. [Google Scholar] [CrossRef]
- Schultz, B.; Otto, C.; Schultz, A.; Osthaus, W.A.; Krauss, T.; Dieck, T.; Sander, B.; Rahe-Meyer, N.; Raymondos, K. Incidence of epileptiform EEG activity in children during mask induction of anaesthesia with brief administration of 8% sevoflurane. PLoS ONE 2012, 7, e40903. [Google Scholar] [CrossRef]
- Julliac, B.; Guehl, D.; Chopin, F.; Arne, P.; Burbaud, P.; Sztark, F.; Cros, A.M. Risk Factors for the Occurrence of Electroencephalogram Abnormalities during Induction of Anesthesia with Sevoflurane in Nonepileptic Patients. Anesthesiology 2007, 106, 243–251. [Google Scholar] [CrossRef] [PubMed] [Green Version]
- Kreuzer, I.; Osthaus, W.A.; Schultz, A.; Schultz, B. Influence of the sevoflurane concentration on the occurrence of epileptiform EEG patterns. PLoS ONE 2014, 9, e89191. [Google Scholar] [CrossRef] [Green Version]
- Vakkuri, A.; Jäntti, V.; Särkelä, M.; Lindgren, L.; Korttila, K.; Yli-Hankala, A. Epileptiform EEG during sevoflurane mask induction: Effect of delaying the onset of hyperventilation. Acta Anaesthesiol. Scand. 2000, 44, 713–719. [Google Scholar] [CrossRef] [PubMed]
- Gibert, S.; Sabourdin, N.; Louvet, N.; Moutard, M.L.; Piat, V.; Guye, M.L.; Rigouzzo, A.; Constant, I. Epileptogenic effect of sevoflurane: Determination of the minimal alveolar concentration of sevoflurane associated with major epileptoid signs in children. Anesthesiology 2012, 117, 1253–1261. [Google Scholar] [CrossRef] [PubMed] [Green Version]
- Akavipat, P.; Sookplung, P.; Premsamran, P.; Toomtong, P.; Kusumaphanyo, C.; Muansaiyart, P. The Thai Anesthesia Incident Monitoring study (Thai AIMS): An analysis of 21 awareness events. J. Med. Assoc. Thai. 2009, 92, 335–341. [Google Scholar] [PubMed]
- Ambulkar, R.P.; Agarwal, V.; Ranganathan, P.; Divatia, J.V. Awareness during general anesthesia: An Indian viewpoint. J. Anaesthesiol. Clin. Pharmacol. 2016, 32, 453–457. [Google Scholar] [CrossRef] [Green Version]
- Zanner, R.; Pilge, S.; Kochs, E.F.; Kreuzer, M.; Schneider, G. Time delay of electroencephalogram index calculation: Analysis of cerebral state, bispectral, and Narcotrend indices using perioperatively recorded electroencephalographic signals. Br. J. Anaesth. 2009, 103, 394–399. [Google Scholar] [CrossRef] [PubMed] [Green Version]
- Olejarczyk, E.; Jozwik, A.; Zmyslowski, W.; Sobieszek, A.; Marciniak, R.; Byrczek, T.; Jałowiecki, P.O.; Bem, T. Automatic detection and analysis of the EEG Sharp Wave-Slow Wave patterns evoked by fluorinated inhalation anesathetic. Clin. Neurophysiol. 2012, 123, 1512–1522. [Google Scholar] [CrossRef] [PubMed]
- Olejarczyk, E.; Kaminski, M.; Marciniak, R.; Byrczek, T.; Stasiowski, M.; Jalowiecki, P.; Sobieszek, A.; Zmysłowski, W. Estimation of the propagation direction and spectral properties of the EEG signals registered during sevoflurane anaesthesia using Directed Transfer Function method. Pol. J. Med. Phys. Eng. 2011, 17, 95–104. [Google Scholar] [CrossRef] [Green Version]
- Olejarczyk, E.; Sobieszek, A.; Rudner, R.; Marciniak, R.; Wartak, M.; Stasiowski, M.; Jałowiecki, P. Evaluation of the EEG-signal during volatile anaesthesia: Methodological approach. Biocyb. Biomed. Eng. 2009, 29, 3–28. [Google Scholar]
- Willand, M.; Rudner, R.; Olejarczyk, E.; Wartak, M.; Marciniak, R.; Stasiowski, M.; Byrczek, T.; Jałowiecki, P. Fractal dimension—A new EEG-based method of assessing the depth of anaesthesia. Anest. Inten. Ter. 2008, 40, 217–222. [Google Scholar]
- Halliburton, J.R. Awareness during general anesthesia: New technology for an old problem. CRNA 1998, 9, 39–43. [Google Scholar]
- Avidan, M.S.; Palanca, B.J.; Glick, D.; Jacobsohn, E.; Villafranca, A.; O’Connor, M.; Mashour, G.A.; BAG-RECALL Study Group. Protocol for the BAG-RECALL clinical trial: A prospective, multi-center, randomized, controlled trial to determine whether a bispectral index-guided protocol is superior to an anesthesia gas-guided protocol in reducing intraoperative awareness with explicit recall in high risk surgical patients. BMC Anesthesiol. 2009, 9, 8. [Google Scholar] [CrossRef] [Green Version]
- Schmidt, G.N.; Bischoff, P.; Standl, T.; Hellstern, A.; Teuber, O.; Schulte Esch, J. Comparative evaluation of the Datex-Ohmeda S/5 Entropy Module and the Bispectral Index monitor during propofol-remifentanil anesthesia. Anesthesiology 2004, 101, 1283–1290. [Google Scholar] [CrossRef] [Green Version]
- Vakkuri, A.; Yli-Hankala, A.; Talja, P.; Mustola, S.; Tolvanen-Laakso, H.; Sampson, T.; Viertiö-Oja, H. Time-frequency balanced spectral entropy as a measure of anesthetic drug effect in central nervous system during sevoflurane, propofol, and thiopental anesthesia. Acta Anaesthesiol. Scand. 2004, 48, 145–153. [Google Scholar] [CrossRef]
- Kelley, S. Monitoring Consciousness, 2nd ed.; Aspect Medical Systems: Norwood, MA, USA, 2007; Volume 7, pp. 1–46. [Google Scholar]
- Rosow, C.; Manberg, P.J. Bispectral index monitoring. Anesthesiol. Clin. N. Am. 2001, 19, 947–966. [Google Scholar] [CrossRef]
- Markand, O.N. Pearls, perils, and pitfalls in the use of the electroencephalogram. Semin Neurol. 2003, 23, 7–46. [Google Scholar]
- Schultz, A.; Siedenberg, M.; Grouven, U.; Kneif, T.; Schultz, B. Comparison of Narcotrend Index, Bispectral Index, spectral and entropy parameters during induction of propofol-remifentanil anaesthesia. J. Clin. Monit Comput. 2008, 22, 103–111. [Google Scholar] [CrossRef] [PubMed]
- Musialowicz, T.; Lahtinen, P.; Pitkänen, O.; Kurola, J.; Parviainen, I. Comparison of spectral entropy and BIS VISTA™ monitor during general anesthesia for cardiac surgery. J. Clin. Monit Comput. 2011, 25, 95–103. [Google Scholar] [CrossRef] [PubMed]
- Kim, H.M.; Shin, S.W.; Yoon, J.Y.; Lee, H.J.; Kim, K.H.; Baik, S.W. Effects of etomidate on bispectral index scale and spectral entropy during induction of anesthesia by means of the raw electroencephalographic and electromyographic characteristics. Korean J. Anesthesiol. 2012, 62, 230–233. [Google Scholar] [CrossRef] [PubMed] [Green Version]
- Stasiowski, M.J.; Marciniak, R.; Duława, A.; Krawczyk, L.; Jałowiecki, P. Epileptiform EEG patterns during different techniques of induction of general anaesthesia with sevoflurane and propofol: A randomised trial. Anaesthesiol. Intensive Ther. 2019, 6. [Google Scholar] [CrossRef]
- Kaisti, K.K.; Jääskeläinen, S.K.; Rinne, J.O.; Metsähonkala, L.; Scheinin, H. Epileptiform discharges during 2 MAC sevoflurane anesthesia in two healthy volunteers. Anesthesiology 1999, 91, 1952–1955. [Google Scholar] [CrossRef]
- Schomer, A.C.; Nearing, B.D.; Schachter, S.C.; Verrier, R.L. Vagus nerve stimulation reduces cardiac electrical instability assessed by quantitative T-wave alternans analysis in patients with drug-resistant focal epilepsy. Epilepsia 2014, 55, 1996–2002. [Google Scholar] [CrossRef]
- Pilge, S.; Jordan, D.; Kochs, E.F.; Schneider, G. Sevoflurane-induced epileptiform electroencephalographic activity and generalized tonic-clonic seizures in a volunteer study. Anesthesiology 2013, 119, 447. [Google Scholar] [CrossRef] [Green Version]
- Mohanram, A.; Kumar, V.; Iqbal, Z.; Markan, S.; Pagel, P.S. Repetitive generalized seizure-like activity during emergence from sevoflurane anesthesia. Can. J. Anaesth. 2007, 54, 657–661. [Google Scholar] [CrossRef]
- Terasako, K.; Ishii, S. Postoperative seizure-like activity following sevoflurane anesthesia. Acta Anaesthesiol. Scand. 1996, 40, 953–954. [Google Scholar] [CrossRef]
- Kuczkowski, K.M. Seizures on emergence from sevoflurane anaesthesia for caesarean section in a healthy parturient. Anaesthesia 2002, 57, 1234–1235. [Google Scholar]
- Hsieh, S.W.; Lan, K.M.; Luk, H.N.; Jawan, B. Postoperative seizures after sevoflurane anesthesia in a neonate. Acta Anaesthesiol. Scand. 2004, 48, 663. [Google Scholar] [CrossRef] [PubMed]
- Hilty, C.A.; Drummond, J.C. Seizure-like activity on emergence from sevoflurane anesthesia. Anesthesiology 2000, 93, 1357–1359. [Google Scholar] [CrossRef] [PubMed]
- Fritz, B.A.; Rao, P.; Mashour, G.A.; Abdallah, A.B.; Burnside, B.A.; Jacobsohn, E.; Zhang, L.; Avidan, M.S. Postoperative recovery with bispectral index versus anesthetic concentration-guided protocols. Anesthesiology 2013, 118, 1113–1122. [Google Scholar] [CrossRef] [PubMed]
- Niedhart, D.J.; Kaiser, H.A.; Jacobsohn, E.; Hantler, C.B.; Evers, A.S.; Avidan, M.S. Intrapatient reproducibility of the BISxp monitor. Anesthesiology 2006, 104, 242–248. [Google Scholar] [CrossRef] [PubMed]
- Ozcan, M.S.; Thompson, D.M.; Cure, J.; Hine, J.R.; Roberts, P.R. Same-patient reproducibility of state entropy: A comparison of simultaneous bilateral measurements during general anesthesia. Anesth. Analg. 2009, 108, 1830–1835. [Google Scholar] [CrossRef] [PubMed]
- Pilge, S.; Kreuzer, M.; Karatchiviev, V.; Kochs, E.F.; Malcharek, M.; Schneider, G. Differences between state entropy and bispectral index during analysis of identical electroencephalogram signals: A comparison with two randomised anaesthetic techniques. Eur. J. Anaesthesiol. 2015, 32, 354–365. [Google Scholar] [CrossRef] [PubMed] [Green Version]
- Viertiö-Oja, H.; Maja, V.; Särkelä, M.; Talja, P.; Tenkanen, N.; Tolvanen-Laakso, H.; Paloheimo, M.; Vakkuri, A.; Yli-Hankala, A.; Meriläinen, P. Description of the Entropy algorithm as applied in the Datex-Ohmeda S/5 Entropy Module. Acta Anaesthesiol. Scand. 2004, 48, 154–161. [Google Scholar] [CrossRef] [PubMed]
- Schuller, P.J.; Newell, S.; Strickland, P.A.; Barry, J.J. Response of bispectral index to neuromuscular block in awake volunteers. Br. J. Anaesth. 2015, 115, i95–i103. [Google Scholar] [CrossRef] [Green Version]
- Li, P.; Yan, C.; Karmakar, C.; Liu, C. Distribution entropy analysis of epileptic EEG signals. In Proceedings of the 2015 37th Annual International Conference of the IEEE Engineering in Medicine and Biology Society (EMBC), Milan, Italy, 25–29 August 2015; pp. 4170–4173. [Google Scholar] [CrossRef]
- Li, P.; Karmakar, C.; Yan, C.; Palaniswami, M.; Liu, C. Classification of 5-S Epileptic EEG Recordings Using Distribution Entropy and Sample Entropy. Front. Physiol. 2016, 7, 136. [Google Scholar] [CrossRef] [Green Version]
- Acharya, U.R.; Sree, S.V.; Alvin, A.P.; Yanti, R.; Suri, J.S. Application of non-linear and wavelet based features for the automated identification of epileptic EEG signals. Int. J. Neural Syst. 2012, 22, 1250002. [Google Scholar] [CrossRef]
- Xiang, J.; Li, C.; Li, H.; Cao, R.; Wang, B.; Han, X.; Chen, J. The detection of epileptic seizure signals based on fuzzy entropy. J. Neurosci. Methods 2015, 243, 18–25. [Google Scholar] [CrossRef] [PubMed]
- Song, Y.; Zhang, J. Discriminating preictal and interictal brain states in intracranial EEG by sample entropy and extreme learning machine. J. Neurosci. Methods 2016, 257, 45–54. [Google Scholar] [CrossRef] [PubMed]
- Lu, W.Y.; Chen, J.Y.; Chang, C.F.; Weng, W.C.; Lee, W.T.; Shieh, J.S. Multiscale Entropy of Electroencephalogram as a Potential Predictor for the Prognosis of Neonatal Seizures. PLoS ONE 2015, 10, e0144732. [Google Scholar] [CrossRef] [PubMed]
- Weng, W.C.; Jiang, G.J.; Chang, C.F.; Lu, W.Y.; Lin, C.Y.; Lee, W.T.; Shieh, J.S. Complexity of Multi-Channel Electroencephalogram Signal Analysis in Childhood Absence Epilepsy. PLoS ONE 2015, 10, e0134083. [Google Scholar] [CrossRef] [PubMed]
- Drummond, J.C. Monitoring depth of anesthesia: With emphasis on the application of the bispectral index and the middle latency auditory evoked response to the prevention of recall. Anesthesiology 2000, 93, 876–882. [Google Scholar] [CrossRef]
- Kreuzer, M.; Zanner, R.; Pilge, S.; Paprotny, S.; Kochs, E.F.; Schneider, G. Time delay of monitors of the hypnotic component of anesthesia: Analysis of state entropy and index of consciousness. Anesth. Analg. 2012, 115, 315–319. [Google Scholar] [CrossRef]
- Laitio, R.M.; Kaskinoro, K.; Särkelä, M.O.; Kaisti, K.K.; Salmi, E.; Maksimow, A.; Långsjö, J.W.; Aantaa, R.; Kangas, K.; Jääskeläinen, S.; et al. Bispectral index, entropy, and quantitative electroencephalogram during single-agent xenon anesthesia. Anesthesiology 2008, 108, 63–70. [Google Scholar] [CrossRef] [PubMed] [Green Version]
- Messner, M.; Beese, U.; Romstöck, J.; Dinkel, M.; Tschaikowsky, K. The bispectral index declines during neuromuscular block in fully awake persons. Anesth. Analg. 2003, 97, 488–491. [Google Scholar] [CrossRef]
- Dahaba, A.A.; Mattweber, M.; Fuchs, A.; Zenz, W.; Rehak, P.H.; List, W.F.; Metzler, H. The effect of different stages of neuromuscular block on the bispectral index and the bispectral index-XP under remifentanil/propofol anesthesia. Anesth. Analg. 2004, 99, 781–787. [Google Scholar] [CrossRef]
- Yue, H.; Han, J.; Liu, L.; Wang, K.; Li, J. Effect of rocuronium on the bispectral index under anesthesia and tracheal intubation. Exp. Ther. Med. 2016, 12, 3785–3789. [Google Scholar] [CrossRef] [Green Version]
- Chakrabarti, D.; Surve, R.M.; Bs, D.; Masapu, D. Intraoperative aberrant bispectral index values due to facial nerve monitoring. J. Clin. Anesth. 2017, 37, 61–62. [Google Scholar] [CrossRef] [PubMed]
- Chakrabarti, D.; Ramesh, V.J.; Pendharkar, H. Endovascular coil detachment causing EMG artefact in BIS: A mechanistic exploration. J. Clin. Monit. Comput. 2016, 30, 203–206. [Google Scholar] [CrossRef] [PubMed]
- Aho, A.J.; Yli-Hankala, A.; Lyytikäinen, L.P.; Jäntti, V. Facial muscle activity, Response Entropy, and State Entropy indices during noxious stimuli in propofol-nitrous oxide or propofol-nitrous oxide-remifentanil anaesthesia without neuromuscular block. Br. J. Anaesth. 2009, 102, 227–233. [Google Scholar] [CrossRef] [PubMed] [Green Version]


| Induction | VIMA-EP N = 10 | VCRII-EP N = 7 | VIMA-nEP N = 6 | VCRII-nEP N = 9 | p-Value a | |
|---|---|---|---|---|---|---|
| Level | Parameters | |||||
| STAGE 1 | SE START | 88.8 ± 1.6 89 (2) | 88.1 ± 1.8 88 (3) | 89.3 ± 0.8 89.5 (1) | 88.3 ± 1 89 (1) | p = 0.41 NS |
| RE START | 97.7 ± 1.3 98 (1) | 98.3 ± 0.8 98 (1) | 98.5 ± 0.8 99 (1) | 98.4 ± 0.7 99 (1) | p = 0.29 NS | |
| STAGE 2 | SE DURING LOC | 85 ± 4.7 87 (3) | 85.9 ± 4.9 87 (2) | 85.8 ± 2 86 (1) | 88.2 ± 1.9 89 (2) | p = 0.07 NS |
| RE DURING LOC | 95.5 ± 3.9 96.5 (2) | 95.9 ± 4.1 98 (3) | 96.3 ± 2.9 97.5 (3) | 96.8 ± 2.2 97 (2) | p = 0.95 NS | |
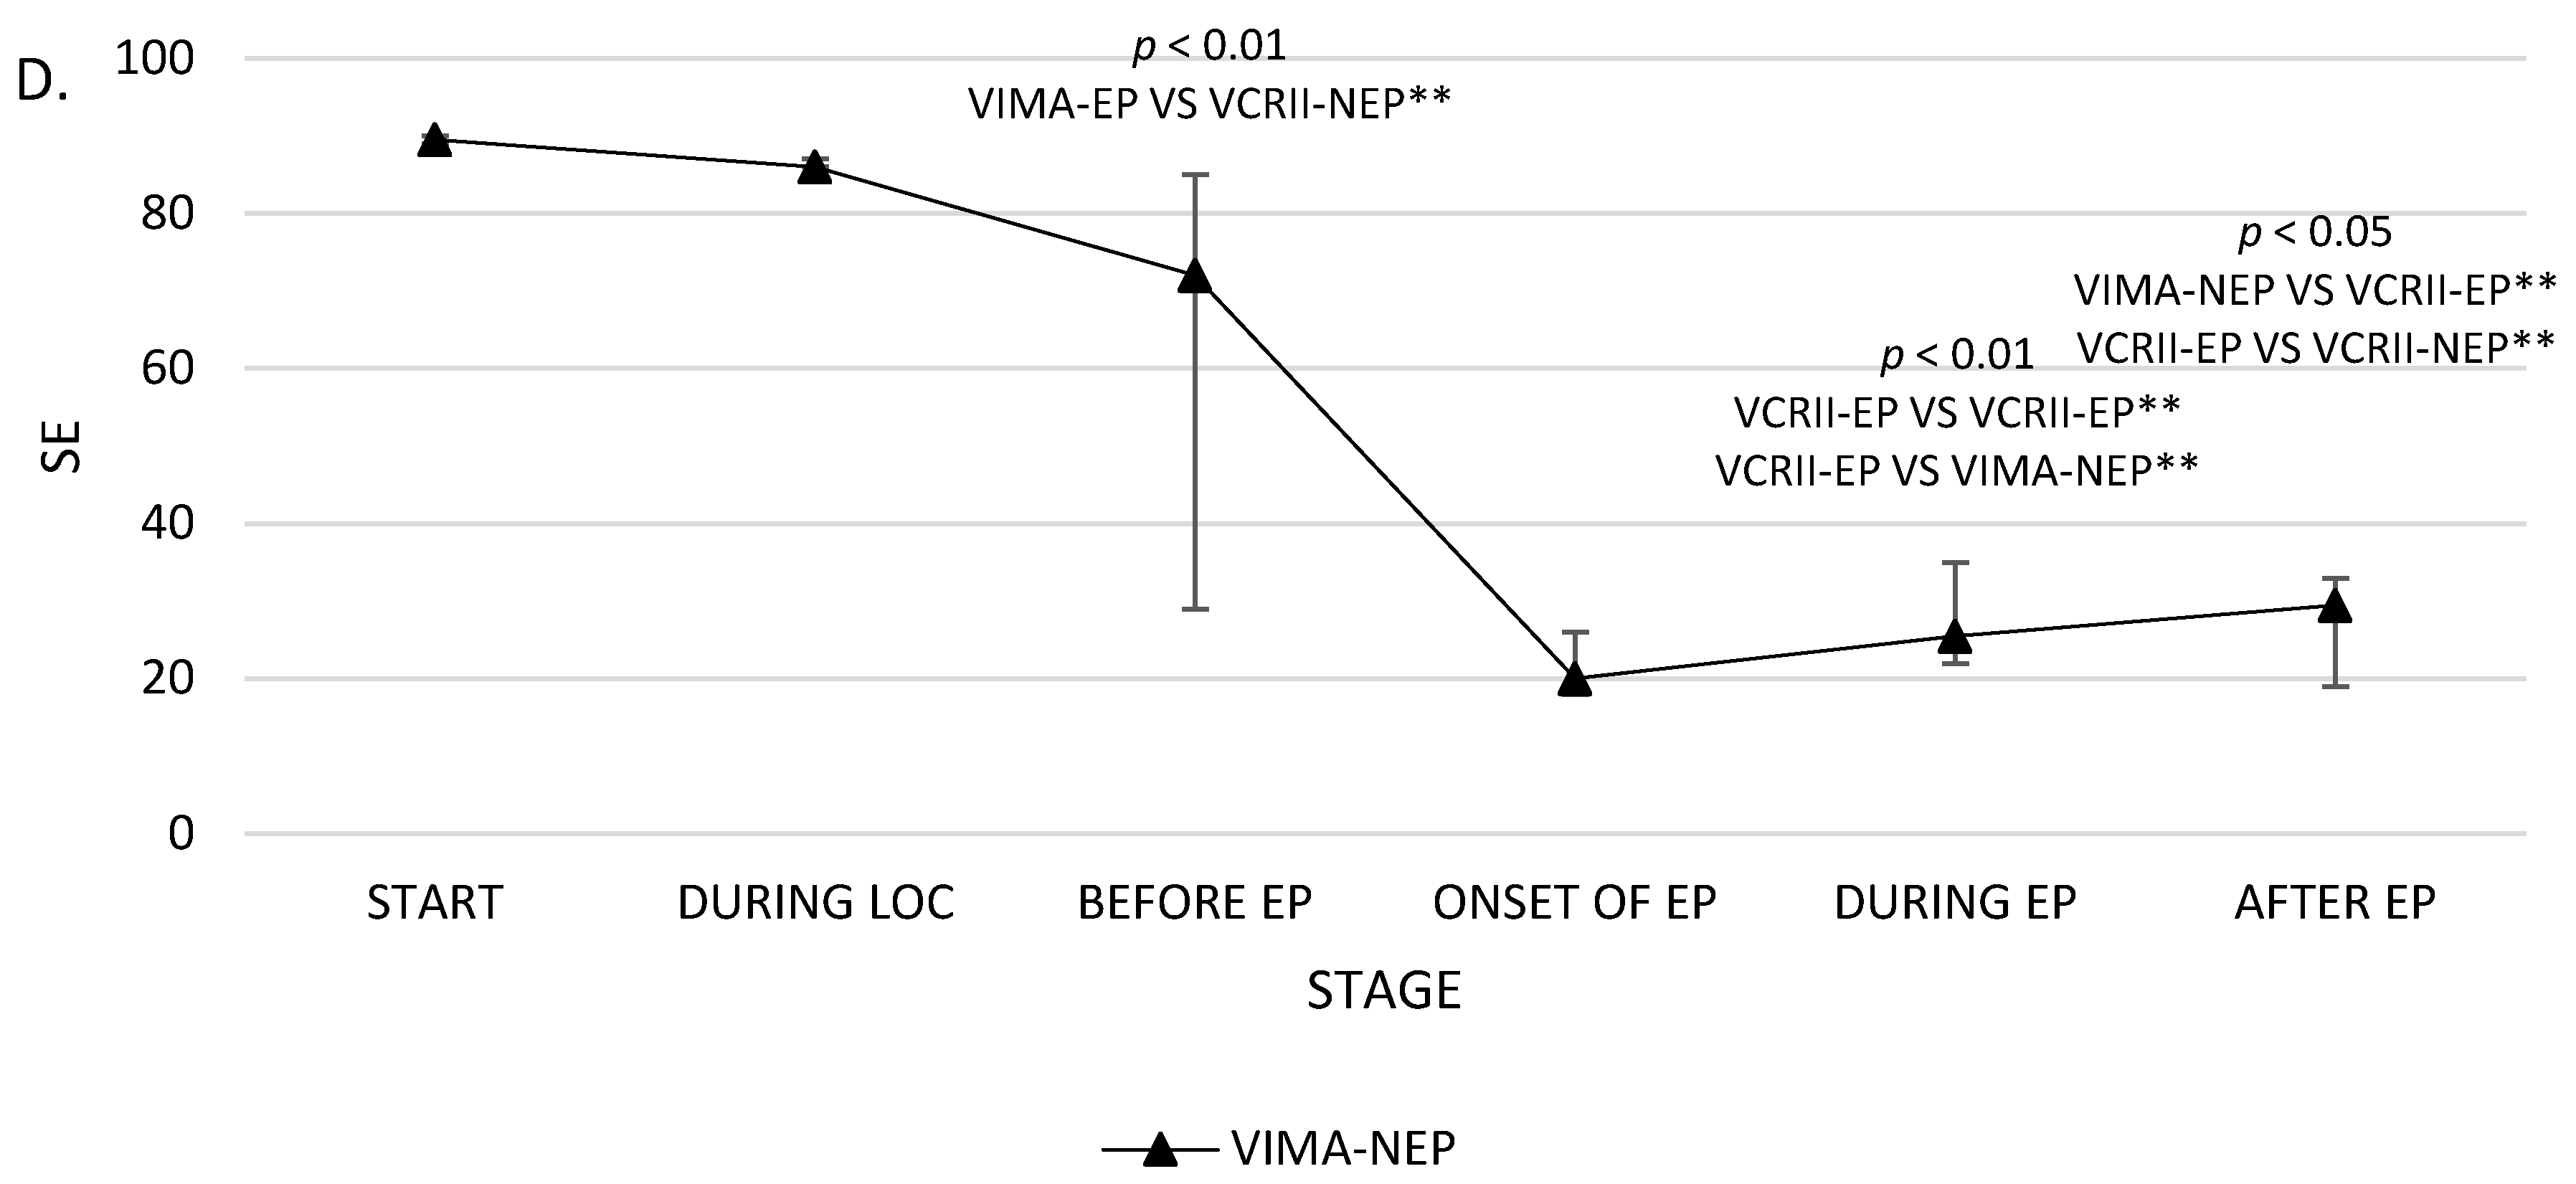
| STAGE 3 | SE BEFORE EP | 26.1 ± 14.5 25 (14) | 53.4 ± 39.1 75 (77) | 61 ± 29.8 72 (56) | 82.1 ± 9.6 87 (9) | p = 0.004 p < 0.01 A |
| RE BEFORE EP | 30 ± 20 27 (16) | 59.1 ± 44 87 (85) | 67.2 ± 33.3 80 (67) | 90 ± 10 91 (7) | p = 0.009 p < 0.01 A | |
| STAGE 4 | SE ONSET OF EP | 24 ± 11.7 21.5 (16) | 46.9 ± 38.4 33 (75) | 22.5 ± 6 20 (8) | 15.1 ± 5.8 13 (2) | p = 0.11 NS |
| RE ONSET OF EP | 29 ± 16 26.5 (22) | 53.4 ± 41.4 44 (84) | 24.5 ± 5 23 (6) | 17.7 ± 7.8 16 (6) | p = 0.16 NS | |
| STAGE 5 | SE DURING EP | 30 ± 20.1 21.5 (17) | 10.9 ± 3.3 11 (5) | 27 ± 6.7 25.5 (13) | 18.6 ± 5.6 20 (4) | p = 0.001 p < 0.01 B,D |
| RE DURING EP | 35.9 ± 24.3 27.5 (27) | 12.3 ± 3.5 12 (5) | 29 ± 7 30 (13) | 19.6 ± 6.4 21 (6) | p = 0.001 p < 0.01 B,D | |
| STAGE 6 | SE AFTER EP | 24.1 ± 11.2 23 (8) | 14.9 ± 2.6 15 (3) | 28.2 ± 8.1 29.5 (14) | 22.9 ± 3.7 22 (4) | p = 0.02 p < 0.05 D,E |
| RE AFTER EP | 25.5 ± 12 23.5 (14) | 14.9 ± 2.6 15 (3) | 29.5 ± 7.1 30 (10) | 24.2 ± 3.6 25 (4) | p = 0.005 p < 0.01 D,E | |
| Parameters | VIMA-EP | VCRII-EP | VIMA-nEP | VCRII-nEP | p-Value b | ||||||||||||
|---|---|---|---|---|---|---|---|---|---|---|---|---|---|---|---|---|---|
| Stage | p-Value a | Stage | p-Value a | Stage | p-Value a | Stage | p-Value a | ||||||||||
| 3 | 4 | 5 | 3 | 4 | 5 | 3 | 4 | 5 | 3 | 4 | 5 | ||||||
| SE | 26.1 ± 14.5 25 (14) | 24 ± 11.7 21.5 (16) | 30 ± 20.1 21.5 (17) | p = 0.03 p < 0.05 | 53.4 ± 39.1 75 (77) | 46.9 ± 38.4 33 (75) | 10.9 ± 3.3 11 (5) | p = 0.20 NS | 61 ± 29.8 72 (56) | 22.5 ± 6 20 (8) | 27 ± 6.7 25.5 (13) | p = 0.15 NS | 82.1 ± 9.6 87 (9) | 15.1 ± 5.8 13 (2) | 18.6 ± 5.6 20 (4) | p = 0.0006 p < 0.01 | p = 0.002 p < 0.01 |
| RE | 30 ± 20 27 (16) | 29 ± 16 26.5 (22) | 35.9 ± 24.3 27.5 (27) | p = 0.02 p < 0.05 | 59.1 ± 44 87 (85) | 53.4 ± 41.4 44 (84) | 12.3 ± 3.5 12 (5) | p = 0.34 NS | 67.2 ± 33.3 80 (67) | 24.5 ± 5 23 (6) | 29 ± 7 30 (13) | p = 0.15 NS | 90 ± 10 91 (7) | 17.7 ± 7.8 16 (6) | 19.6 ± 6.4 21 (6) | p = 0.0001 p < 0.001 | p = 0.001 p < 0.01 |
| Group | Parameter | SE R’-Spearman p-Value a | RE R’-Spearman p-Value a | ||||||
|---|---|---|---|---|---|---|---|---|---|
| Stage | Stage | ||||||||
| 3 | 4 | 5 | 6 | 3 | 4 | 5 | 6 | ||
| VCRII-EP | FeAA | −0.16 p = 0.73 | −0.46 p = 0.29 | −0.27 p = 0.55 | −0.54 p = 0.21 | −0.11 p = 0.82 | −0.43 p = 0.34 | −0.2 p = 0.67 | −0.54 p = 0.21 |
| FiAA | −0.23 p = 0.61 | 0.68 p = 0.09 | −0.85 p = 0.01 | −0.09 p = 0.85 | −0.32 p = 0.48 | 0.54 p = 0.22 | −0.87 p = 0.01 | −0.09 p = 0.85 | |
| MAC | −0.16 p = 0.73 | −0.46 p = 0.29 | −0.27 p = 0.55 | −0.54 p = 0.21 | −0.11 p = 0.82 | −0.43 p = 0.34 | −0.2 p = 0.67 | −0.54 p = 0.21 | |
| HR | 0.56 p = 0.19 | 0.93 p = 0.002 | −0.75 p = 0.05 | −0.68 p = 0.09 | 0.54 p = 0.22 | 0.89 p = 0.01 | −0.65 p = 0.11 | −0.68 p = 0.09 | |
| SAP | 0.61 p = 0.14 | 0.71 p = 0.07 | −0.29 p = 0.53 | 0.11 p = 0.82 | 0.54 p = 0.22 | 0.61 p = 0.15 | −0.24 p = 0.61 | 0.11 p = 0.82 | |
| DAP | 0.09 p = 0.85 | 0.61 p = 0.15 | 0.07 p = 0.88 | 0.2 p = 0.67 | 0 p = 1 | 0.5 p = 0.25 | 0.05 p = 0.91 | 0.2 p = 0.67 | |
| MAP | 0.25 p = 0.59 | 0.68 p = 0.09 | −0.15 p = 0.76 | 0.11 p = 0.82 | 0.14 p = 0.76 | 0.57 p = 0.18 | −0.15 p = 0.76 | 0.11 p = 0.82 | |
| fEMG | −0.18 p = 0.7 | −0.23 p = 0.61 | 0.15 p = 0.76 | −0.08 p = 0.86 | −0.14 p = 0.76 | −0.14 p = 0.76 | 0.2 p = 0.67 | −0.08 p = 0.86 | |
| VCRII-nEP | FeAA | 0.25 p = 0.51 | 0.3 p = 0.43 | 0.46 p = 0.21 | −0.58 p = 0.1 | 0.34 p = 0.37 | 0.46 p = 0.21 | 0.3 p = 0.44 | −0.34 p = 0.36 |
| FiAA | −0.34 p = 0.38 | −0.54 p = 0.14 | −0.58 p = 0.1 | −0.37 p = 0.33 | −0.55 p = 0.13 | −0.25 p = 0.51 | −0.44 p = 0.23 | −0.34 p = 0.36 | |
| MAC | 0.25 p = 0.51 | 0.33 p = 0.39 | 0.46 p = 0.21 | −0.59 p = 0.09 | 0.34 p = 0.37 | 0.46 p = 0.22 | 0.3 p = 0.44 | −0.36 p = 0.34 | |
| HR | 0.71 p = 0.03 | −0.19 p = 0.62 | 0.43 p = 0.25 | 0.09 p = 0.82 | 0.52 p = 0.15 | −0.05 p = 0.91 | 0.53 p = 0.14 | 0 p = 0.99 | |
| SAP | −0.1 p = 0.8 | −0.69 p = 0.04 | −0.08 p = 0.83 | −0.18 p = 0.64 | −0.38 p = 0.31 | −0.57 p = 0.11 | −0.12 p = 0.76 | 0.01 p = 0.98 | |
| DAP | −0.08 p = 0.85 | −0.8 p = 0.01 | 0.22 p = 0.57 | 0.05 p = 0.9 | −0.29 p = 0.45 | −0.69 p = 0.04 | 0.12 p = 0.76 | 0.17 p = 0.67 | |
| MAP | −0.13 p = 0.73 | −0.8 p = 0.01 | −0.11 p = 0.78 | −0.09 p = 0.81 | −0.39 p = 0.3 | −0.69 p = 0.04 | −0.18 p = 0.65 | 0.12 p = 0.76 | |
| fEMG | 0.57 p = 0.11 | 0.6 p = 0.09 | 0.33 p = 0.39 | 0.36 p = 0.34 | 0.64 p = 0.06 | 0.6 p = 0.09 | 0.55 p = 0.13 | 0.36 p = 0.34 | |
| VIMA-EP | FeAA | −0.04 p = 0.91 | −0.12 p = 0.75 | −0.62 p = 0.06 | −0.3 p = 0.39 | −0.22 p = 0.54 | −0.11 p = 0.76 | −0.47 p = 0.17 | −0.37 p = 0.29 |
| FiAA | −0.14 p = 0.7 | −0.38 p = 0.28 | −0.57 p = 0.08 | −0.33 p = 0.35 | −0.04 p = 0.92 | −0.44 p = 0.21 | −0.43 p = 0.22 | −0.36 p = 0.31 | |
| MAC | −0.04 p = 0.91 | 0.25 p = 0.49 | −0.39 p = 0.27 | −0.3 p = 0.39 | −0.22 p = 0.54 | 0.24 p = 0.5 | −0.28 p = 0.44 | −0.37 p = 0.29 | |
| HR | −0.19 p = 0.59 | 0.03 p = 0.93 | −0.1 p = 0.79 | −0.06 p = 0.87 | −0.34 p = 0.34 | 0.17 p = 0.64 | 0.02 p = 0.96 | 0.01 p = 0.99 | |
| SAP | −0.07 p = 0.85 | −0.37 p = 0.29 | −0.27 p = 0.45 | −0.13 p = 0.73 | 0.05 p = 0.89 | −0.52 p = 0.12 | −0.5 p = 0.14 | −0.21 p = 0.56 | |
| DAP | −0.53 p = 0.12 | −0.16 p = 0.65 | −0.1 p = 0.77 | −0.24 p = 0.5 | −0.35 p = 0.33 | −0.3 p = 0.39 | −0.37 p = 0.29 | −0.32 p = 0.37 | |
| MAP | −0.09 p = 0.8 | −0.2 p = 0.58 | −0.1 p = 0.77 | −0.2 p = 0.58 | 0.09 p = 0.82 | −0.35 p = 0.32 | −0.32 p = 0.36 | −0.27 p = 0.45 | |
| fEMG | 0.06 p = 0.87 | −0.03 p = 0.94 | −0.11 p = 0.76 | −0.15 p = 0.69 | 0.21 p = 0.56 | 0.07 p = 0.84 | 0.06 p = 0.87 | −0.19 p = 0.59 | |
| VIMA-nEP | FeAA | 0.37 p = 0.47 | −0.03 p = 0.96 | −0.2 p = 0.7 | −0.67 p = 0.15 | 0.46 p = 0.35 | 0.06 p = 0.91 | −0.03 p = 0.96 | −0.71 p = 0.11 |
| FiAA | −0.6 p = 0.21 | 0.46 p = 0.35 | −0.61 p = 0.2 | −0.38 p = 0.46 | −0.49 p = 0.32 | 0.17 p = 0.74 | −0.49 p = 0.32 | −0.49 p = 0.33 | |
| MAC | 0.37 p = 0.47 | 0.26 p = 0.62 | −0.2 p = 0.7 | −0.67 p = 0.15 | 0.46 p = 0.35 | −0.06 p = 0.91 | −0.03 p = 0.96 | −0.71 p = 0.11 | |
| HR | 0.26 p = 0.62 | 0.29 p = 0.58 | 0.43 p = 0.39 | −0.26 p = 0.61 | 0.14 p = 0.78 | −0.23 p = 0.66 | 0.67 p = 0.15 | −0.29 p = 0.58 | |
| SAP | −0.2 p = 0.7 | −0.32 p = 0.54 | −0.17 p = 0.74 | −0.81 p = 0.05 | −0.12 p = 0.83 | −0.17 p = 0.74 | −0.23 p = 0.66 | −0.77 p = 0.07 | |
| DAP | −0.37 p = 0.47 | −0.32 p = 0.54 | −0.03 p = 0.96 | −0.9 p = 0.01 | −0.35 p = 0.5 | −0.75 p = 0.08 | 0.14 p = 0.78 | −0.94 p = 0 | |
| MAP | −0.2 p = 0.7 | −0.49 p = 0.32 | 0.12 p = 0.83 | −0.9 p = 0.01 | −0.12 p = 0.83 | −0.41 p = 0.42 | 0.23 p = 0.66 | −0.94 p = 0 | |
| fEMG | 0.35 p = 0.5 | −0.28 p = 0.59 | 0.02 p = 0.98 | −0.05 p = 0.92 | 0.35 p = 0.49 | −0.92 p = 0.01 | 0.14 p = 0.79 | −0.17 p = 0.75 | |
| Parameter | Stage 4 | Stage 5 | Stage 6 | ||||||||||||
|---|---|---|---|---|---|---|---|---|---|---|---|---|---|---|---|
| SE N/% | Polispykes (PS) and Rhytmic Polispykes (RPS) | Periodic Epileptiform Discharges (PED) | Polyspikes (PS) and Rhytmic Polispykes (RPS) | Periodic Epileptiform Discharges (PED) | Polyspikes (PS) and Rhytmic Polispykes (RPS) | Periodic Epileptiform Discharges (PED) | |||||||||
| VCRII-EP | VIMA-EP | Total | p-Value a | VIMA-EP | VCRII-EP | VIMA-EP | Total | p-Value a | VIMA-EP | VCRII-EP | VIMA-EP | Total | p-Value a | VIMA-EP | |
| deep anesthesia | 3 | 4 | 7 | p = 0.23 NS | 3 | 7 | 3 | 10 | p = 0.15 NS | 3 | 7 | 4 | 11 | p = 0.17 NS | 4 |
| (0.30) | 42.9% | 80.0% | 58.3% | 60% | 100.0% | 60.0% | 83.3% | 60% | 100% | 80% | 91.7% | 80% | |||
| strong anesthesia | 1 | 0 | 1 | 1 | 0 | 1 | 1 | 1 | 0 | 0 | 0 | 1 | |||
| <30.40) | 14.3% | 0.0% | 8.3% | 20% | 0.0% | 20.0% | 8.3% | 20% | 0% | 0% | 0% | 20% | |||
| Norm | 0 | 1 | 1 | 1 | 0 | 0 | 0 | 1 | 0 | 1 | 1 | 0 | |||
| <40.60) | 0.0% | 20.0% | 8.3% | 20% | 0.0% | 0.0% | 0.0% | 20% | 0% | 20% | 8.3% | 0% | |||
| possible recovery from anesthesia | 0 | 0 | 0 | 0 | 0 | 0 | 0 | 0 | 0 | 0 | 0 | 0 | |||
| <60.80) | 0.0% | 0.0% | 0.0% | 0% | 0.0% | 0.0% | 0.0% | 0% | 0% | 0% | 0% | 0% | |||
| recovery from anesthesia | 3 | 0 | 3 | 0 | 0 | 1 | 1 | 0 | 0 | 0 | 0 | 0 | |||
| <80.100) | 42.9% | 0.0% | 25.0% | 0% | 0.0% | 20.0% | 8.3% | 0% | 0% | 0% | 0% | 0% | |||
© 2020 by the authors. Licensee MDPI, Basel, Switzerland. This article is an open access article distributed under the terms and conditions of the Creative Commons Attribution (CC BY) license (http://creativecommons.org/licenses/by/4.0/).
Share and Cite
Stasiowski, M.; Duława, A.; Szumera, I.; Marciniak, R.; Niewiadomska, E.; Kaspera, W.; Krawczyk, L.; Ładziński, P.; Grabarek, B.O.; Jałowiecki, P. Variations in Values of State, Response Entropy and Haemodynamic Parameters Associated with Development of Different Epileptiform Patterns during Volatile Induction of General Anaesthesia with Two Different Anaesthetic Regimens Using Sevoflurane in Comparison with Intravenous Induct: A Comparative Study. Brain Sci. 2020, 10, 366. https://doi.org/10.3390/brainsci10060366
Stasiowski M, Duława A, Szumera I, Marciniak R, Niewiadomska E, Kaspera W, Krawczyk L, Ładziński P, Grabarek BO, Jałowiecki P. Variations in Values of State, Response Entropy and Haemodynamic Parameters Associated with Development of Different Epileptiform Patterns during Volatile Induction of General Anaesthesia with Two Different Anaesthetic Regimens Using Sevoflurane in Comparison with Intravenous Induct: A Comparative Study. Brain Sciences. 2020; 10(6):366. https://doi.org/10.3390/brainsci10060366
Chicago/Turabian StyleStasiowski, Michał, Anna Duława, Izabela Szumera, Radosław Marciniak, Ewa Niewiadomska, Wojciech Kaspera, Lech Krawczyk, Piotr Ładziński, Beniamin Oskar Grabarek, and Przemysław Jałowiecki. 2020. "Variations in Values of State, Response Entropy and Haemodynamic Parameters Associated with Development of Different Epileptiform Patterns during Volatile Induction of General Anaesthesia with Two Different Anaesthetic Regimens Using Sevoflurane in Comparison with Intravenous Induct: A Comparative Study" Brain Sciences 10, no. 6: 366. https://doi.org/10.3390/brainsci10060366