Article

Identification of Hub Genes Associated with Breast Cancer Using Integrated Gene Expression Data with Protein-Protein Interaction Network

1
Department of Information Systems, College of Computer and Information Sciences, Jouf University, Sakaka 72441, Saudi Arabia
2
School of Mathematics, Statistics and Computer Science, University of KwaZulu-Natal, Private Bag X01, Pietermaritzburg 3209, South Africa
3
Faculty of Mathematical and Computer Sciences, University of Gezira, Wad Madani 11123, Sudan
4
Division of Mathematics and Computer Science, University of South Carolina-Upstate, 800 University Way, Spartanburg, SC 29303, USA
5
School of Public Health, Faculty of Health Sciences, University of Witwatersrand, Johannesburg 2193, South Africa
*
Author to whom correspondence should be addressed.
Appl. Sci. 2023, 13(4), 2403; https://doi.org/10.3390/app13042403
Submission received: 25 January 2023 / Revised: 6 February 2023 / Accepted: 10 February 2023 / Published: 13 February 2023

Abstract

:
Breast cancer (BC) is the most incident cancer type among women. BC is also ranked as the second leading cause of death among all cancer types. Therefore, early detection and prediction of BC are significant for prognosis and in determining the suitable targeted therapy. Early detection using morphological features poses a significant challenge for physicians. It is therefore important to develop computational techniques to help determine informative genes, and hence help diagnose cancer in its early stages. Eight common hub genes were identified using three methods: the maximal clique centrality (MCC), the maximum neighborhood component (MCN), and the node degree. The hub genes obtained were CDK1, KIF11, CCNA2, TOP2A, ASPM, AURKB, CCNB2, and CENPE. Enrichment analysis revealed that the differentially expressed genes (DEGs) influenced multiple pathways. The most significant identified pathways were focal adhesion, ECM-receptor interaction, melanoma, and prostate cancer pathways. Additionally, survival analysis using Kaplan–Meier was conducted, and the results showed that the obtained eight hub genes are promising candidate genes to serve as prognostic and diagnostic biomarkers for BC. Furthermore, a correlation study between the clinicopathological factors in BC and the eight hub genes was performed. The results showed that all eight hub genes are associated with the clinicopathological variables of BC. Using an integrated analysis of RNASeq and microarray data, a protein-protein interaction (PPI) network was developed. Eight hub genes were identified in this study, and they were validated using previous studies. Additionally, Kaplan-Meier was used to verify the prognostic value of the obtained hub genes.

1. Background

Cancer is one of the continually-developing non-communicable diseases (NCDs) that affects many people worldwide. The World Health Organization (WHO) reported that NCDs are a leading cause of death and responsible for 71% of global deaths [1]. Among these, cancer is the most common and deadliest in the world [2]. The International Cancer Statistics indicates that about 19.3 million new cancer cases occurred in 2020 alone, with close to 10 million deaths of 36 cancers in 185 countries [2]. Breast cancer (BC) is the most incident cancer among women, with an estimated 2.3 million new cases, followed by lung, colorectal, prostate, and stomach cancers. BC is a heterogeneous cancer with different characteristics, such as morphological appearance, profile, response to therapy, tumour-node-metastasis (TNM) staging, and histological grade [3,4].
Currently, breast cancer early detection using morphological features poses a significant challenge for physicians [5]. For this reason, researchers have recently made tremendous efforts to develop models that allow early detection or prevention of breast cancer and increase the likelihood of a cure [6,7]. Next-generation sequencing (NGS) technologies that detect the expression of thousands of genes in a single assay have proven to be an effective tool for early cancer diagnosis. These technologies also produce massive gene expression data, facilitating cancer diagnoses and prognoses. Although numerous efforts have been made, the predictive and prognostic factors utilized for breast cancer therapy are insufficient. Therefore, new markers need to be identified to help targeted treatment [3,8]. Gene expression data allows determining the key biomarkers that might help in the early and efficient detection of breast cancer and can potentially increase the patient’s survival rates [9]. Moreover, gene expression data helps identify the pathways and molecular information driving the disease from early to late stage. Such information can aid in understanding the disease mechanism more clearly. For example, some genes could be linked to faster disease progression, and some could be linked to slow progression. Combining gene expression data with existing proteomic data (i.e., PPI) may help us gain a deeper knowledge of prevalent human disorders because PPIs exhibit one of the clearest functional links between genes. In order to identify protein complexes and signaling pathways in cancer, it is crucial to construct PPI networks.
Several studies on analysing microarray and RNASeq gene expression data use pathway tools to infer meaningful pathways out of these gene expression data. These studies include the work of Dhirachaikulpanich et al. [10], who integrated gene expression data based on microarray and RNASeq technologies to find the DEGs and age-related macular degeneration (AMD) associated pathways. Their results showed two novel pathways associated with high enrichment in DEGs in AMD, namely the neuroactive-ligand receptor interaction pathway and the extracellular matrix (ECM) receptor interaction pathway. Moreover, Dhirachaikulpanich et al. conducted a protein-protein interaction (PPI) network to identify the hub genes, which revealed HDAC1 and CDK1 as two central hub genes connected with the control of cell proliferation/differentiation processes. Nisar et al. [11] integrated microarray and RNASeq gene expression data for pancreatic cancer (PaCa) to find the DEGs. Additionally, they conducted PPI network and pathway analyses. Their results indicated that ITGA1, ITGA2, ITGB1, ITGB3, MET, LAMB1, VEGFA, PTK2, and TGFβ1 are important hub genes. In addition, their results also identified two important pathways, which are the ECM–receptor interaction and focal adhesion pathways. Hozhabri et al. [12] integrated four microarray gene expression datasets of colorectal cancer (CRC) downloaded from the GEO database. They conducted DEGs, GO terms, and Kyoto Encyclopaedia of Genes and Genomes pathway (KEGG) enrichment analyses. Their results showed that the regulation of cell proliferation, biocarbonate transport, Wnt, and IL-17 signaling pathways, and nitrogen metabolism were the most significant pathways associated with their DEGs list. They also constructed a PPI network of the DEGs using Cytoscape software, which was utilized to identify the most critical hub genes (MYC, CXCL1, CD44, MMP1, and CXCL12). Karimizadeh et al. [13] identified 619, 52, and 119 DEGs from the lung tissues, peripheral blood mononuclear cell (PBMC), and skin using ten microarray gene expression data, respectively. The DEGs they identified were used to build a PPI network using the STRING database to find the interacting genes. Their results showed that 12, 2, and 4 functional clusters associated with the three tissues were identified, respectively. In addition, their results revealed that the most significantly enriched pathway in the three tissues was the tumor necrosis factor (TNF) signaling pathway. Castillo et al. [14] proposed data integration using microarray, RNASeq, and the integrated data from both microarray and RNASeq. Their integration pipeline obtained 98 DEGs. Thereafter, they ranked the 98 genes using the mutual information-based ranking provided by the minimum redundancy maximum relevance (mRMR) algorithm and selected the first six genes. Their results showed that SVM, RF, and KNN scored an accuracy of 97.6%, 97.4%, and 94.9%, respectively, when using the 98 genes and 96.8%, 87.4%, and 94.1%, respectively, in the case of the reduced six genes.
This study aimed to discover new biomarkers or hub genes from DEGs of an integrated analysis of microarray and RNASeq gene expression data, then use these hub genes in a further analysis. The PPI network is constructed using the STRING database and Cytoscape software for visualization. In the PPI network, the interaction can be direct or indirect. In the direct interaction, the interacting proteins are closely bound together in performing certain functions. The indirect interaction is known as functional association. These interactions are predicted using computational methods that use the transfer of knowledge between organisms and the interactions that are collected from other primary databases. Additionally, Kyoto Encyclopaedia of Genes and Genomes (KEGG) pathways and gene ontology (GO) analyses are conducted to construct meaningful information from the DEGs using the Enricher web tool. The top 10 hub genes are obtained from each method of the three methods: maximal clique centrality (MCC), maximum neighborhood component (MCN), and degree method. The intersection of these three methods’ top ten hub genes resulted in the eight hub genes (CDK1, KIF11, CCNA2, TOP2A, ASPM, AURKB, CCNB2, and CENPE). Moreover, the survival information for the patients with nodal, oestrogen, and progesterone receptor status is used after splitting them into two groups based on the median expression level of these eight hub genes. Additionally, a correlation analysis of the clinicopathological variables in BC with the eight hub genes is performed.

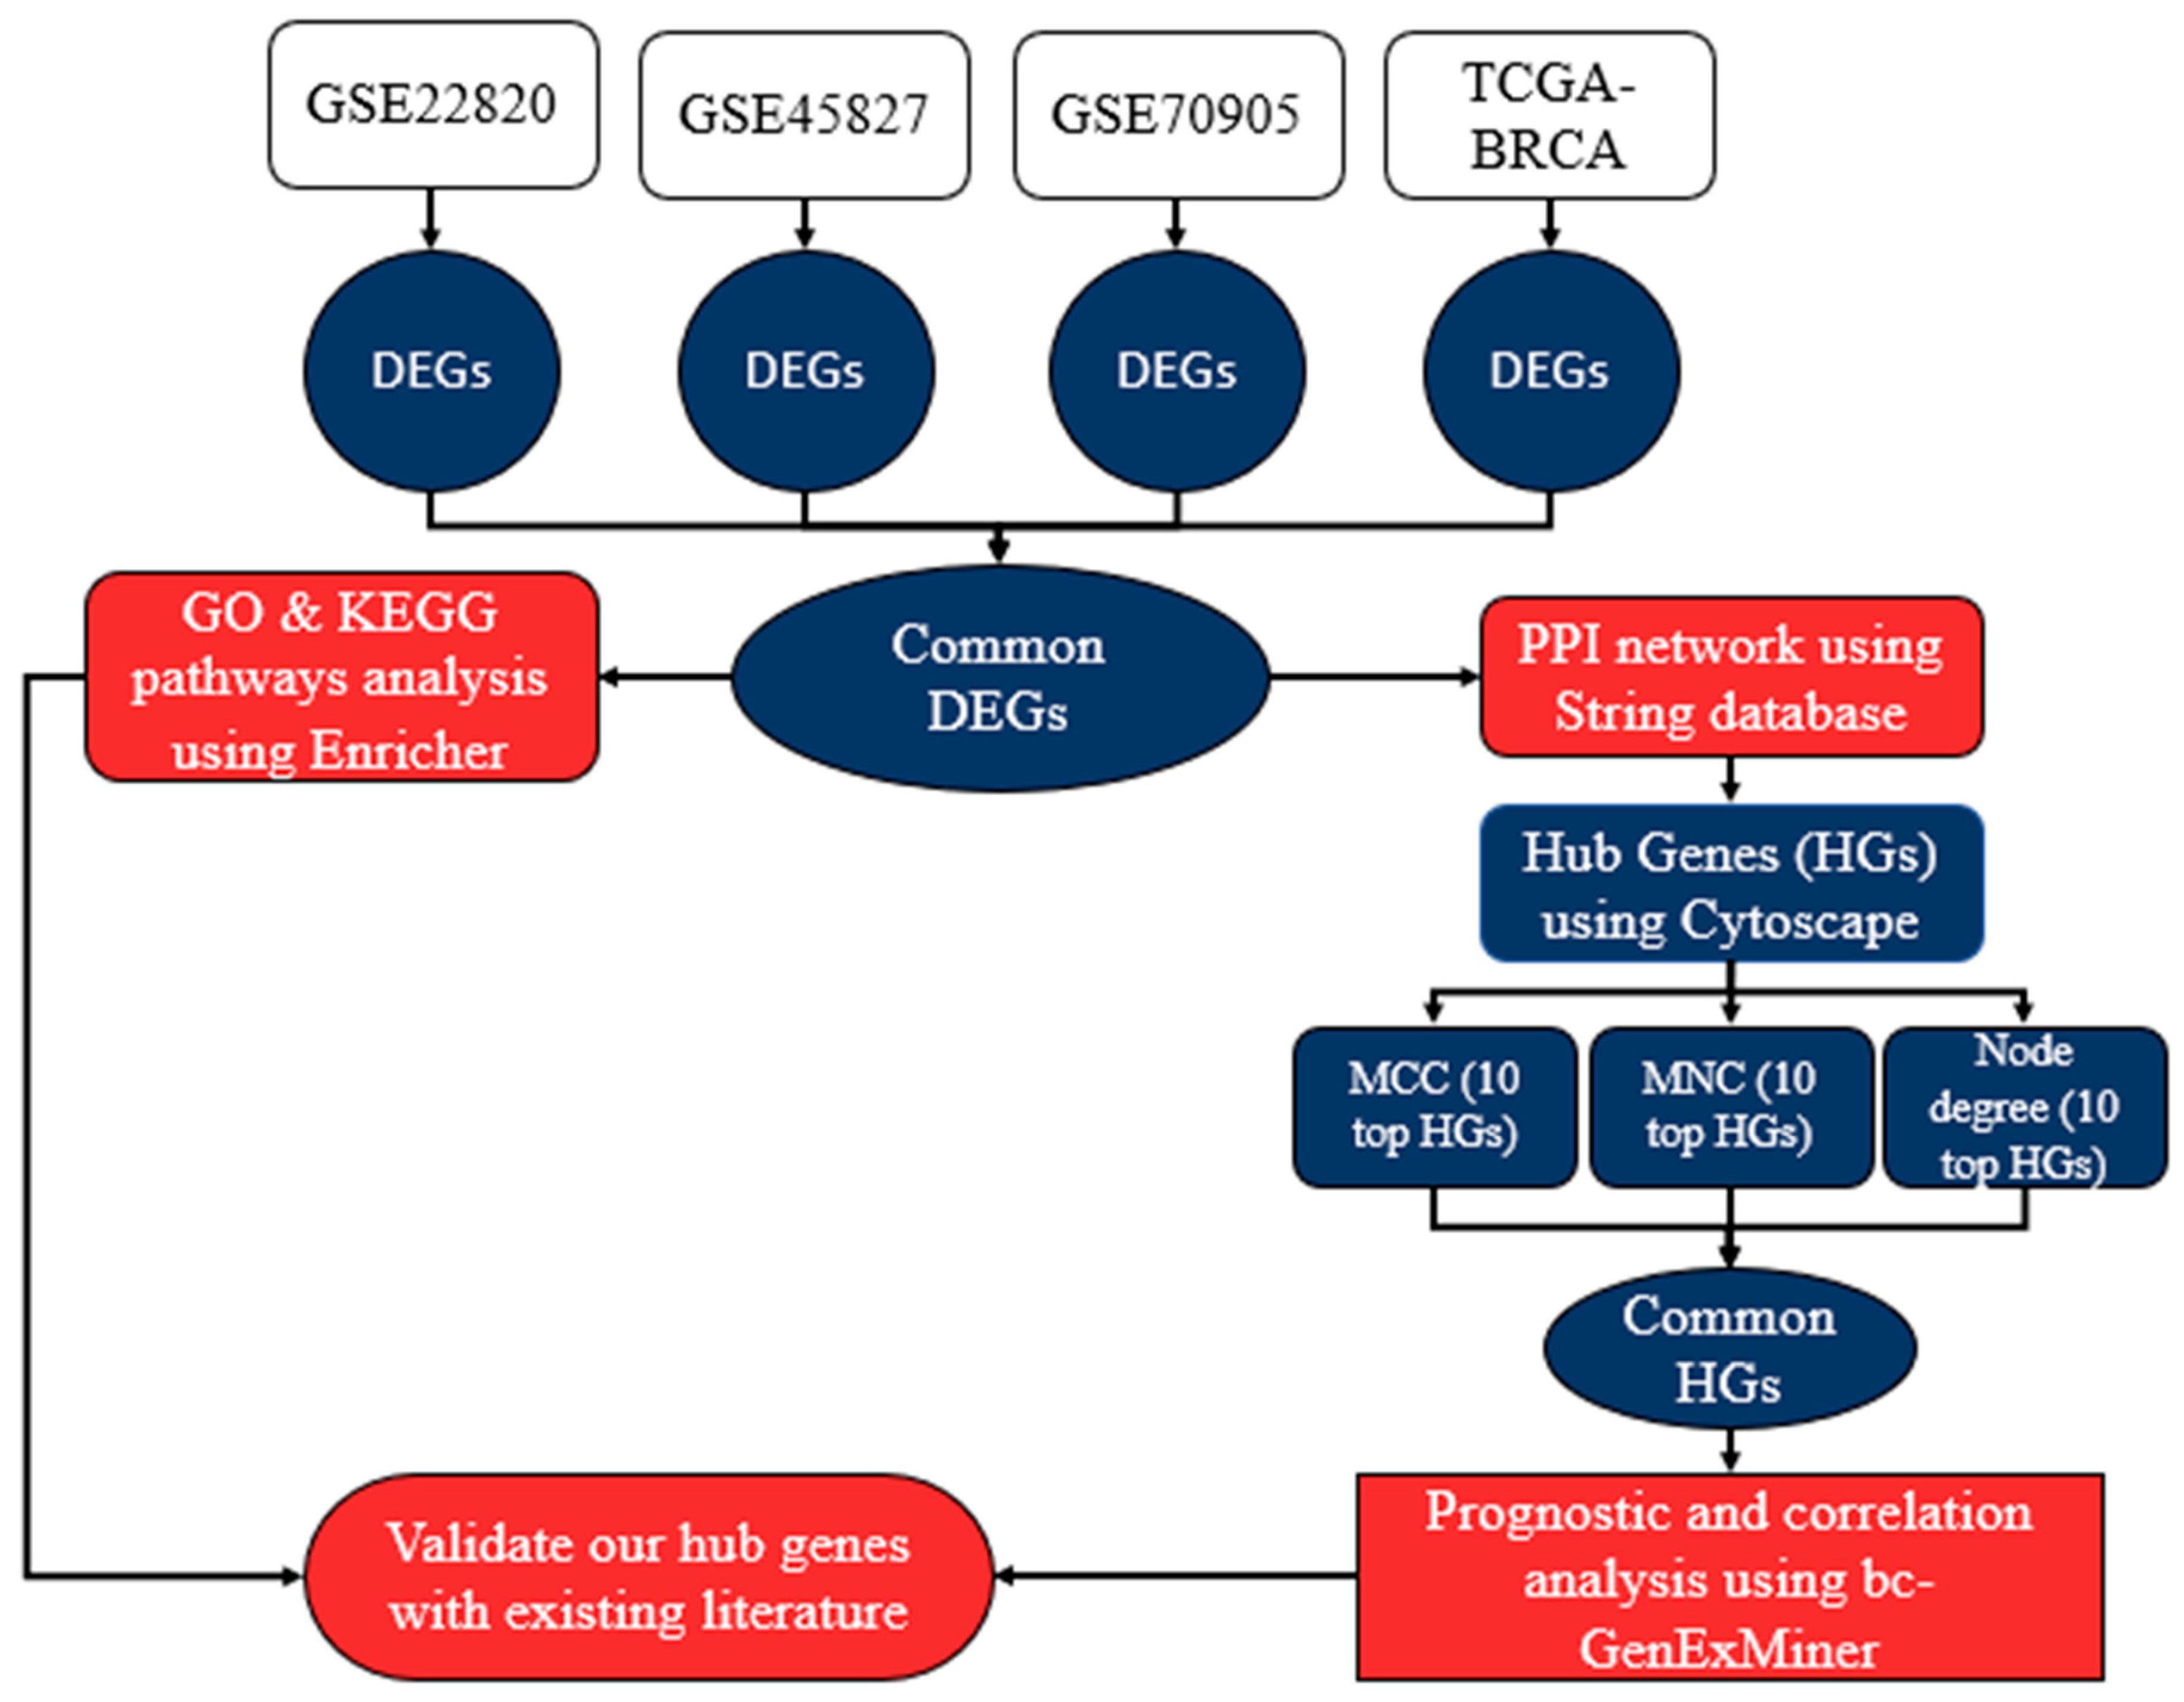
2. Material and Methods

Datasets

In this study, three different BC microarray gene expression data sets are downloaded from gene expression omnibus (GEO) using R statistical software via the GEOquery package [15]. Additionally, the TCGA-BRCA RNASeq gene expression data is downloaded from Pan-Cancer Atlas using the TCGAbiolinks package in R [16]. The microarray datasets were obtained according to the accession numbers GSE22820, GSE45827, and GSE70905. GSE22820 contains 41,000 genes in 186 samples. In contrast, GSE45827 consists of 29,873 genes in 141 samples. GSE70905 contains 45,015 genes on 94 paired samples. Only the normal and tumor samples are selected from all the datasets. The BC microarray dataset was log2-transformed and normalized using normalizeBetweenArrays to ensure consistency between arrays. The TCGA-BRCA dataset contains 1208 clinical samples, and in each sample there are 19,948 genes. Since the number of genes is very large, a pre-processing step is used to reduce the number of genes in order to minimize the noise affecting the process of extracting the DEGs. The common genes between the four lists of DEGs are selected. The common genes were then used for further analysis using Cytoscape software for constructing and visualizing PPI networks [17,18]. Moreover, Cytoscape is used to obtain hub genes that might help in BC individual prognosis and determine the best therapy strategies. In addition, the common genes are used in constructing pathways and in GO analyses using the Enricher tool. Table 1 gives the details of all the datasets that are used in this study. The overall research process is depicted in Figure 1.

3. Differential Gene Expression Analysis

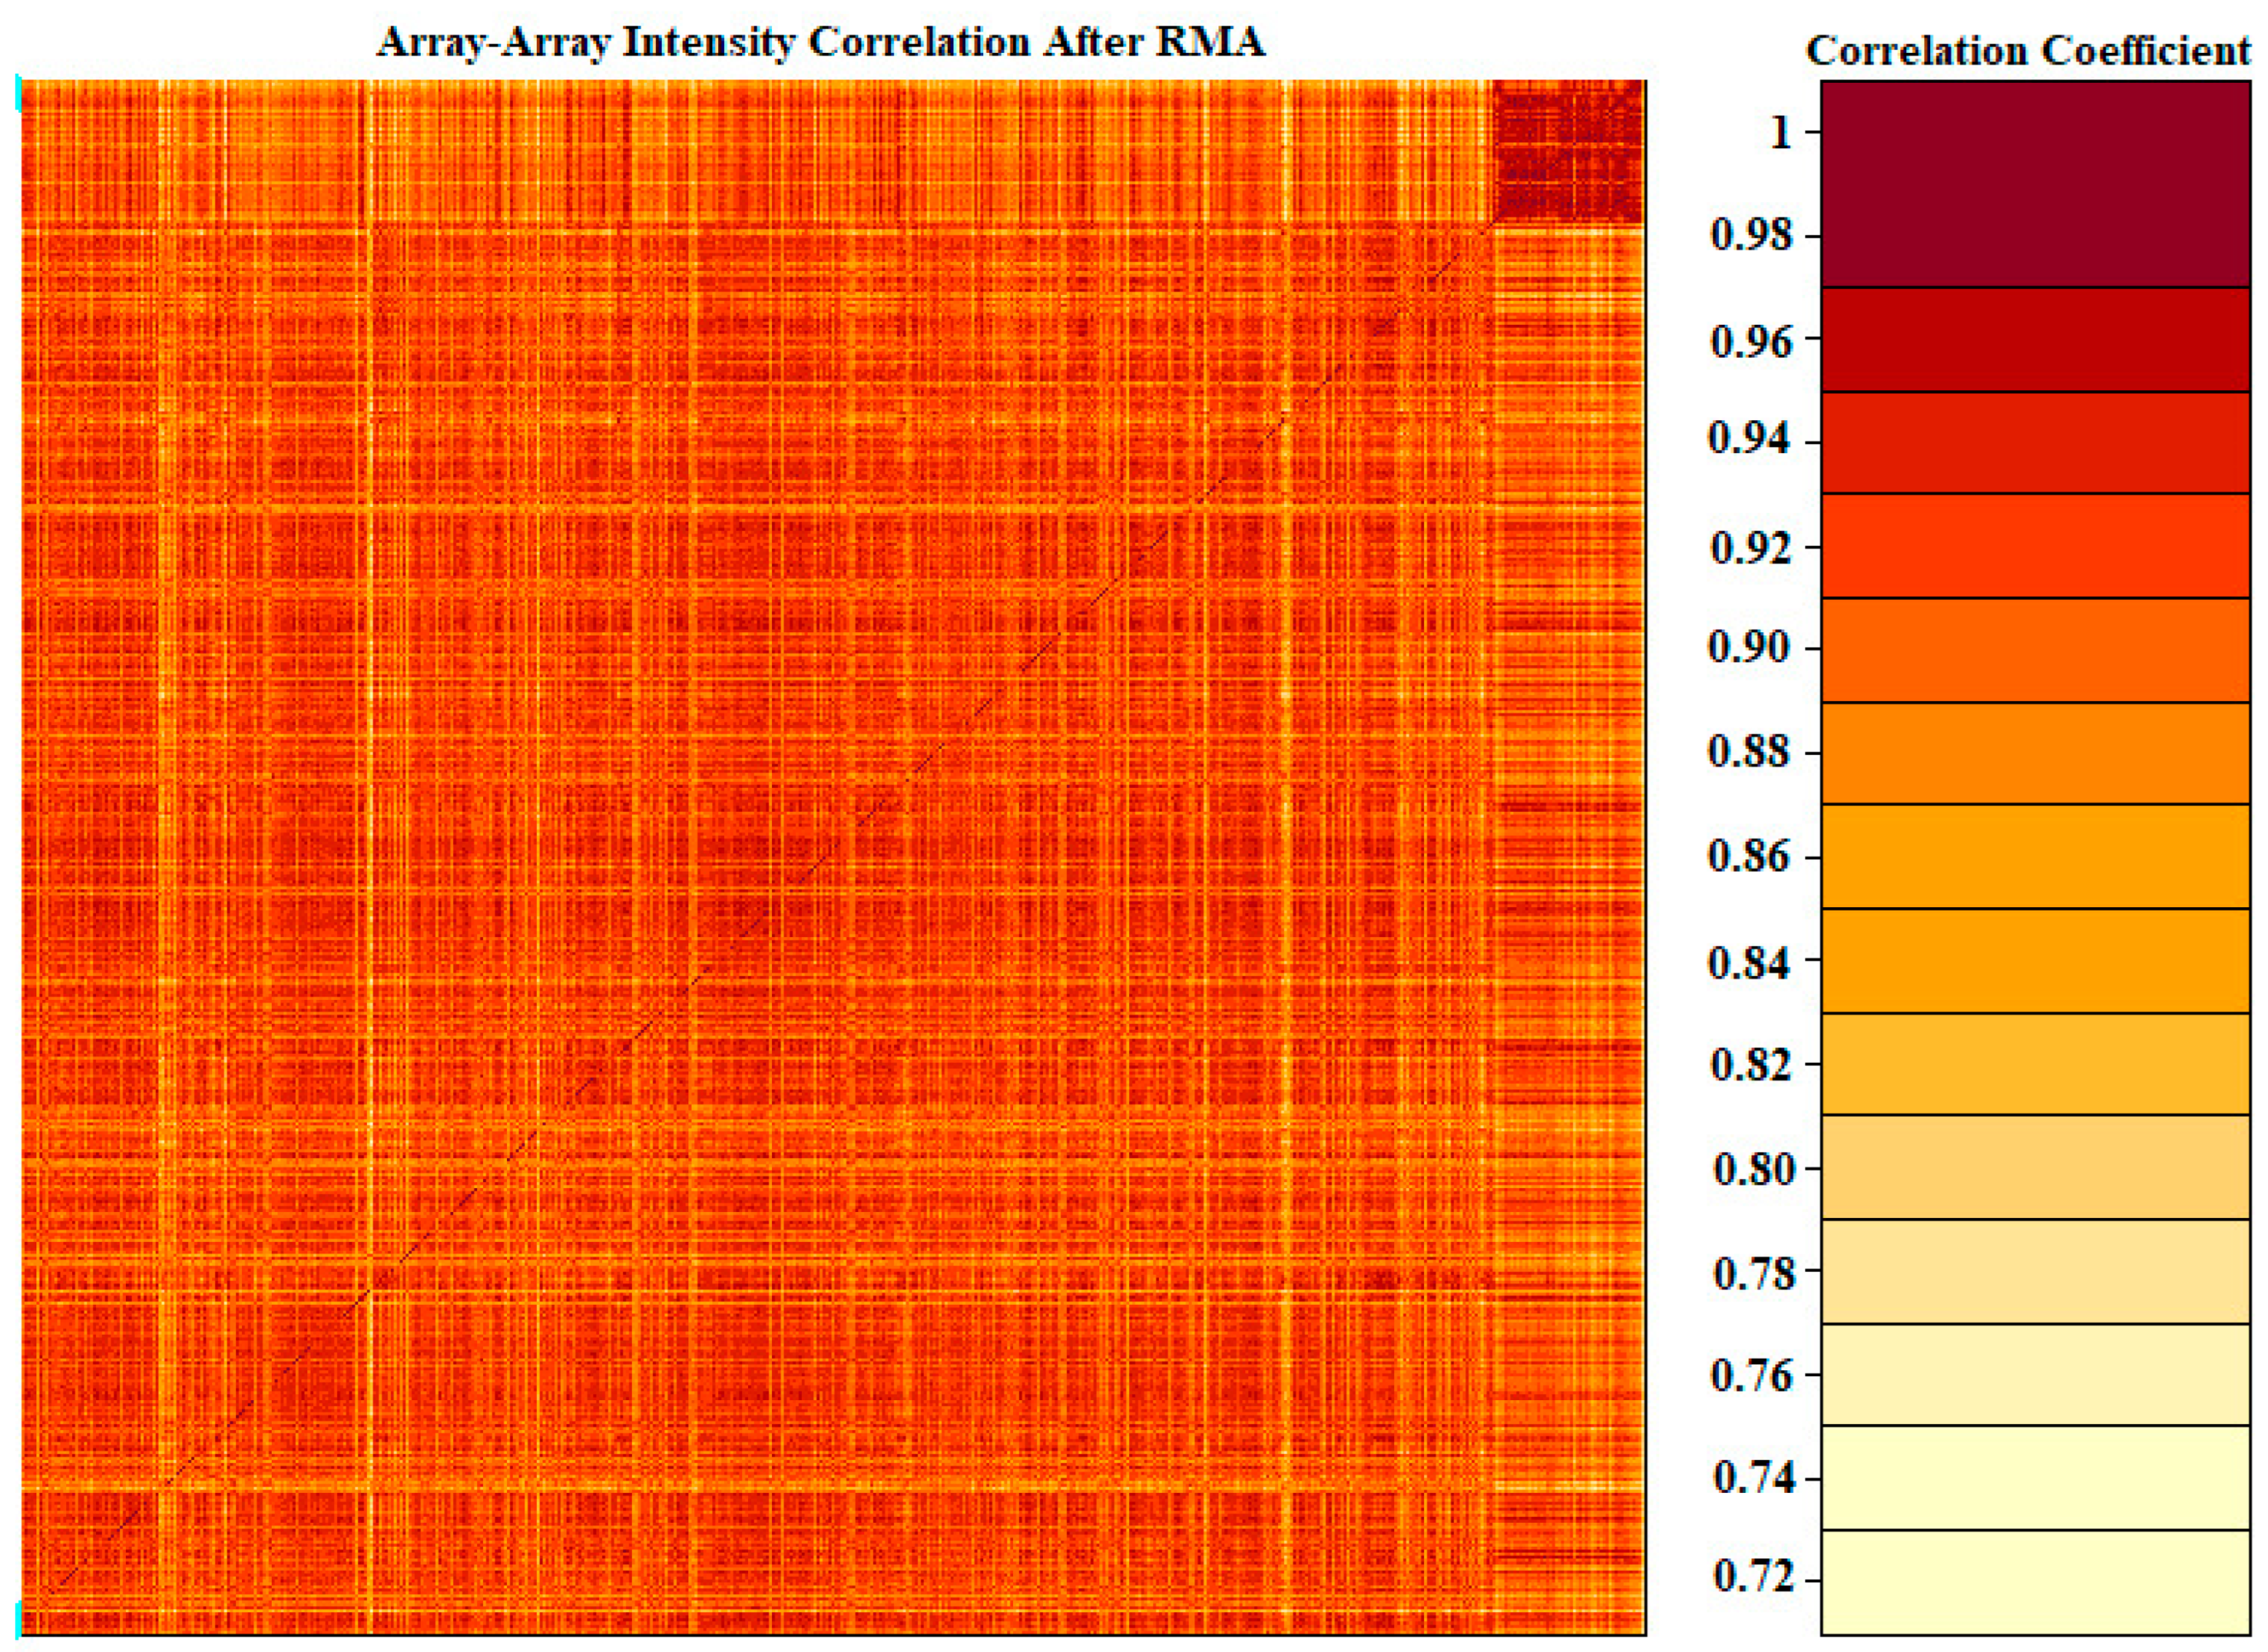
3.1. Microarray Analysis

Class comparison is performed using linear models for the microarray data using the limma package in R [11,23]. This package performs differential expression using a gene expression data matrix where the columns denote the samples, and the rows indicate the genes [24]. It aims to discover the features (genes) that are differentially expressed. Limma fits and performs linear models, such as linear regression, multiple linear regression, and analysis of variance. The linear model along with the empirical Bayes technique was fitted using the lmFit function from the limma package to determine the differentially expressed genes in the BC samples relative to normal [24]. Then, the “Empirical Bayes” model is fitted. This model borrows information across the genes using the eBayes function in R to calculate moderated t-statistics that determine the statistical significance value (p-value) for each gene [25]. A p-value threshold was used by different researchers to identify the genes that can discriminate between different classes [26]. The significant threshold value of 0.01 was used in this study to identify the genes that discriminate between the normal and the tumor cases 6089, 14293, and 16432 DEGs are obtained from GSE2280, GSE45827, and GSE70905 datasets, respectively.

3.2. RNASeq Analysis

In the pre-processing of the RNASeq data, the array-array intensity correlation (AAIC) is used to determine the correlation between the samples. In AAIC, the correlation is based on the Spearman correlation [27]. The AAIC is a symmetric matrix, and its visualization is depicted in Figure 2. The strength of the correlation is represented by the colours, where a dark colour indicates a strong correlation, and a light colour indicates a weak correlation. From the AAIC, the samples with low correlation are pinpointed (using a threshold value of 0.6, the samples with a correlation less than this threshold value are determined to have low correlation) and removed [28]. To ensure that we can correctly infer the expression level from the BC gene expression data without bias in the expression measures, a normalization process is applied using TCGAanalyze_Normalization [29,30,31,32]. TCGAanalyze_Normalization is a function in the TCGAbiolinks library and has a suite of methods. The GC-content method is used to determine the part of the nucleotides in the nucleic acid strand with either guanine (G) or cytosine (C). This way, we could remove the strong GC-content bias or the GC-richer genes that tend to be truly differentially expressed (DE) [29]. Finally, the gene expression data is filtered using a threshold value of 0.25 to determine the mean values across all samples that should be selected (these are samples that have a mean of expression level higher than 0.25). After the pre-processing steps, 1208 samples (113 negative and 1095 positive), each with 14899 genes, are obtained. DEGs analysis is performed using the TCGAanalyze_DEA function, which revealed 3676 DEGs.
The list of DEGs is used from the microarray and RNASeq datasets to find common DEGs (n = 540). A complete list of the common 540 DEGs is provided in a Supplementary File (Table S1).

3.3. Gene Ontology (GO) and Gene List Pathway Enrichment Analysis

All cells or organisms that possess a clearly defined nucleus share the biological functions that are specified by a large fraction of genes. Shared proteins in one organism can be transferred to other organisms if the biological role of such a shared protein is known. Gene Ontology Consortium can help produce dynamic and controlled vocabulary that can be applied to all eukaryotes, regardless of whether the protein role in cells is changing or accumulating [33]. GO determines the biological process, molecular function, and cellular location of an organism’s genes. In addition, GO is constructed from two units: the GO annotation and the ontology itself. The structure of the ontology is a tree-like hierarchical structure of concepts known as GO terms. The list of all annotated genes that are linked to ontology terms that describe these genes is known as GO annotation [34].
Genes enrichment is computed to identify the gene functionality that is associated with different pathways and transcription factors which regulate the expression of other genes. The list of common genes is used as input for computing enrichment, with existing lists created from prior knowledge organized into gene-set libraries. To perform this analysis, the enrichR web server (https://maayanlab.cloud/Enrichr/, accessed on 14 July 2022) is used. This web server is an open-source web-based gene enrichment analysis tool developed in the Ma’ayan lab by a group of researchers. It integrates the results from multiple gene-set libraries [35]. The KEGG pathway database is used to recognise the list of pathways that are related to the common DEGs list. Moreover, the Fisher’s exact test p-value is set to be < 0.05 and a high combined score as a threshold for identifying the significant pathways.

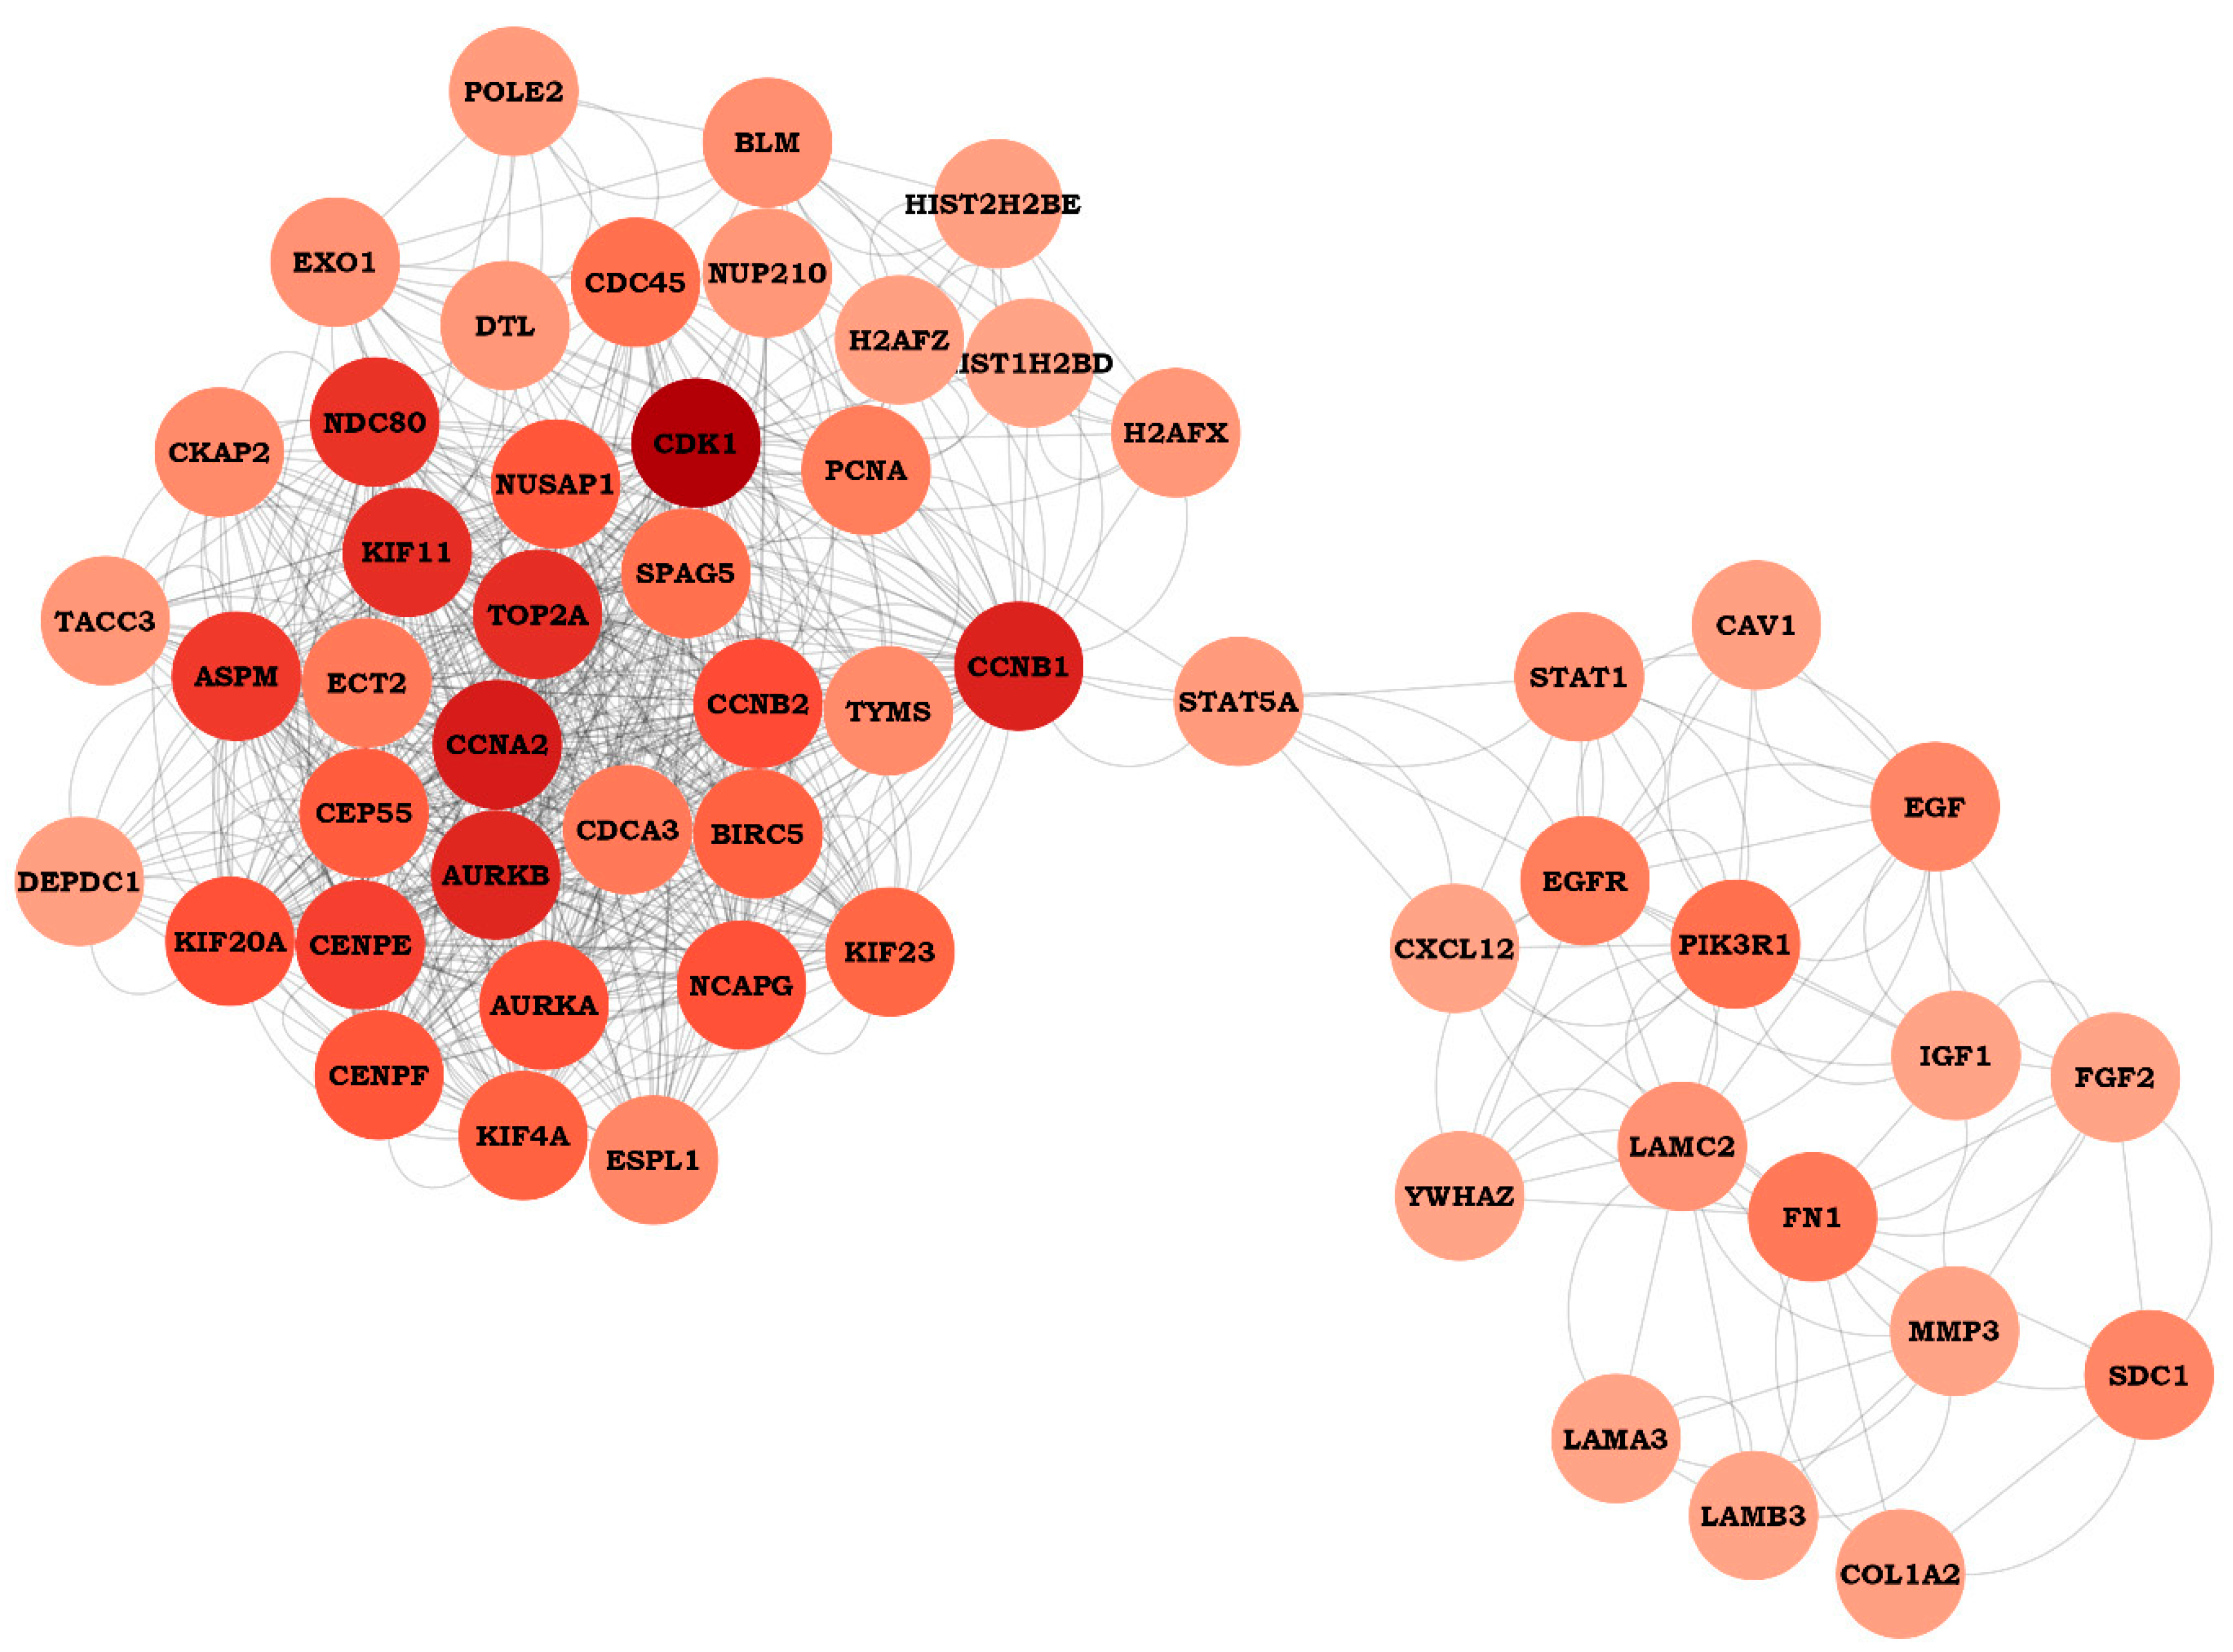
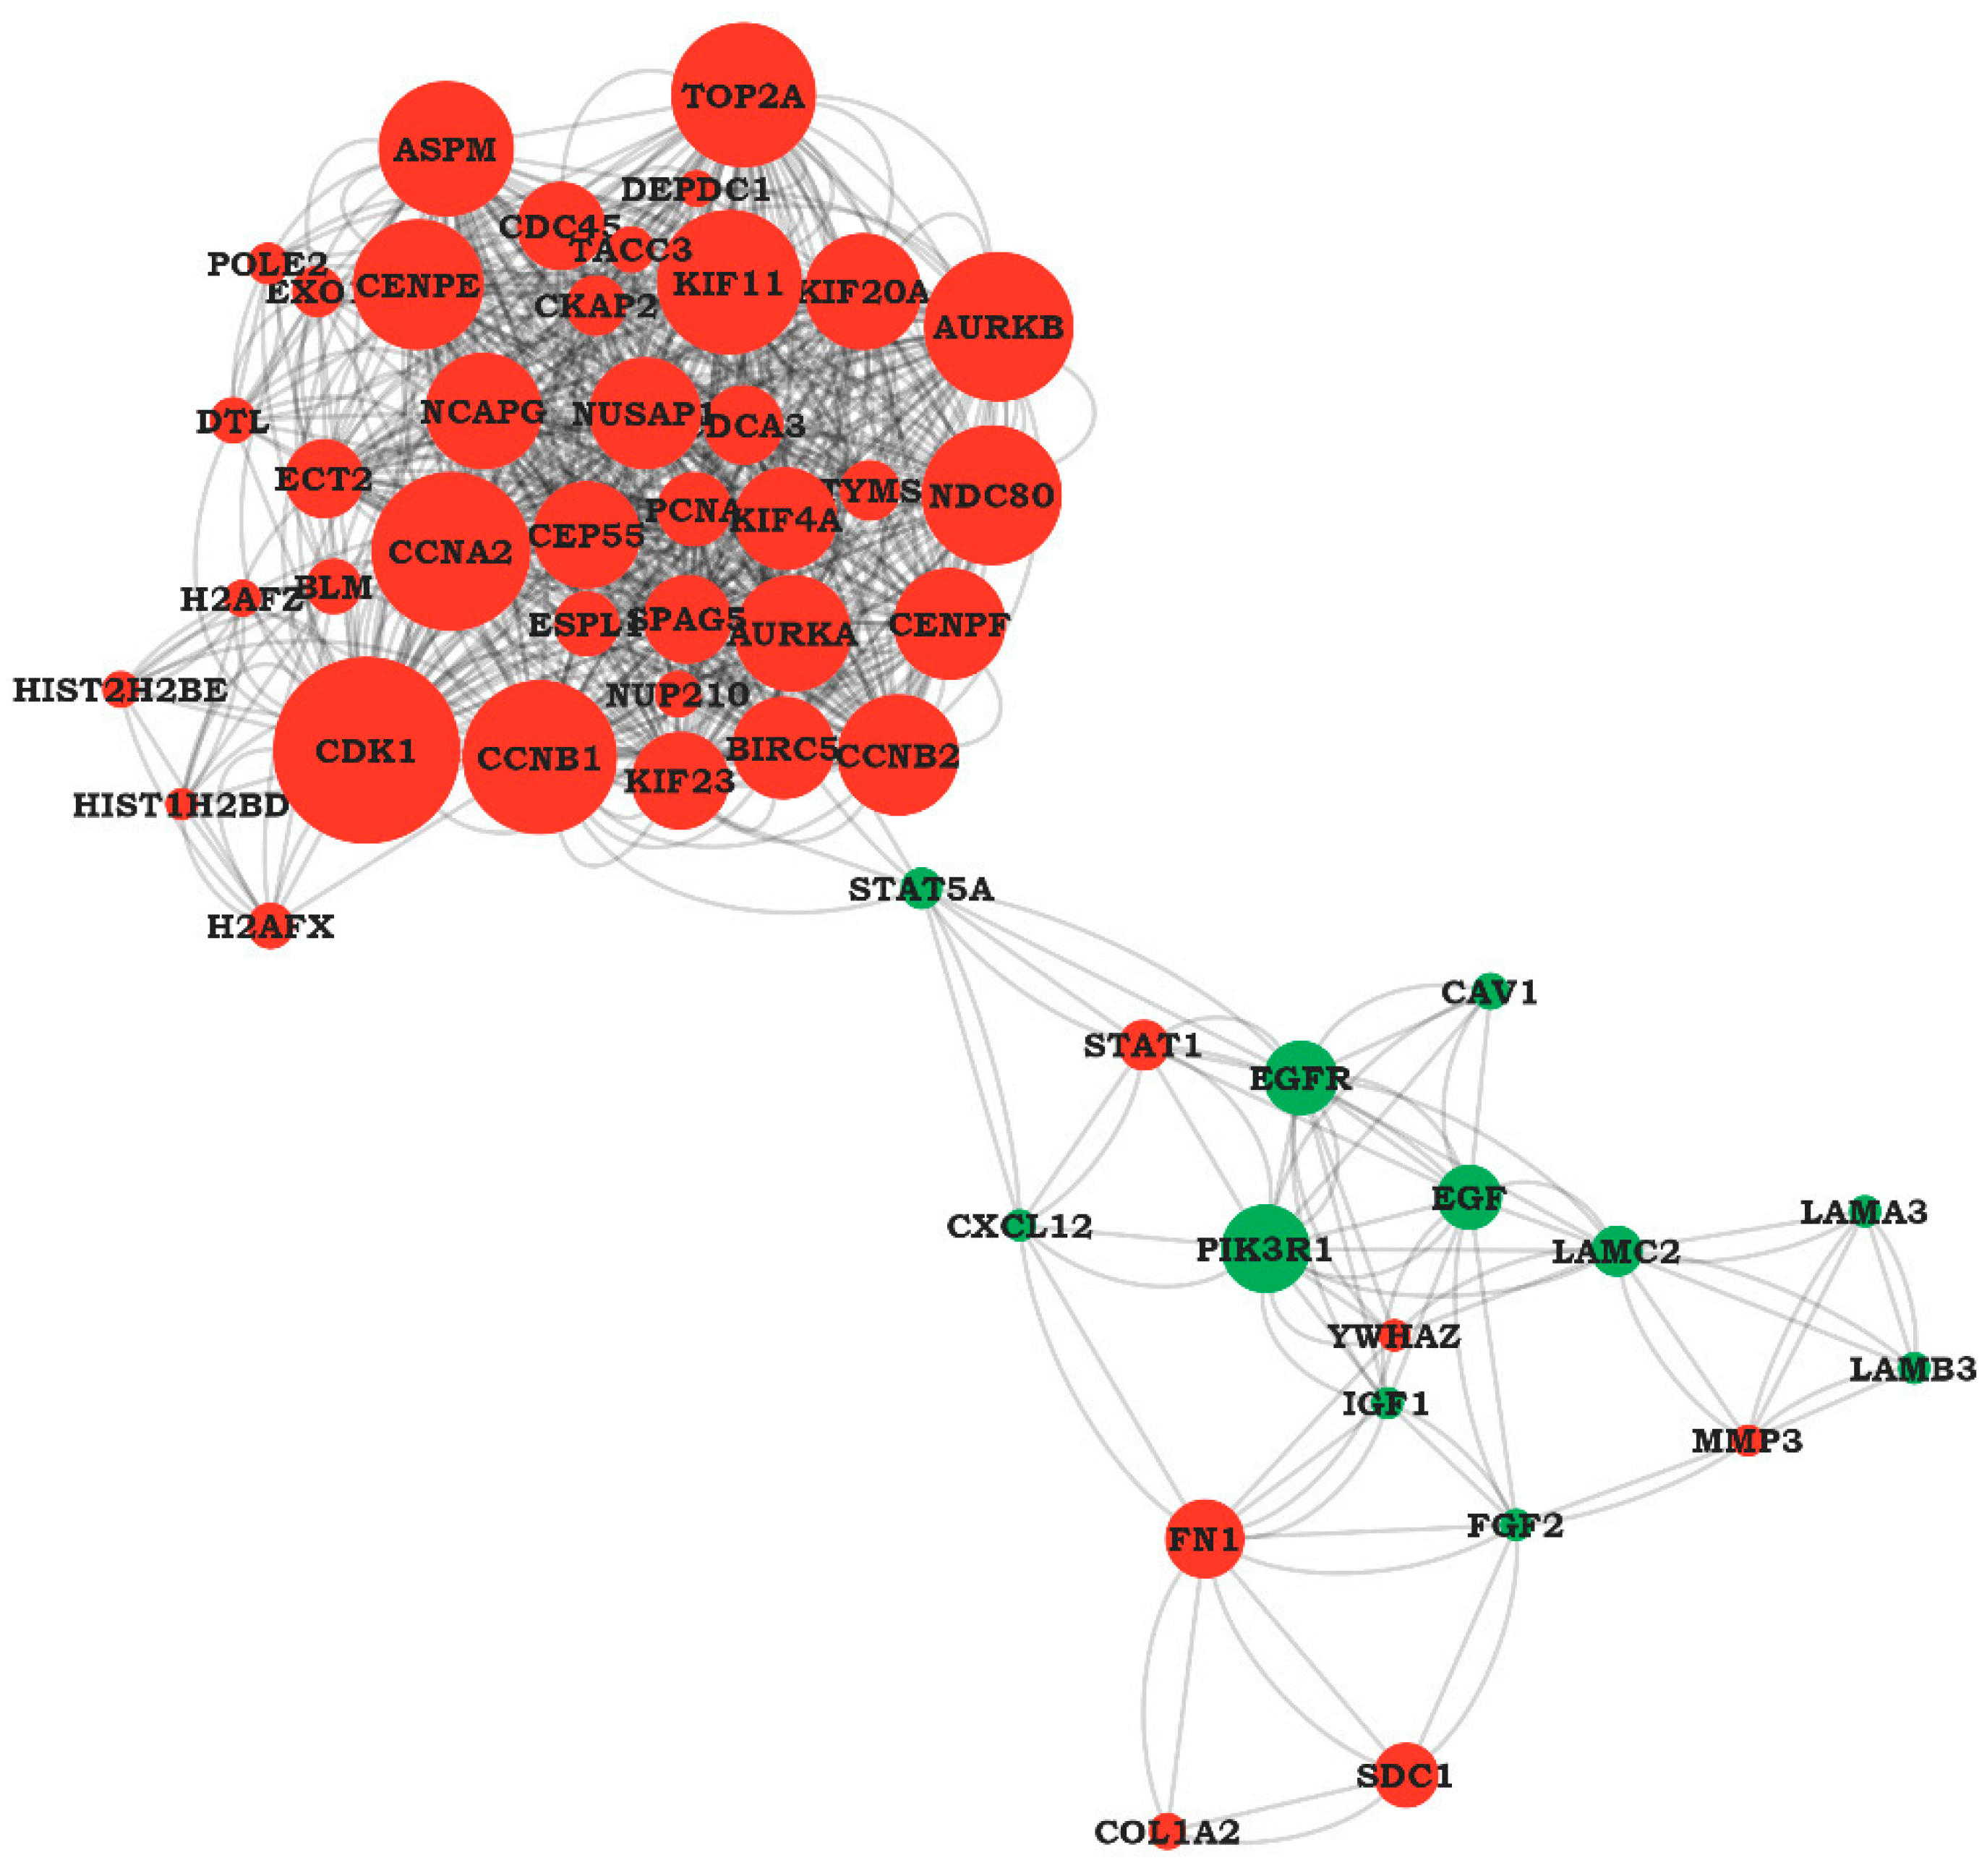
3.4. Protein-Protein Interaction (PPI) Network Analysis

The STRING (v11.5) biological database (https://string-db.org/, accessed on 14 July 2022) is used for the known and predicted PPI. The STRING database contains information from various sources, and it can be used to predict the functional interactions of proteins [36,37]. STRING is applied to find possible interactions between the DEGs. To construct the PPI, the required interaction score is set to the highest confidence (0.900), the false discovery rate (FDR) to 5%, and the organism to Homo sapiens. In addition, active interaction scores, including text mining, experiments, databases, co-expression, neighborhood, gene fusion, and co-occurrence were applied. Moreover, Cytoscape (v3.9.1) software was used to analyse the PPIs further and display their network [17]. The analysis of the PPI resulted in a complex network to be visualized or interpreted. Therefore, a zero-order interaction network was constructed with 538 nodes and 691 edges to avoid the “hairball effect” and to make the network interaction properly visualized. The NetworkAnalyzer (v4.4.8) software is used to calculate the network topological characteristics, such as degree distribution, clustering coefficients, and centrality, among others. The degree of a node indicates the number of connections with other nodes, while the betweenness centrality explains the number of shortest paths between a node and other nodes with the highest betweenness.

4. Results

4.1. The GO Term Analysis of the Common DEGs

GO enrichment and KEGG pathway analyses were performed to explore the possible biological function of the common list of DEGs. The enrichment analysis of GO terms was performed according to three categories: biological process, molecular function, and cellular component. This analysis helps classify the DEGs based on their functional cluster or GO groups. The genes were ranked according to the p-value calculated using Fisher’s exact test, which indicates the probability of each gene to be in one of the GO term categories. The enriched GO terms in the biological process category revealed that our DEGs are significantly enriched and related to extracellular structure organization (GO:0043062, p-value: 1.11266 × 10⁻¹²), external encapsulating structure organization (GO:0045229, p-value: 1.25244 × 10⁻¹²), microtubule cytoskeleton organization involved in mitosis (GO:1902850, p-value: 4.23453 × 10⁻¹²), extracellular matrix organization (GO:0030198, p-value: 3.93235 × 10⁻¹¹), positive regulation of the cell cycle process (GO:0090068, p-value: 1.64727 × 10⁻⁹), regulation of cell migration (GO:0030334, p-value: 1.88723 × 10⁻⁹), mitotic spindle organization (GO:0007052, p-value: 9.2914 × 10⁻⁹), endoderm formation (GO:0001706, p-value: 2.56083 × 10⁻⁸), mitotic cytokinesis (GO:0000281, p-value: 5.77801 × 10⁻⁸), and positive regulation of protein kinase B signaling (GO:0051897, p-value: 7.59979 × 10⁻⁸) (see Table 2).
We investigated the enriched GO term results in the molecular function category, which indicated that our DEGs are significantly enriched and associated with protein homodimerization activity (GO: 0042803, p-value: 1.82 × 10⁻⁶), platelet-derived growth factor binding (GO:0048407, p-value: 5.69 × 10⁻⁶), microtubule motor activity (GO:0003777, p-value: 1.75 × 10⁻⁵), microtubule binding (GO:0008017, p-value: 1.89 × 10⁻⁵), tubulin binding (GO:0015631, p-value: 3.43 × 10⁻⁵), motor activity (GO:0003774, p-value: 6.72 × 10⁻⁵), actin binding (GO:0003779, p-value: 9.58 × 10⁻⁵), receptor ligand activity (GO:0048018, p-value: 9.99 × 10⁻⁵), cell-cell adhesion mediator activity (GO:0098632, p-value: 1.20 × 10⁻⁴), and metalloendopeptidase activity (GO:0004222, p-value: 3.63 × 10⁻⁴) (see Table 3).
We also investigated the enriched GO term results in the cellular components category, which were found to be highly significant and related to our DEGs. These cellular components are collagen-containing extracellular matrix (GO:0062023, p-value: 4.04 × 10⁻¹²), microtubule (GO:0005874, p-value: 5.27 × 10⁻⁷), spindle (GO:0005819, p-value: 1.20 × 10⁻⁶), polymeric cytoskeletal fibre (GO:0099513, p-value: 1.93 × 10⁻⁶), cell-substrate junction (GO:0030055, p-value: 3.54 × 10⁻⁶), spindle microtubule (GO:0005876, p-value: 4.96 × 10⁻⁶), focal adhesion (GO:0005925, p-value: 7.40 × 10⁻⁶), cell-cell junction (GO:0005911, p-value: 1.54 × 10⁻⁴), platelet alpha granule (GO:0031091, p-value: 1.56 × 10⁻⁴), and actin-based cell projection (GO:0098858, p-value: 3.98 × 10⁻⁴) (see Table 4).

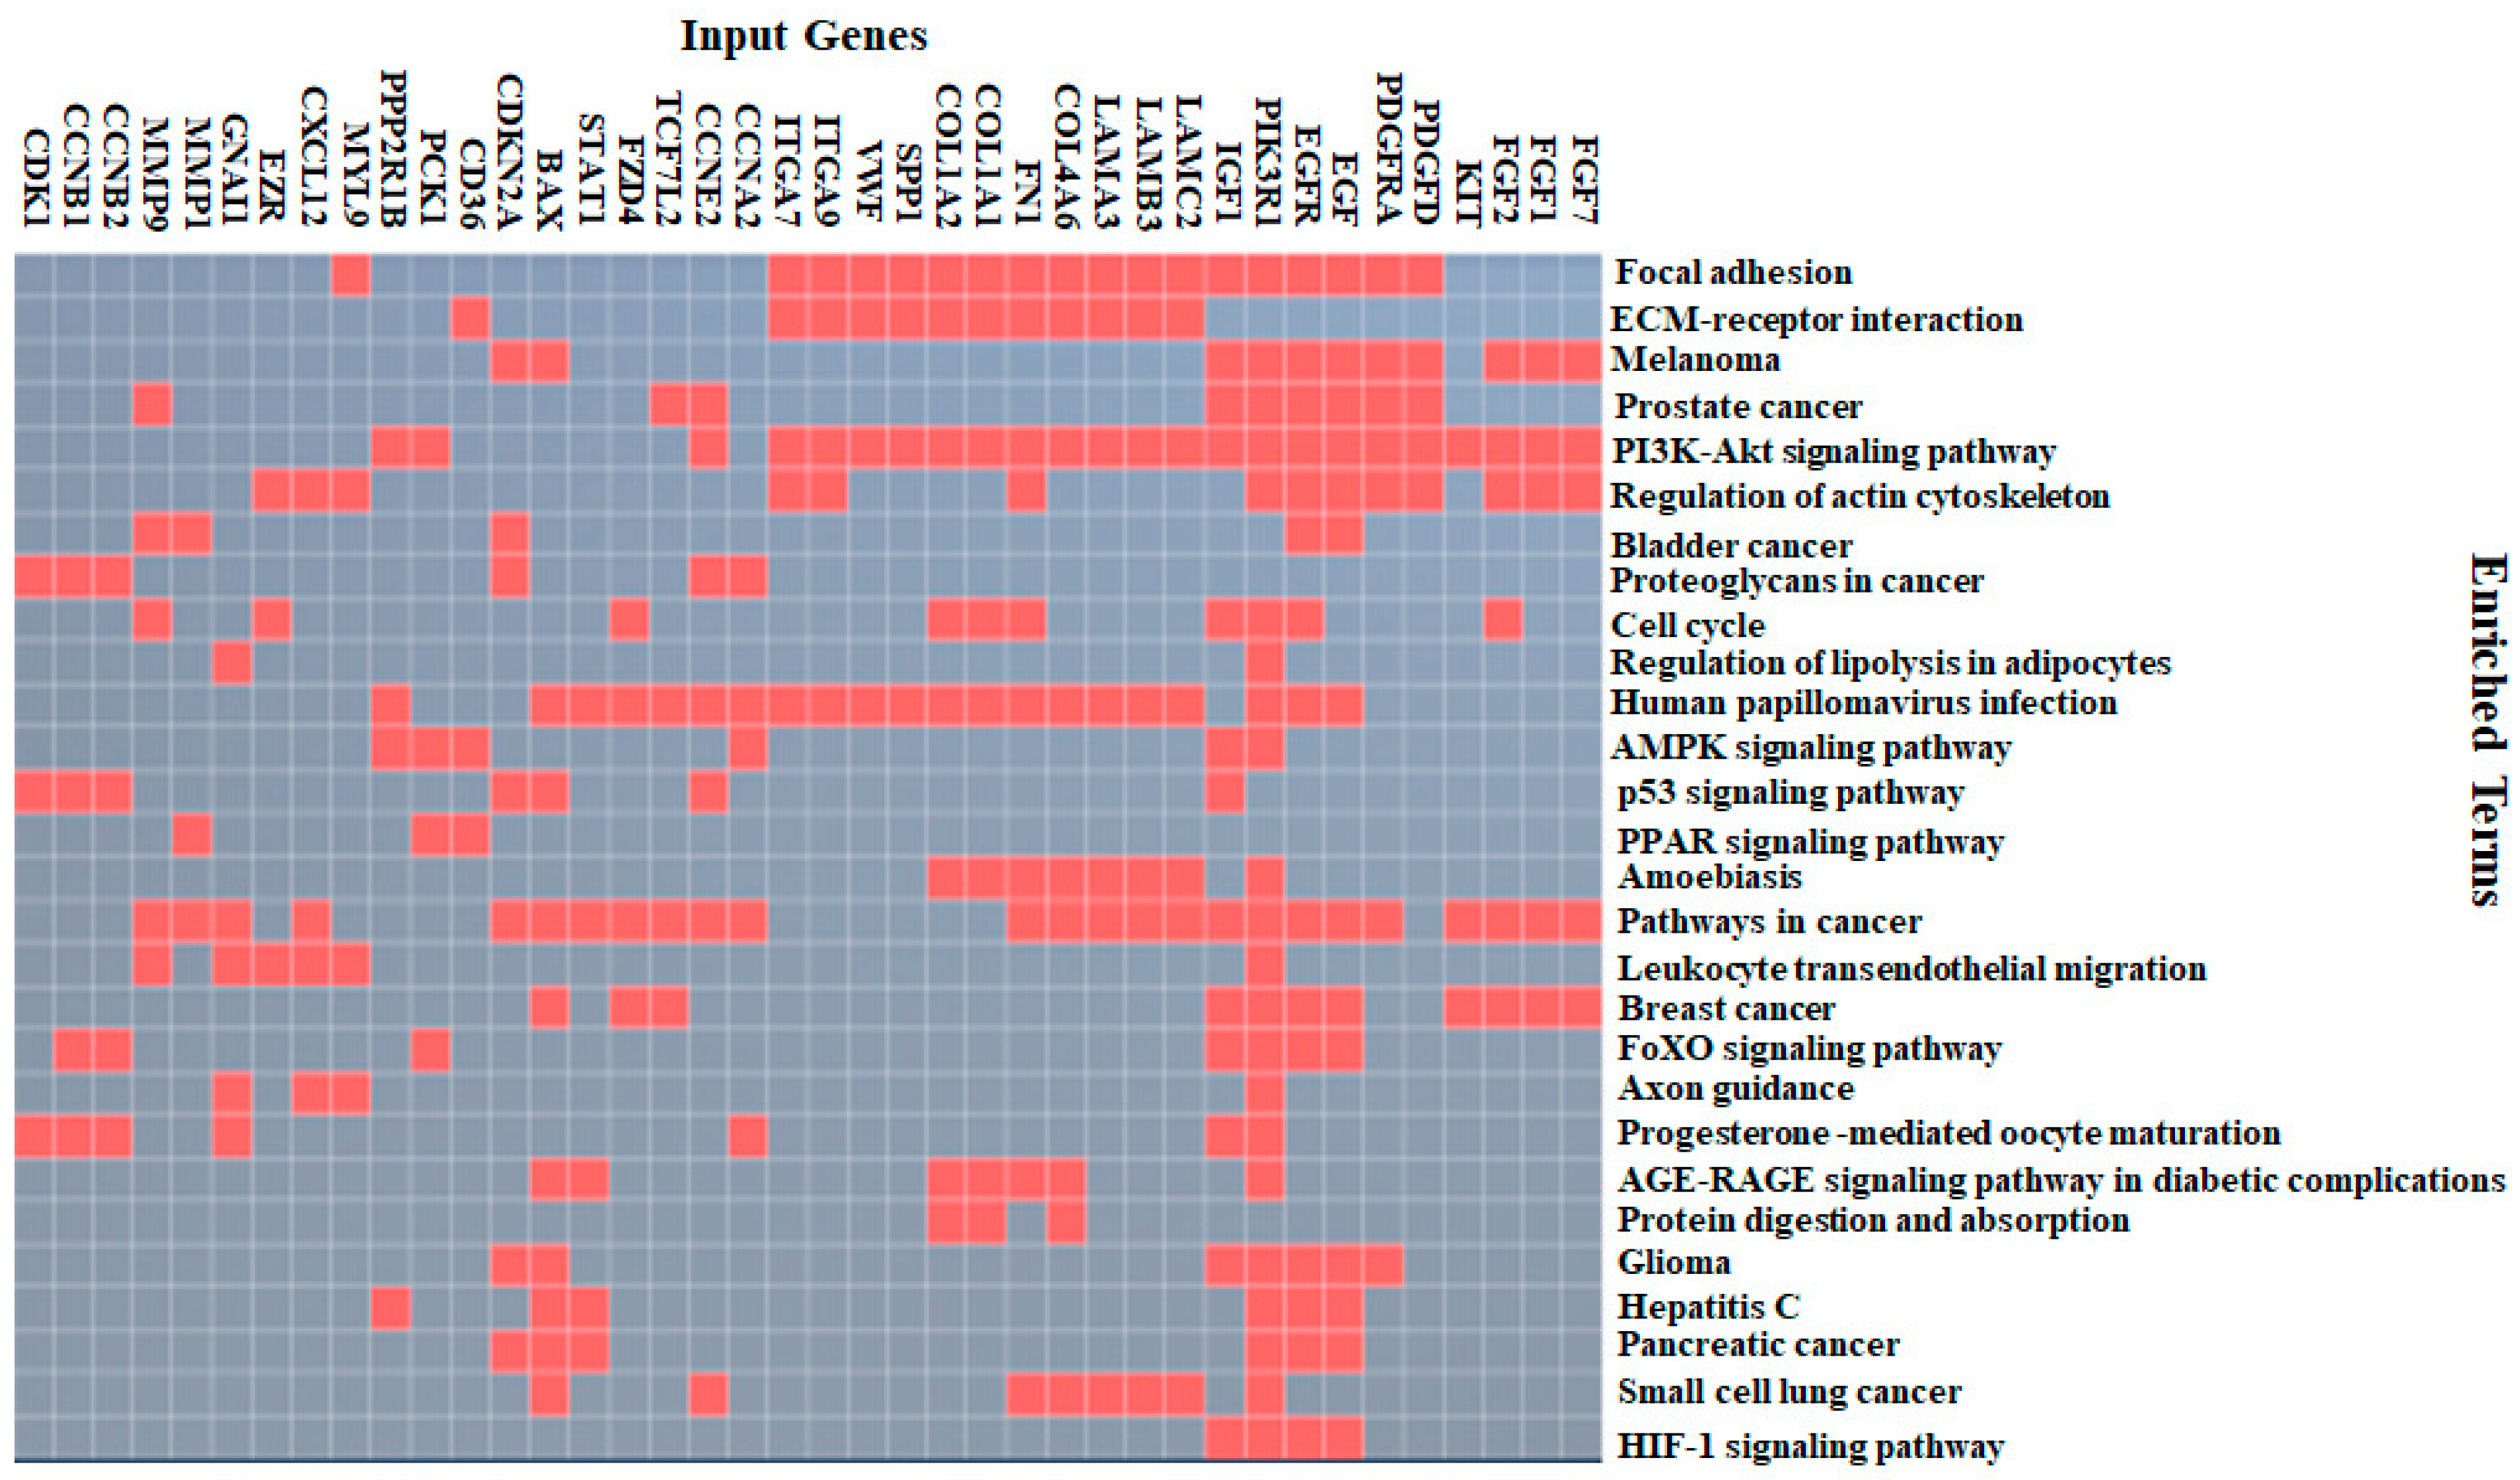
4.2. KEGG Pathway Enrichment Analysis for the DEGs

The R package Enrichr was employed to discover cancer pathways for the significant DEGs. EGFR and PIK3R1 were involved in most of the pathways, and they can be further investigated for biological discoveries. Moreover, by ranking the pathway terms using a combined score, we noticed that focal adhesion, ECM-receptor interaction, melanoma, and prostate cancer contains many of our genes (see Figure 3).

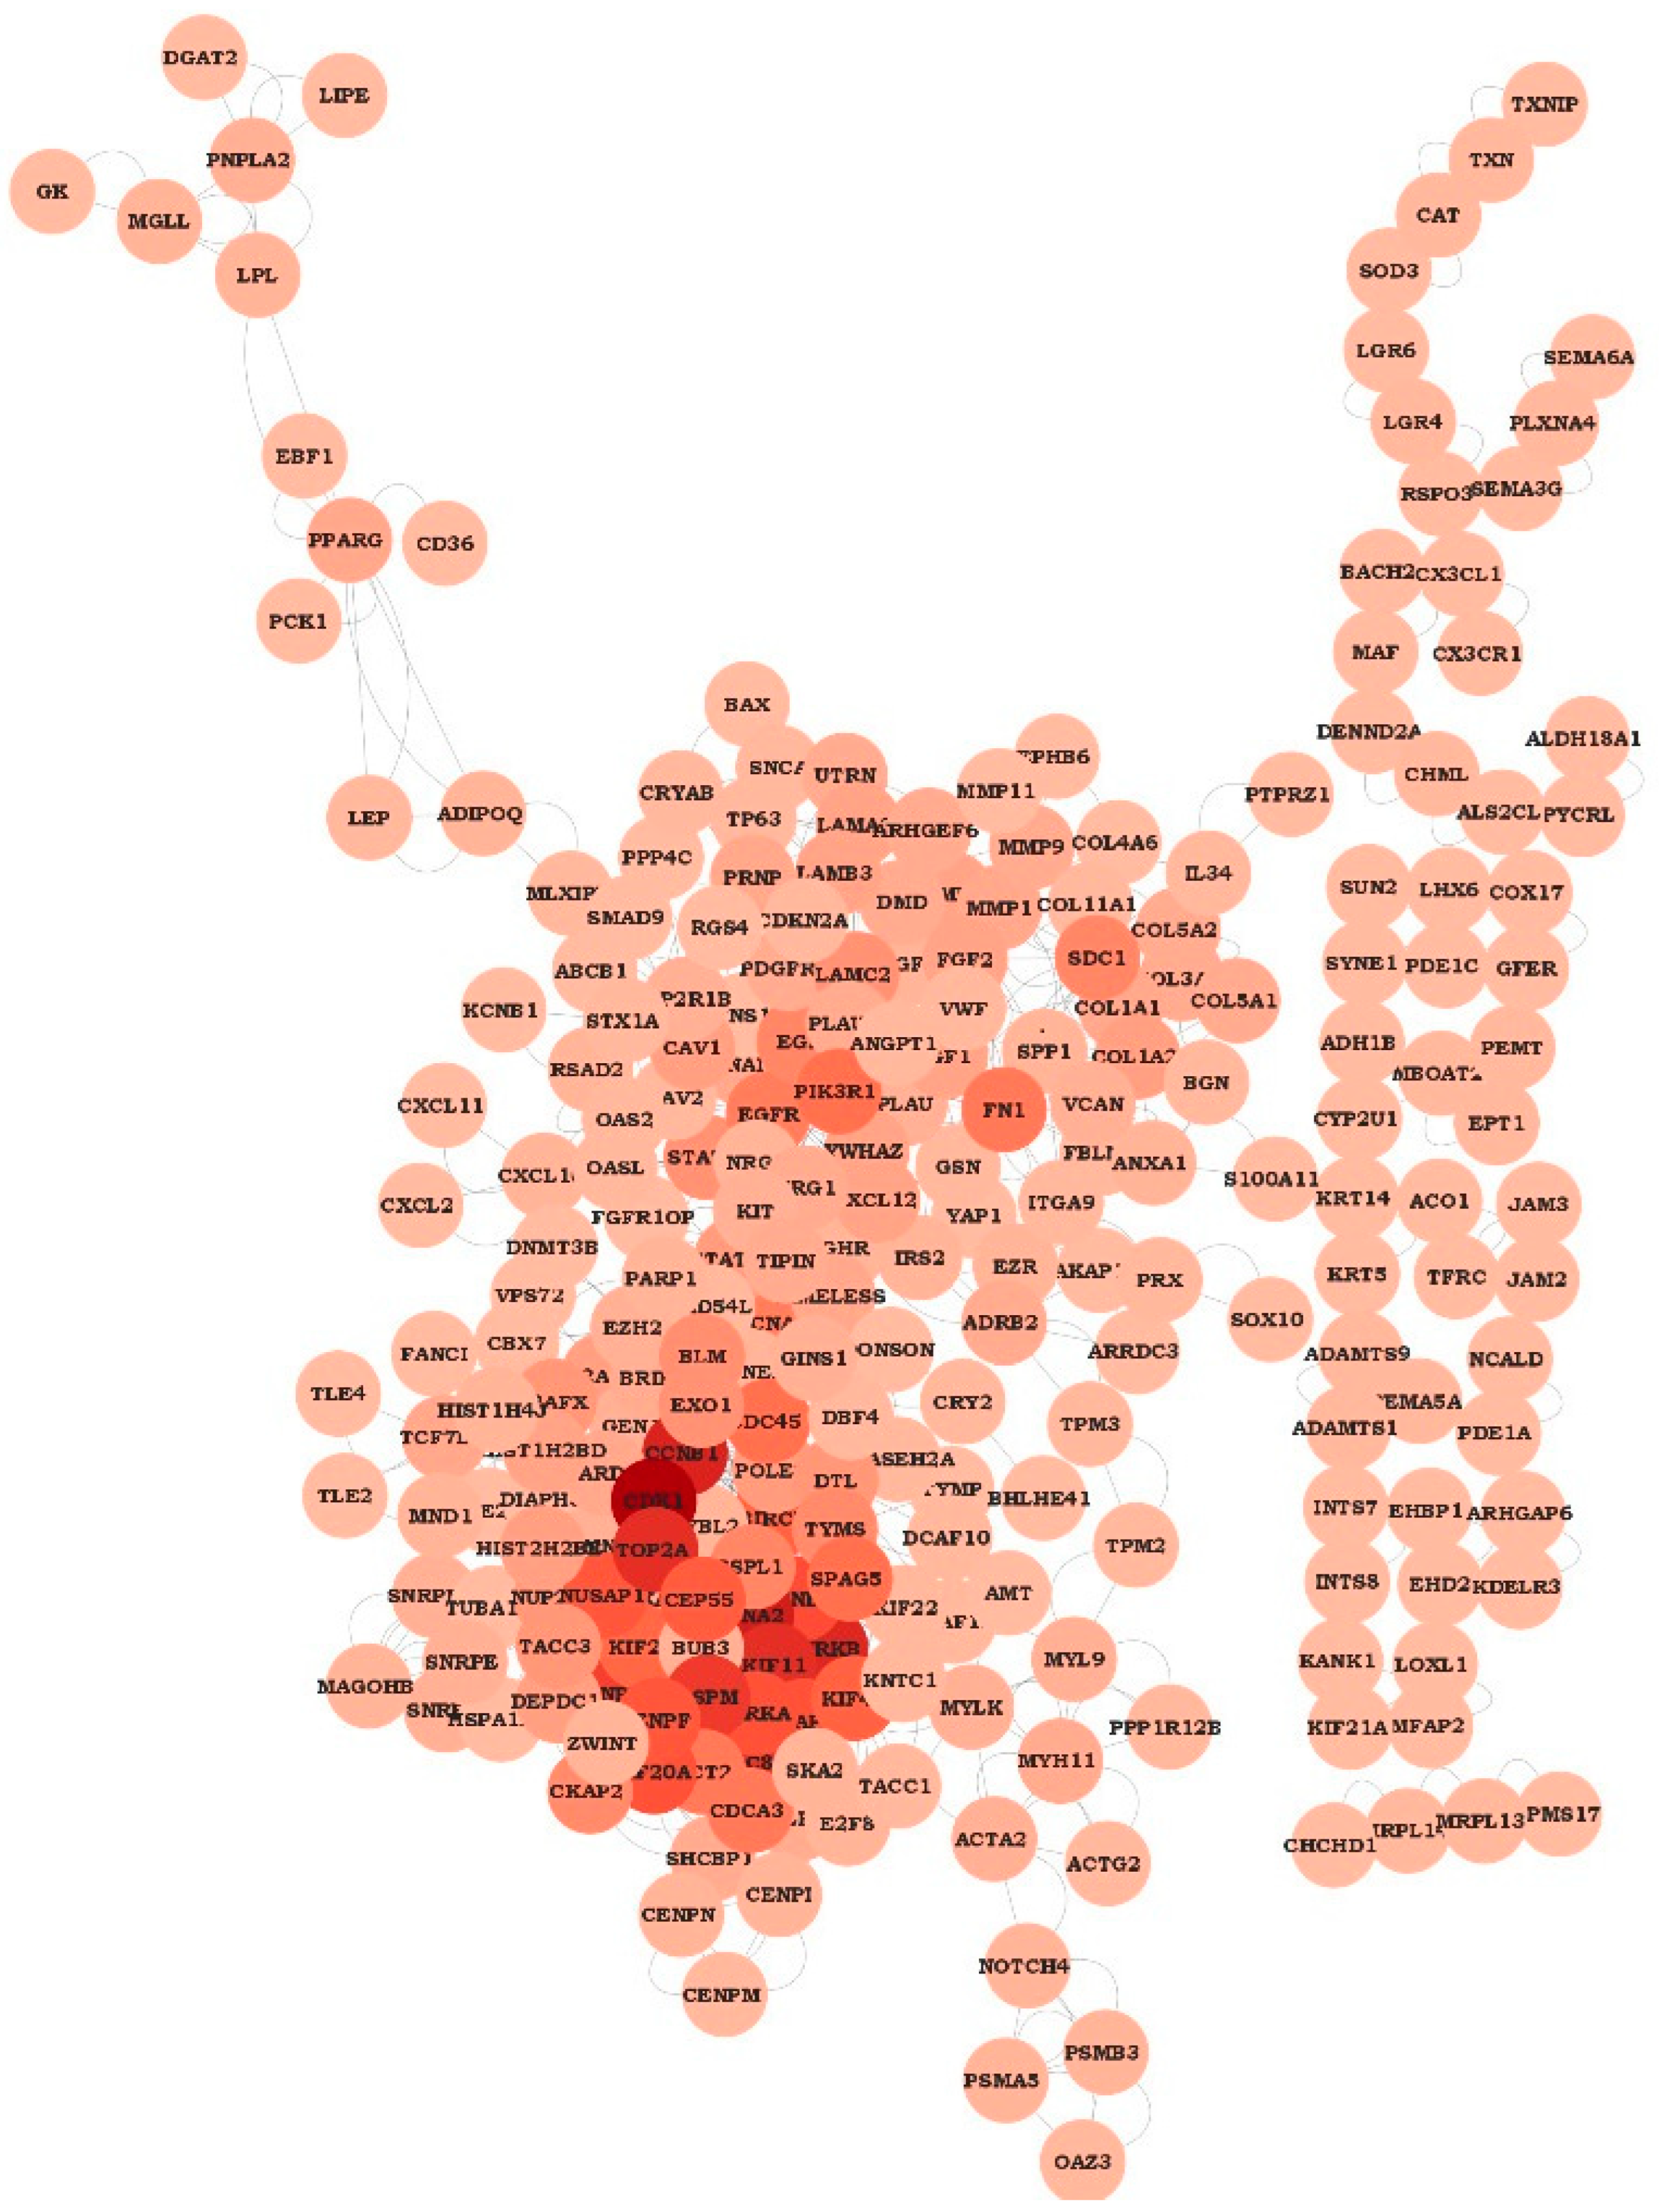
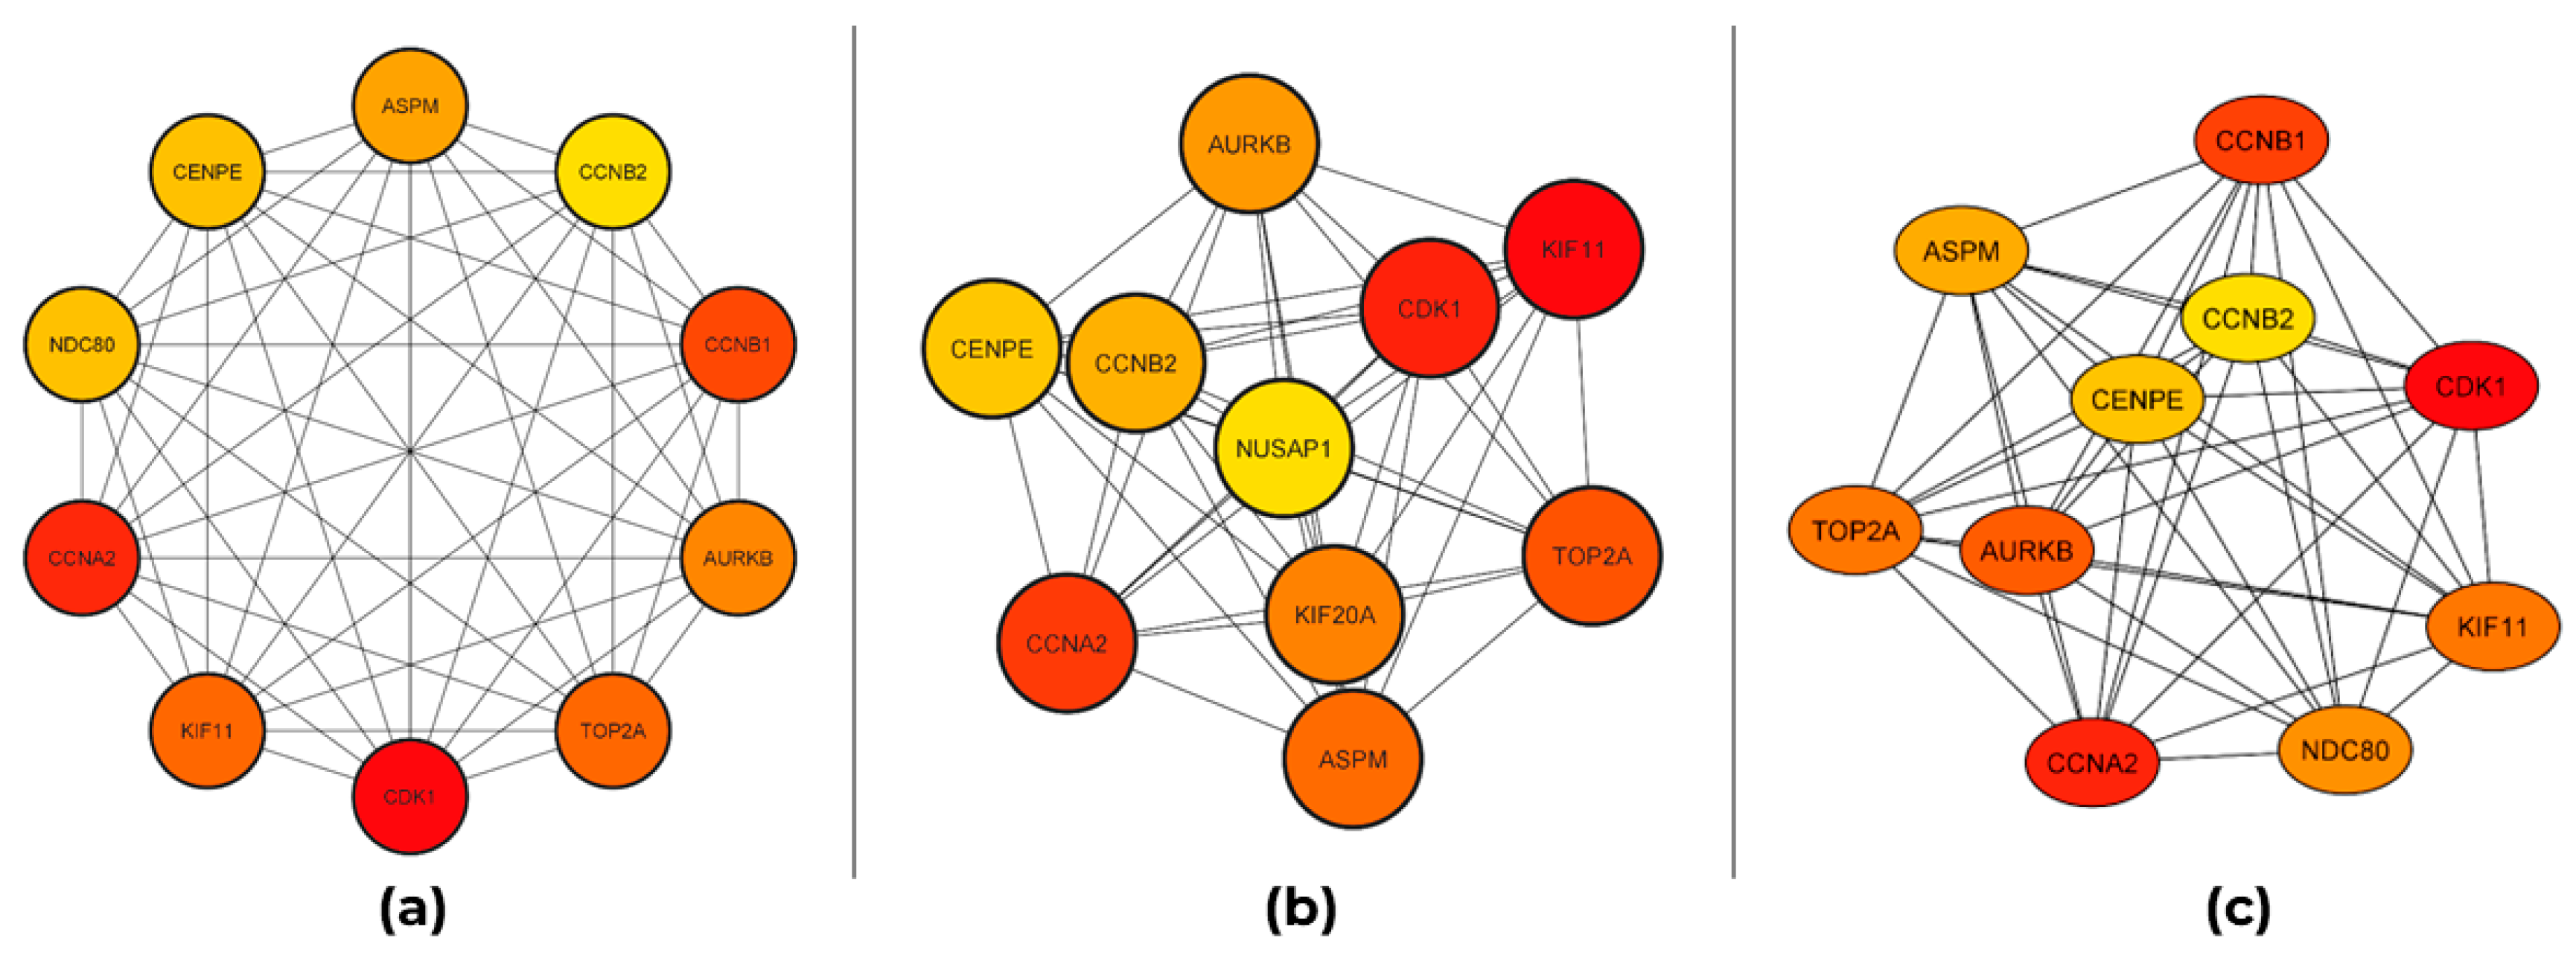
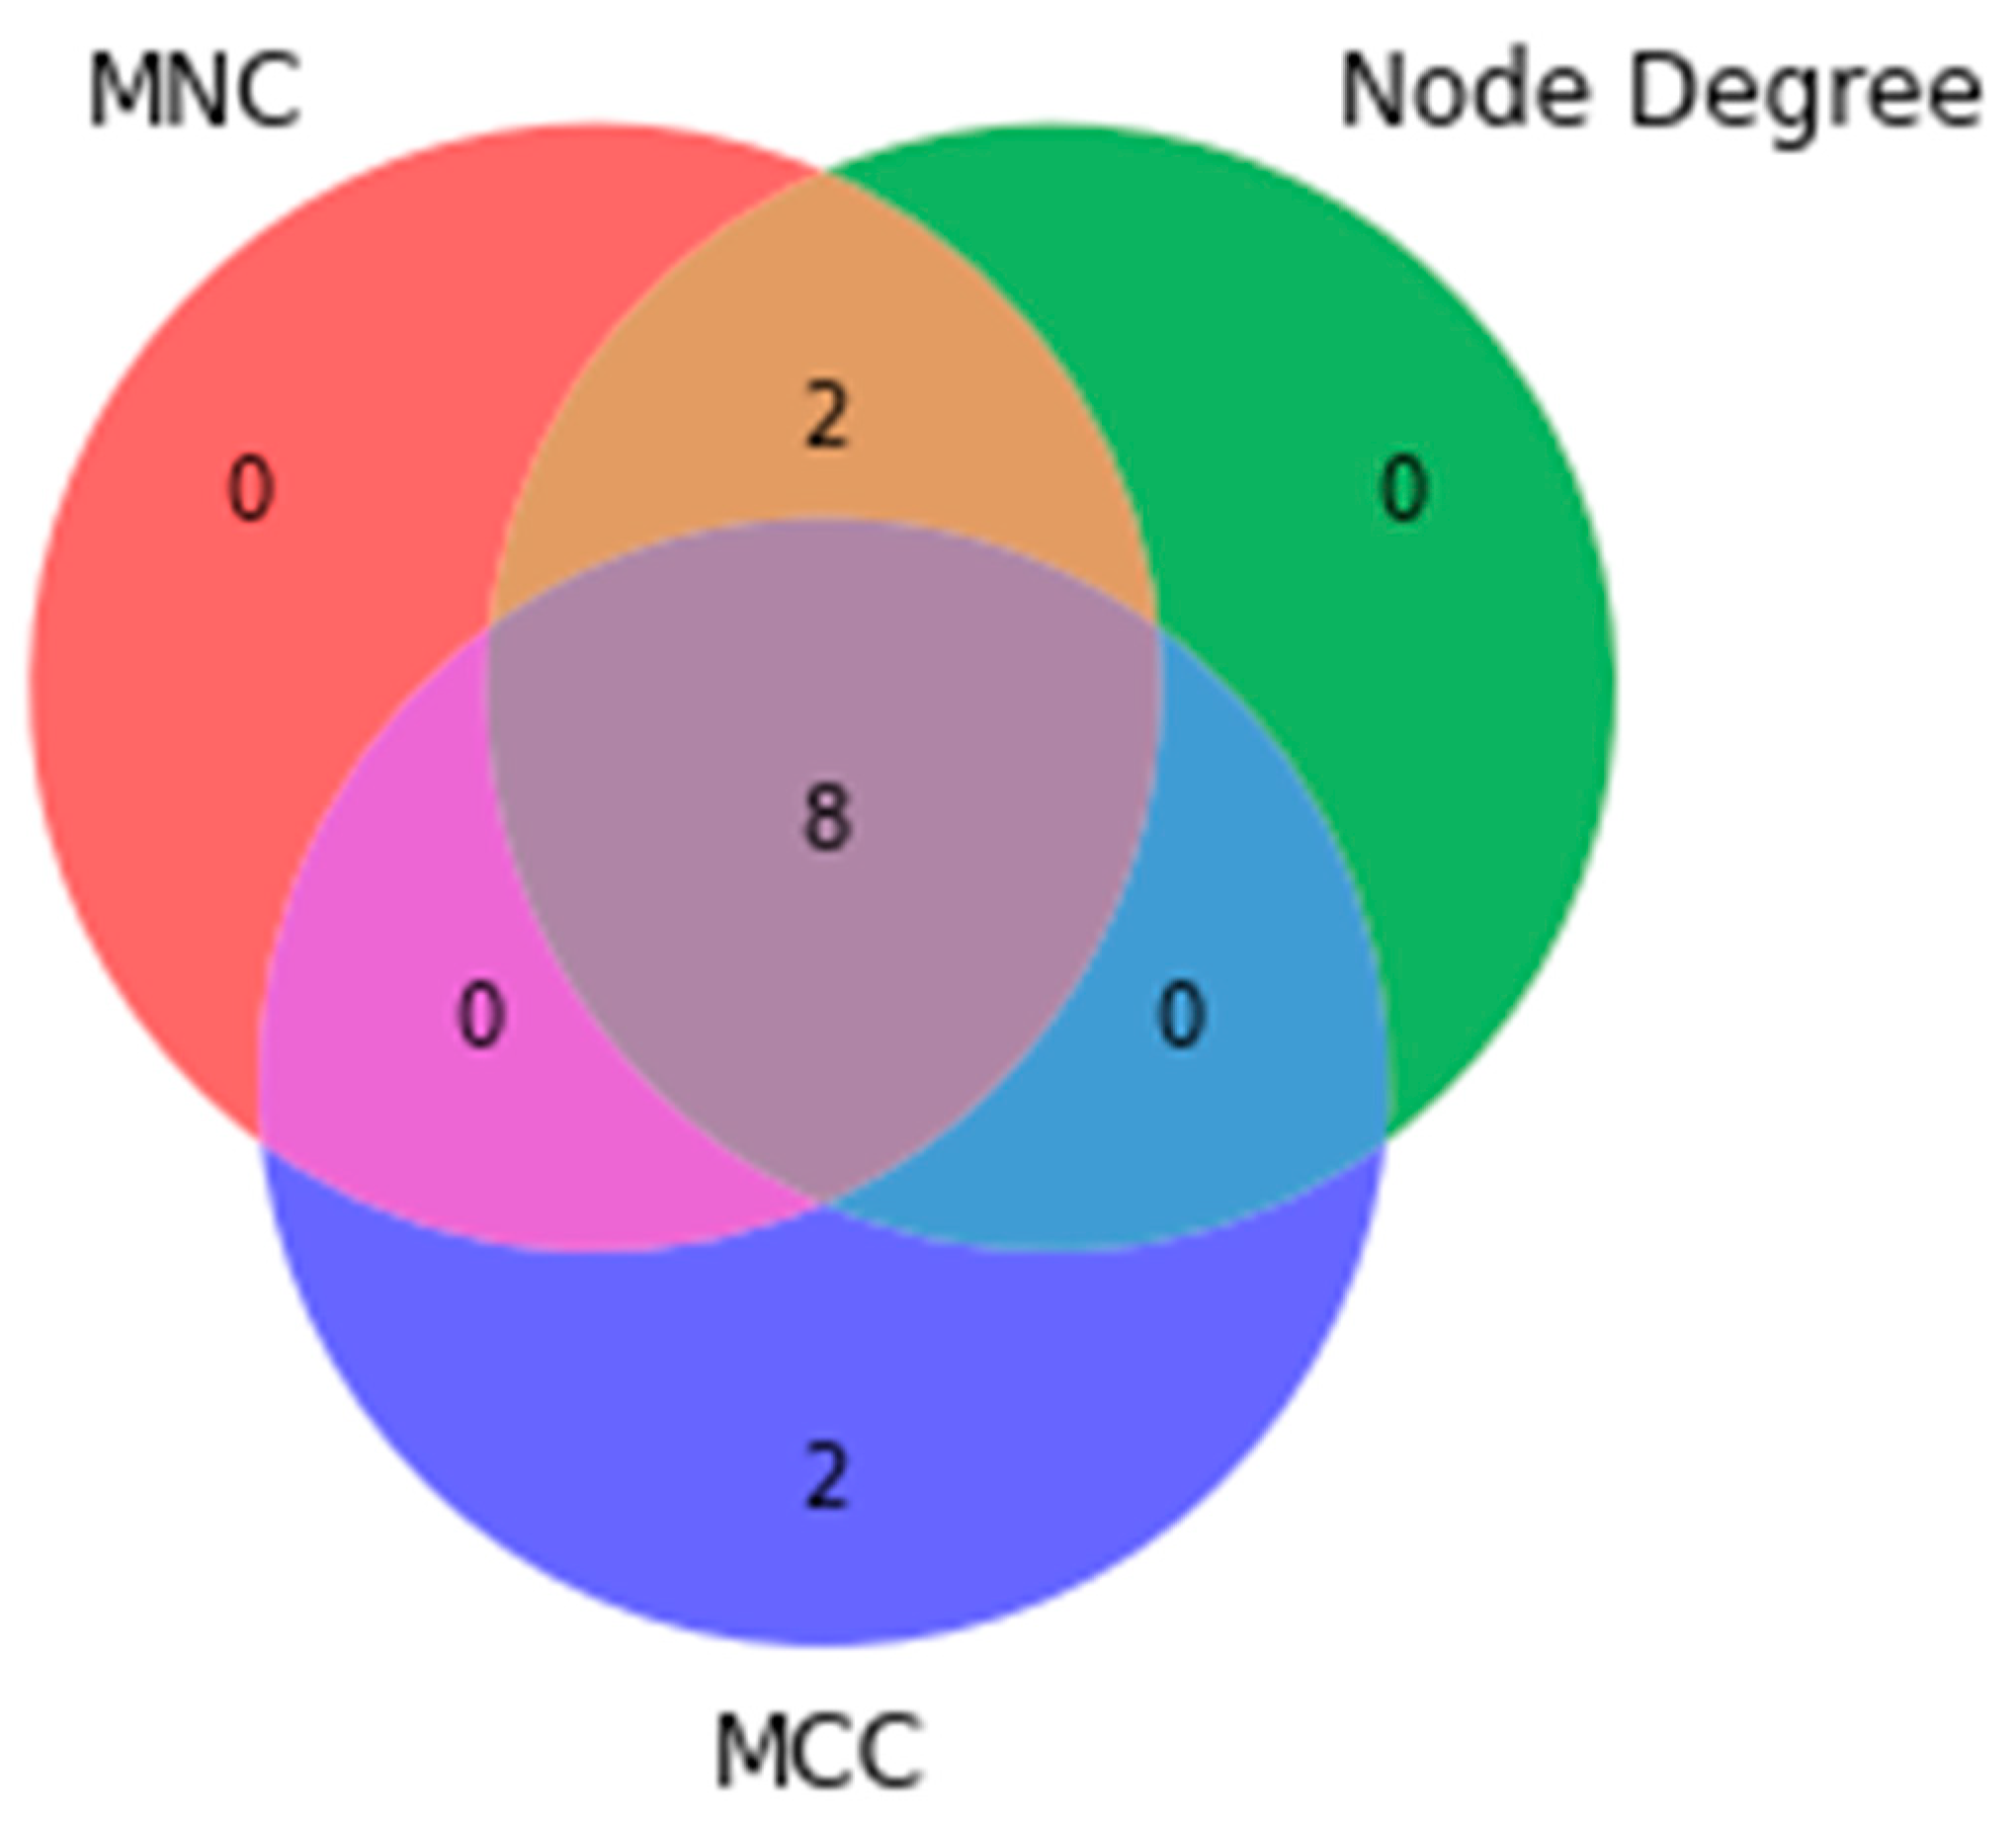
4.3. PPI Network Construction and Hub Genes Selection

Further investigation was done to gain insight into our DEGs list by exploring them using a PPI network. For this purpose, a PPI network was built using the STRING database and Cytoscape application, with an input of 540 DEGs. The first-order network created an extensive network comprising 538 nodes and 691 edges. Because there were too many nodes, the first-order network was too large to be visualized and we needed to focus only on the important nodes. Therefore, a zero-order PPI network was built to get a clear network and obtain the most significant nodes. This network has 56 nodes with the highest connection (degree of 13). Cyclin-dependent kinase 1 (CDK1), Cyclin A2 (CCNA2), and Cyclin B1 (CCNB1) were the up-regulated genes with the highest node degrees (see Figure 4, Figure 5 and Figure 6). These genes are essential for controlling the cell cycle [38,39,40]. Moreover, the maximal clique centrality (MCC), maximum neighborhood component (MCN), and degree methods were used to select the hub genes from the PPI network using the CytoHubba plugin with default parameters in Cytoscape. The top 10 genes with the highest MNC, MCC, and node degree scores were identified as hub genes, as shown in Figure 7a–c, respectively. We observed the intersection from the three methods and generated a Venn plot to present the overlapped hub genes (see Figure 8). This process revealed eight hub genes (CDK1, KIF11, CCNA2, TOP2A, ASPM, AURKB, CCNB2, and CENPE).

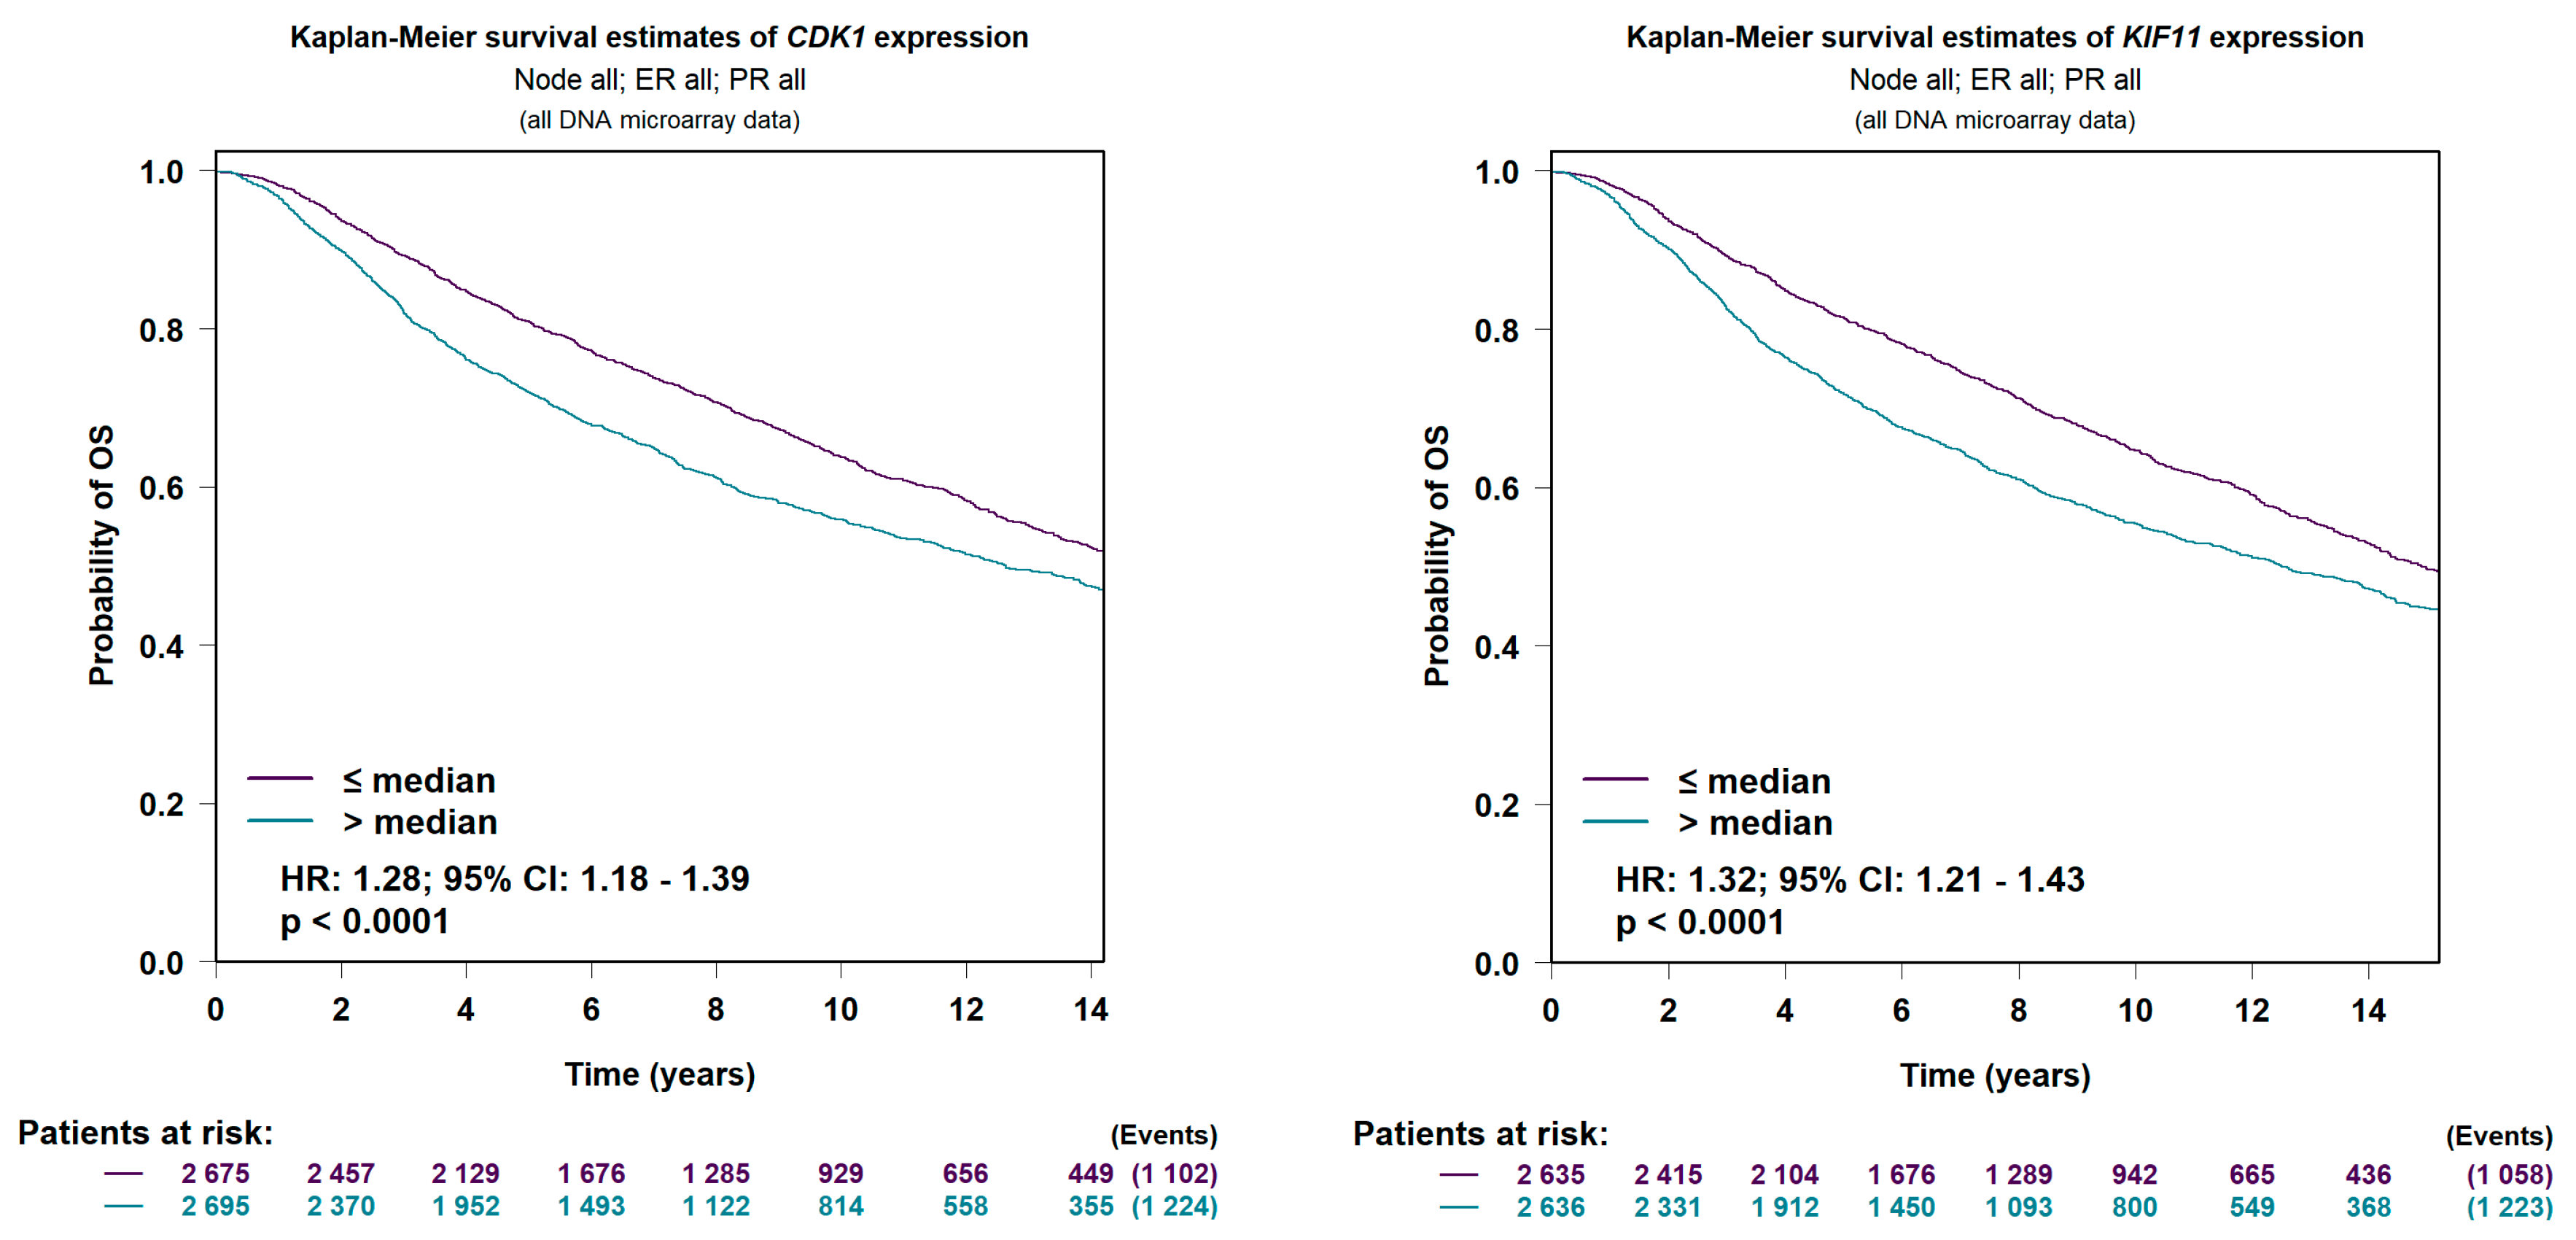
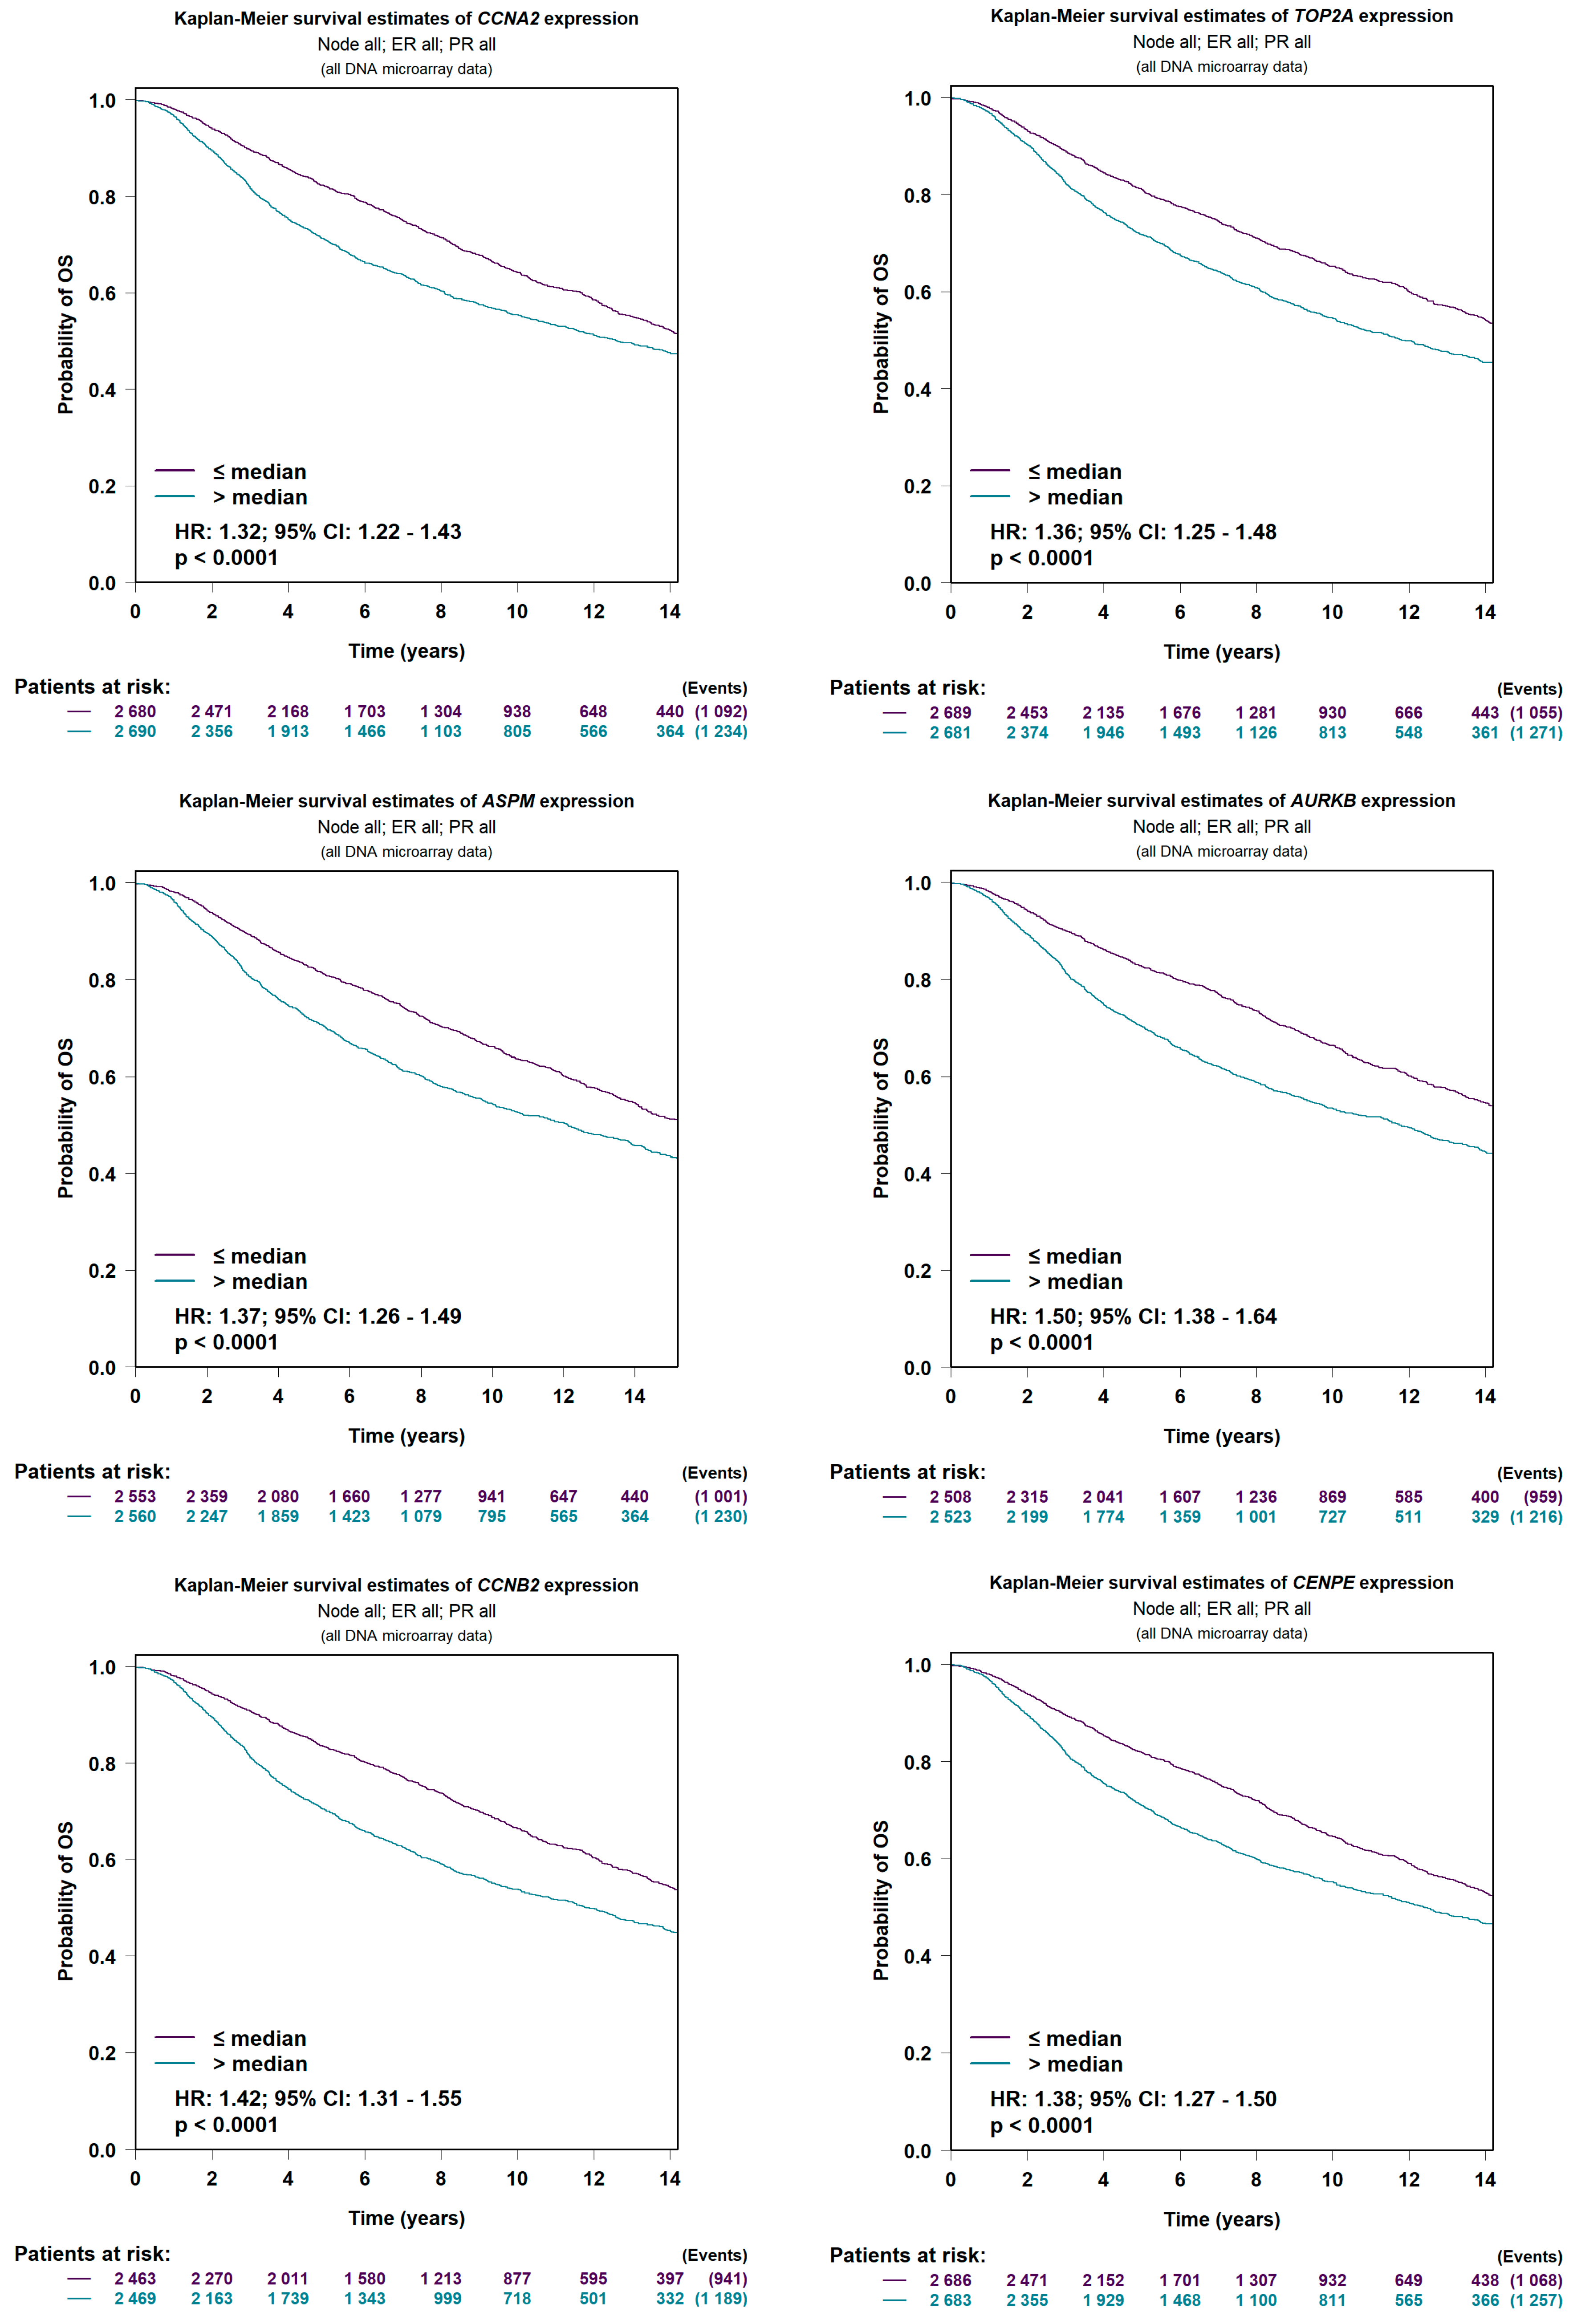
4.4. Prognostic Value Verification of Hub Genes

The Kaplan–Meier univariate survival analysis was conducted using the statistical mining tool of published annotated breast cancer transcriptomic data web portal (bc-GenExMiner v4.8) [41,42,43] to verify the prognostic value of the hub genes. The survival analysis was conducted to discover the association between the hub genes and overall survival because the hub genes are associated with patient prognosis and overall survival, and may be used to make future diagnoses [44].
In our analysis, the patients with nodal, oestrogen, and progesterone receptor status were selected after splitting them into two groups based on the median expression level of the hub genes. The statistical significance of the hub genes was calculated based on the p value, where p < 0.05 is considered statistically significant. The results, depicted in Figure 9, revealed that all eight hub genes have significant differences between the low-high expression levels groups. The low expression level group of the eight hub genes was significantly associated with better OS than the high expression level group.

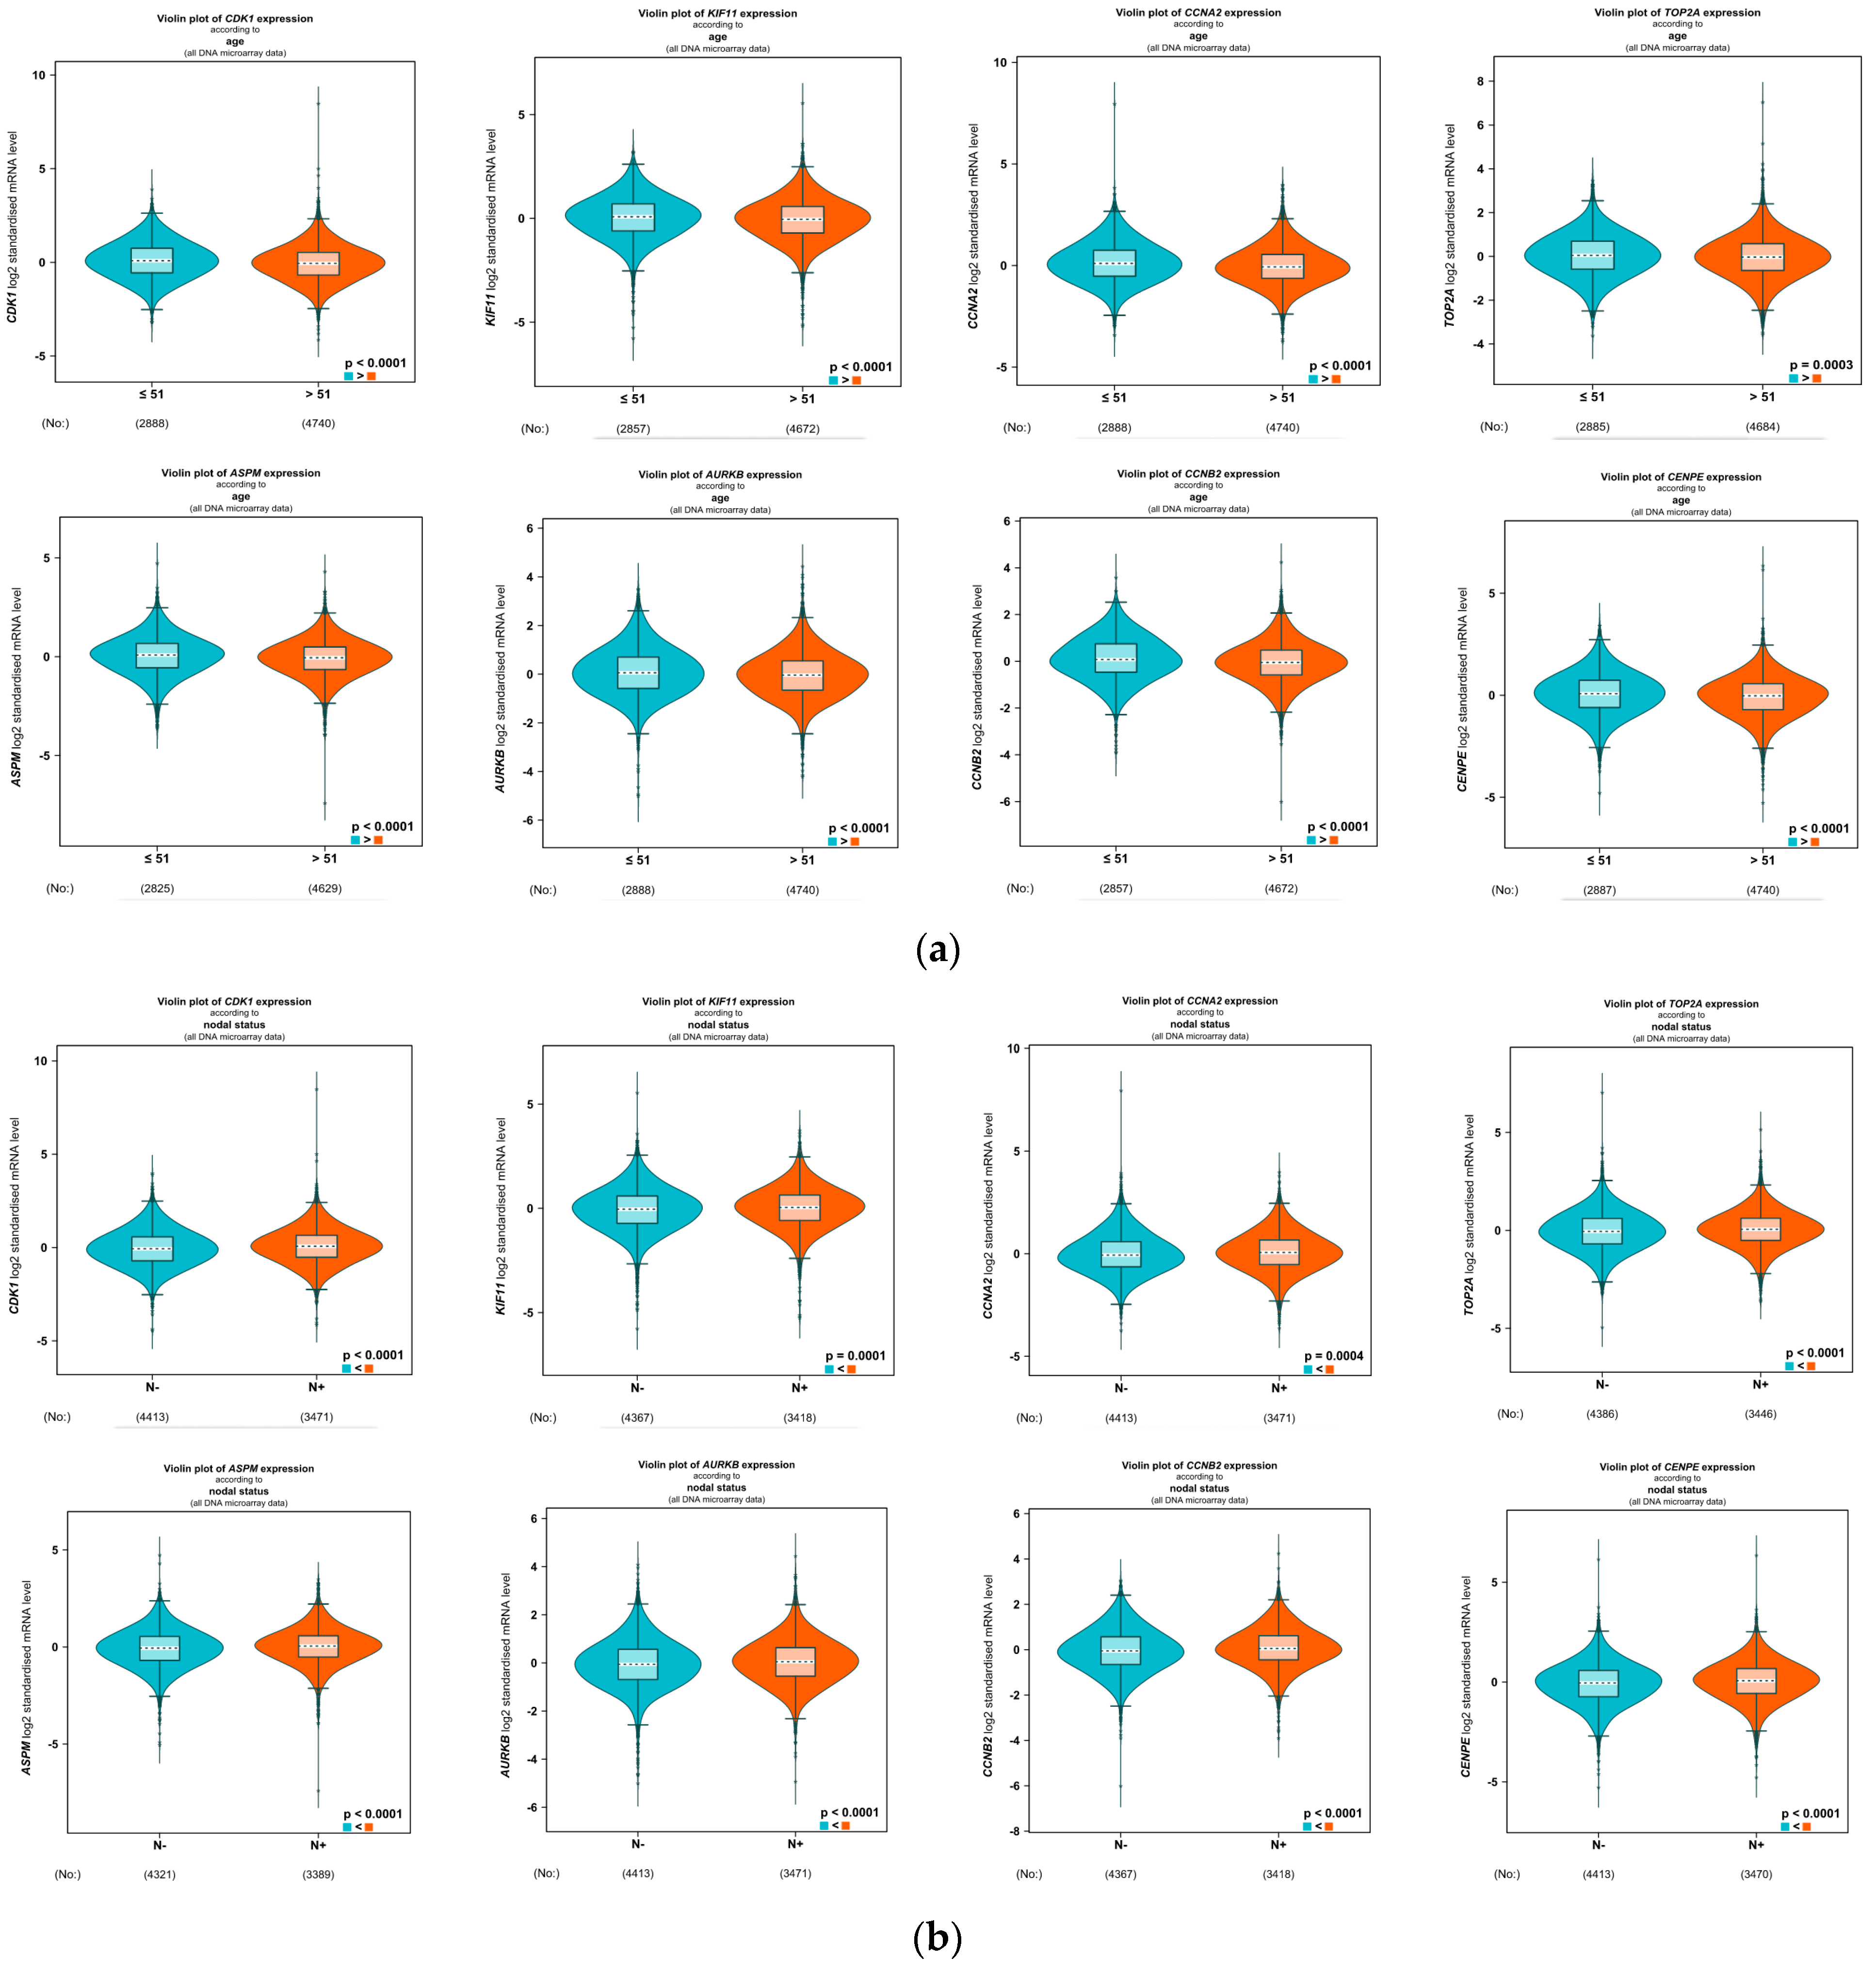
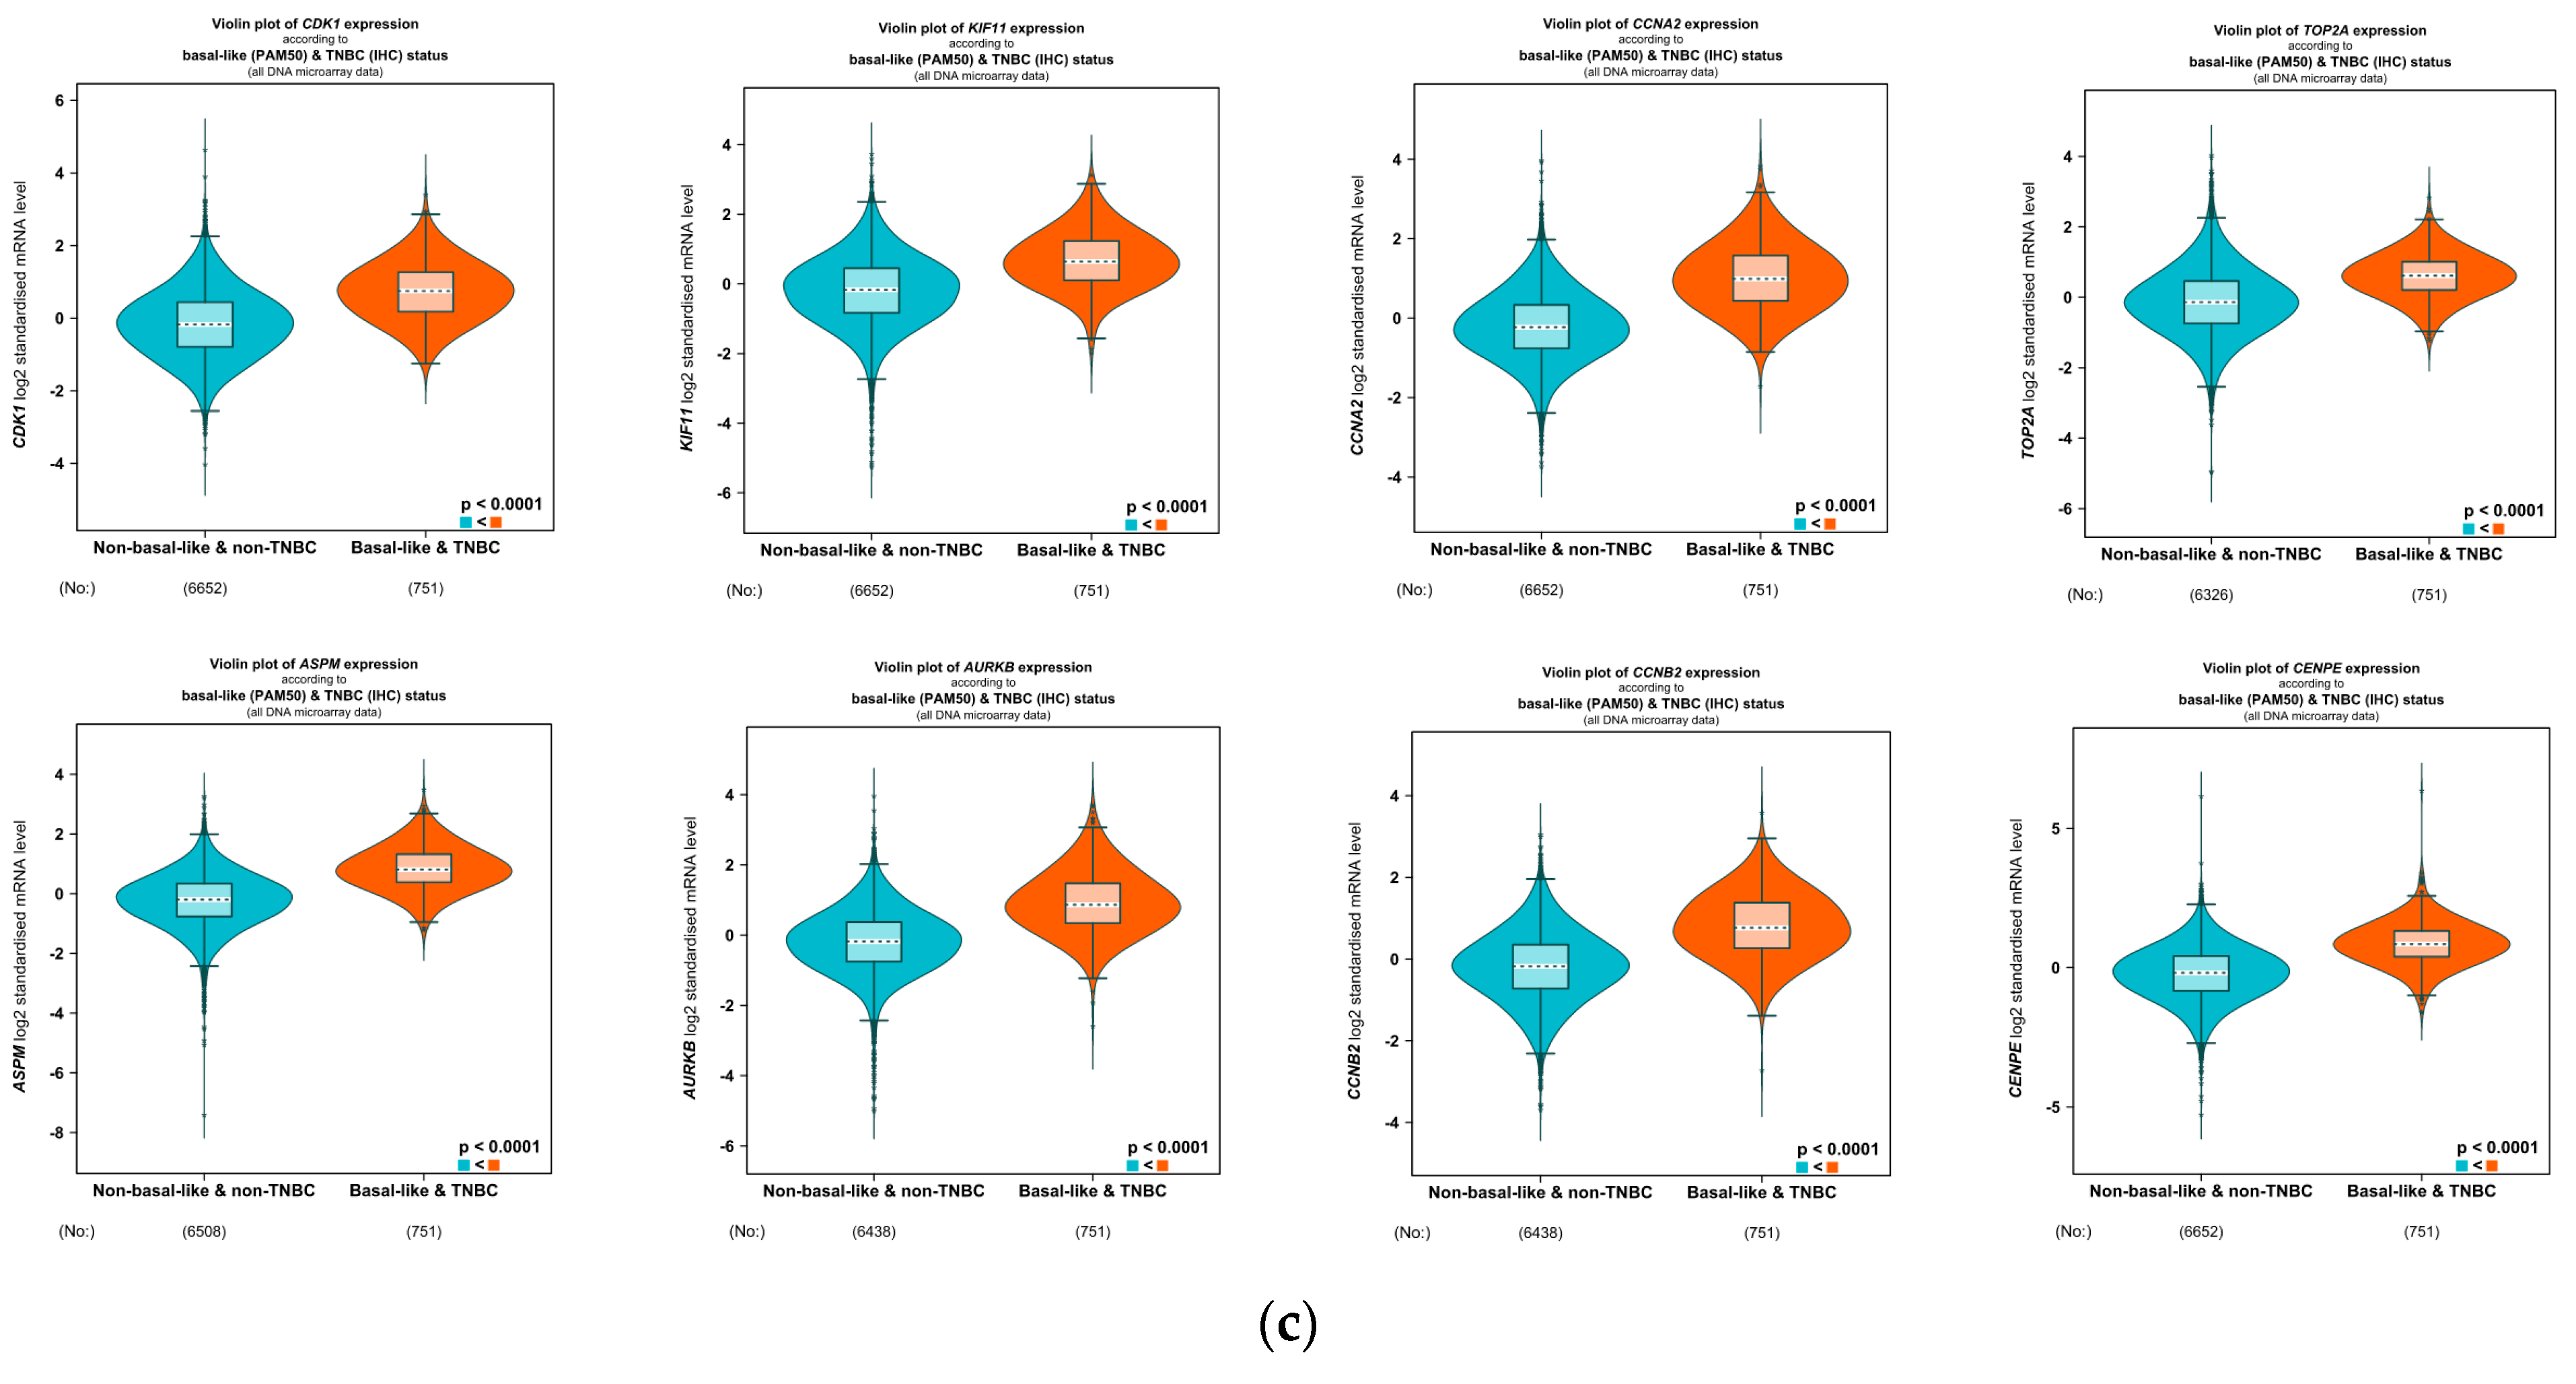
4.5. Correlation Analysis of the Clinicopathological Variables in BC with the Eight Hub Genes

There is a relatively large number of samples with rich clinical information in the bc-GenExMiner platform. We analysed the relationship between the clinical information variable in this platform and the expression levels of the eight hub genes (CDK1, KIF11, CCNA2, TOP2A, ASPM, AURKB, CCNB2, and CENPE). The results depicted in Figure 10 show that the expression levels of all eight hub genes are significantly higher in the subjects aged ≤ 51 years (p < 0.05, Figure 10a). High expression levels of the eight hub genes were associated with lymph node metastasis (p < 0.05, Figure 10b). Additionally, the expression level of the eight hub genes is higher in the TNBC and basal-like BC patients than in the non-TNBC and non-basal-like patients (p < 0.05, Figure 10c). Moreover, the results show that high expression levels of all eight hub genes are associated with higher SBR grades and Ki67 status. Thus, we conclude that all eight hub genes are associated with the clinicopathological variables of BC.

5. Discussion

Cancer is a disorder associated with cells that divide more rapidly compared to healthy cells. This rapid growth makes cells accumulate continuously and form a mass or lump, known as a tumour. Breast cancer is caused by abnormal growth of the cells in the milk-producing ducts or in the lobules, which are glandular tissues. Additionally, it can be caused by other tissues or cells within the breast mass. Breast cancer affects the quality of life of patients and increases their mortality. Although lifestyle and environmental factors increase the risk of breast cancer, it is not known why some people with known risk factors do not develop breast cancer, yet others with no risk factors develop breast cancer. Gene mutations passed through generations are estimated to be responsible for 5 to 10 percent of breast cancer cases [45,46]. Researchers have identified several inherited genes that are linked to breast cancer. Therefore, a person with a strong family history of breast cancer, or other cancer types, will be recommended to undergo a blood test to identify specific gene mutations in the family history.
Although great efforts have been made to understand the molecular mechanism of breast cancer development, this mechanism is not yet completely understood. Therefore, it is very important to understand the pathogenesis of breast cancer. It is worth noting that the disease diagnosed and discovered in the early stage is typically treated with a high probability of success. Additionally, in precision medicine, identifying biomarkers or genes responsible for breast cancer is becoming more important to match a targeted therapy with those most likely to benefit from it and increase the clinical outcomes profoundly. Detecting biomarkers in body fluids, such as urine and blood, using laboratory tools has shown great success in the early diagnosis and treatment of this disease. However, the potential of biomarkers has not been completely explored because of the technical difficulties in the currently available technologies. Additionally, the biomarkers are often present at very low concentrations in the body fluids, making their identification difficult and time-consuming [47]. Although RNASeq is considered a new technology and is more accurate and powerful than microarray technology, the information that can be extracted from microarray is truthful and robust [14]. Therefore, recent studies show that integrating different data sources has helped significantly in using all the available information effectively, facilitating the decision-making of the diagnosis and treatment process. This approach also points out a strategy of employing hybrid models to analyse such type of integrated data.
In this study, limma and TCGAbiolinks R packages were used to obtain DEGs in microarray and RNASeq data, respectively. Since we have three microarray datasets and one RNASeq dataset, we obtained four lists of DEGs. These four lists of DEGs were integrated through the intersection to select the common DEGs. We found that there were 540 common DEGs from these two platforms. Thereafter, the STRING database was used to build the PPI network to find the hub genes. The STRING database contains more than 14,000 genomes, which encode more than 67 million proteins. STRING is used to infer the physical interaction and the functional association to discover which proteins are likely to work together even if they are not physically bound. The clue for this comes from different sources. These sources are genomic context and gene co-expression to identify genes with similar expression pattern. The genomic context information can be pulled out from the genes themselves, including gene fusion, where two genes from one organism are fused into a single protein coding gene in one or more organisms. Additionally, it includes gene neighborhoods, which can be used to identify evolutionarily conserved operands in these genomes. Genome context also helps to look into phylogenetic profiles to identify genes that show similar present or absent patterns across the tree of life. The STRING database also considers curated knowledge from the manually annotated database of protein complexes and molecular pathways. Using the STRING database, we can visualize a subset of the proteins as interacting networks, and perform enrichment analysis on the entire input. KEGG pathways and GO enrichment analysis were applied to all the DEGs, and we found that they engage in a significant role in several biological processes, molecular functions, and cellular components. Moreover, we identified eight common hub genes using three methods, namely, MCC, node degree, and MNC from the Cytohubba plugin in Cytoscape. These eight hub genes are CDK1, CCNA2, AURKB, TOP2A, KIF11, ASPM, CENPE, and CCNB2.
Yuan et al. [48] used the MCC method to identify the hub genes that are associated with breast cancer. They found cyclin B1 (CCNB1), cyclin A2 (CCNA2), cyclin dependent kinase 1 (CDK1), cell division cycle 20 (CDC20), DNA topoisomerase II alpha (TOP2A), BUB1 mitotic checkpoint serine/threonine kinase (BUB1), aurora kinase B (AURKB), cyclin B2 (CCNB2), kinesin family member 11 (KIF11), and assembly factor for spindle microtubules (ASPM). These genes, except for CCNB1, CDC20, and BUB1 are the same genes that we identified as hub genes that are associated with breast cancer. In our study, CENPE is identified as one of the hub genes, but Yuan et al. did not identify it as one of the hub genes.
CDK1, CCNA2, AURKB, and CCNB2 that we identified among the hub genes are also identified among the hub genes that are associated with colon cancer in a study conducted by Toolabi et al. [49]. Moreover, in a study conducted by Pan et al. [50], CDK1, CCNA2, and TOP2A are also identified as hub genes associated with thyroid cancer. A study for screening and identification of hub genes found that CDK1, AURKB, KIF11, CENPE, and CCNB2 are also associated with bladder cancer [51]. Suman and Mishra [52] proposed overlapping modules that identify the common hub genes for five cancer types (breast, ovarian, cervical, vulvar, and endometrial). They found that TOP2A and CCNB2 are linked to these five cancer types. We also identified these two genes among the hub genes.
More recently there have been many studies designed for hub gene identification for BC. These studies include the work of Ma et al. [8], and Alam et al. [9]. Ma et al. identified 22 DEGs from four microarray gene expression datasets (GSE65194, GSE64790, GSE41970, and GSE38959 datasets). Their analysis revealed six hub genes (TOP2A, CHEK1, CCNA2, PCNA, MSH2, and CDK6) based on the PPI network of the DEGs. They used survival analysis to assess their identified hub genes’ reliability. Their results show that five of the six hub genes (TOP2A, CCNA2, PCNA, MSH2, CDK6) are associated with the triple-negative breast cancer prognosis. Alam et al. identified 127 common DEGs from five microarray gene expression datasets (GSE139038, GSE62931, GSE45827, GSE42568, and GSE54002) using the LIMMA and SAM statistical methods. Thereafter, they constructed a PPI network using the string database and identified the top seven rank genes (BUB1, ASPM, TTK, CCNA2, CENPF, RFC4, and CCNB1) as hub or key genes. They then used multivariate survival analysis to validate their identified genes, and the results show that the hub genes have a strong prognosis power for BC. The hub genes identified by Ma et al. and Alam et al. intersect with three genes (TOP2A, CCNA2, ASPM) from the genes we identified as hub genes in our study. CCNA2 is identified as a hub gene by the studies of both Ma et al. and Alam et al.
The contribution of this study is developing a PPI network based on an integrated analysis of RNASeq and microarray data. Additionally, in this study eight hub genes associated with BC were identified and then validated with previous studies. Our analysis resulted in genes among the hub genes that did not exist in the previous studies. We used the Kaplan–Meier univariate survival analysis to verify the prognostic value of the hub genes.

6. Conclusions

In this study, a PPI network was constructed for the DEGs obtained from RNASeq and microarray gene expression data integration. Common hub genes associated with the BC were identified from the constructed PPI using MCC, MNC, and node degree methods. Additionally, enrichment analysis was conducted, and the results show that CDK1, KIF11, CCNA2, TOP2A, ASPM, AURKB, CCNB2, and CENPE are the hub genes that contribute significantly to breast cancer. These hub genes were validated with the previous studies, and extra genes not identified before were found as biomarkers in our study. The results also show that focal adhesion, ECM-receptor interaction, melanoma, and prostate cancer were the most significant pathways. Additionally, the results show that EGFR and PIK3R1 were involved in most of the pathways. The obtained hub genes were also validated using the Kaplan–Meier and correlation analysis, and the results show that they can serve as prognostic and diagnostic biomarkers for BC.

Supplementary Materials

The following supporting information can be downloaded at: https://www.mdpi.com/article/10.3390/app13042403/s1, Table S1: A list of 540 common DEGs from the microarray and the RNASeq datasets.

Author Contributions

All authors contributed substantially to this work. M.M. and M.K.E. downloaded the datasets, computed the features, generated the PPI network, performed experiments, and drafted the manuscript. H.M. and B.O. participated in the design of the study and helped to draft the manuscript. All authors have read and agreed to the published version of the manuscript.

Funding

This work was funded by the Deanship of Scientific Research at Jouf University under grant No. (DSR-2021-02-0362).

Data Availability Statement

The microarray datasets are publicly available on the Gene Expression Omnibus (GEO) public database (https://www.ncbi.nlm.nih.gov/geo/, accessed on 12 February 2022) under the accession numbers GSE22820, GSE45827, and GSE70905. The RNASeq dataset is publicly available on The Cancer Genome Atlas (TCGA) repository under the accession number TCGA-BRCA.

Acknowledgments

The authors would like to thank the Deanship of Scientific Research at Jouf University for the financial support for this work.

Conflicts of Interest

The authors declare no conflict of interest.

Abbreviations

BCBreast Cancer
TCGAThe Cancer Genome Atlas
GEOGene Expression Omnibus
DEGsDifferentially Expressed Genes
GOGene Ontology
MCCMaximal Clique Centrality
MCNMaximum Neighborhood Component
NCDsNon-Communicable Diseases
WHOWorld Health Organization
NGSNext-Generation Sequencing
TNMTumour-Node-Metastasis
AMDAge-related Macular Degeneration
ECMExtraCellular Matrix
PPIProtein-Protein Interaction
PaCaPancreatic Cancer
CRCColorectal Cancer
KEGGKyoto Encyclopaedia of Genes and Genomes
PBMCPeripheral Blood Mononuclear Cell
TNFTumor Necrosis Factor
mRMRMinimum Redundancy Maximum Relevance
limmaLinear Models for Microarrays
AAICArray-Array Intensity Correlation
DEDifferentially Expressed

References

  1. WHO. Noncommunicable Diseases 2021. Available online: https://www.who.int/news-room/fact-sheets/detail/noncommunicable-diseases (accessed on 30 March 2022).
  2. Sung, H.; Ferlay, J.; Siegel, R.L.; Laversanne, M.; Soerjomataram, I.; Jemal, A.; Bray, F. Global Cancer Statistics 2020: GLOBOCAN Estimates of Incidence and Mortality Worldwide for 36 Cancers in 185 Countries. CA Cancer J. Clin. 2021, 71, 209–249. [Google Scholar] [CrossRef] [PubMed]
  3. Roy, S.; Kumar, R.; Mittal, V.; Gupta, D. Classification models for Invasive Ductal Carcinoma Progression, based on gene expres-sion data-trained supervised machine learning. Sci. Rep. 2020, 10, 4113. [Google Scholar] [CrossRef] [PubMed]
  4. Rakha, E.A.; Reis-Filho, J.S.; Baehner, F.; Dabbs, D.J.; Decker, T.; Eusebi, V.; Fox, S.B.; Ichihara, S.; Jacquemier, J.; Lakhani, S.R.; et al. Breast cancer prognostic classification in the molecular era: The role of histological grade. Breast. Cancer Res. 2010, 12, 207. [Google Scholar] [CrossRef] [PubMed]
  5. Gress, D.M.; Edge, S.B.; Greene, F.L.; Washington, M.K.; Asare, E.A.; Brierley, J.D.; Byrd, D.R.; Compton, C.C.; Jessup, J.M.; Winchester, D.P. Principles of cancer staging. AJCC Cancer Staging Man. 2017, 8, 3–30. [Google Scholar]
  6. Roberto Cesar, M.-O.; German, L.-B.; Paola Patricia, A.-C.; Eugenia, A.-R.; Elisa Clementina, O.-M.; Jose, C.-O.; Marlon Alberto, P.-M.; Fabio Enrique, M.-P.; Margarita, R.-V. Method based on data mining techniques for breast cancer recurrence analysis. In Proceedings of the International Conference on Swarm Intelligence, Belgrade, Serbia, 14–20 July 2020; Springer: Berlin/Heidelberg, Germany, 2020; pp. 584–596. [Google Scholar]
  7. Abd-Elnaby, M.; Alfonse, M.; Roushdy, M. Classification of breast cancer using microarray gene expression data: A survey. J. Biomed. Inform. 2021, 117, 103764. [Google Scholar] [CrossRef]
  8. Ma, J.; Chen, C.; Liu, S.; Ji, J.; Wu, D.; Huang, P.; Wei, D.; Fan, Z.; Ren, L. Identification of a five genes prognosis signature for triple-negative breast cancer using multi-omics methods and bioinformatics analysis. Cancer Gene Ther. 2022, 29, 1578–1589. [Google Scholar] [CrossRef]
  9. Alam, M.S.; Rahaman, M.M.; Sultana, A.; Wang, G.; Mollah, M.N.H. Statistics and network-based approaches to identify molecular mechanisms that drive the progression of breast cancer. Comput. Biol. Med. 2022, 145, 105508. [Google Scholar] [CrossRef]
  10. Dhirachaikulpanich, D.; Li, X.; Porter, L.F.; Paraoan, L. Integrated Microarray and RNAseq Transcriptomic Analysis of Retinal Pigment Epithelium/Choroid in Age-Related Macular Degeneration. Front. Cell Dev. Biol. 2020, 8, 808. [Google Scholar] [CrossRef]
  11. Nisar, M.; Paracha, R.Z.; Arshad, I.; Adil, S.; Zeb, S.; Hanif, R.; Rafiq, M.; Hussain, Z. Integrated Analysis of Microarray and RNA-Seq Data for the Identification of Hub Genes and Networks Involved in the Pancreatic Cancer. Front. Genet. 2021, 12, 663787. [Google Scholar] [CrossRef]
  12. Hozhabri, H.; Lashkari, A.; Razavi, S.M.; Mohammadian, A. Integration of gene expression data identifies key genes and path-ways in colorectal cancer. Med. Oncol. 2021, 38, 7. [Google Scholar] [CrossRef]
  13. Karimizadeh, E.; Sharifi-Zarchi, A.; Nikaein, H.; Salehi, S.; Salamatian, B.; Elmi, N.; Gharibdoost, F.; Mahmoudi, M. Analysis of gene expression profiles and protein-protein interaction networks in multiple tissues of systemic sclerosis. BMC Med. Genom. 2019, 12, 199. [Google Scholar] [CrossRef] [PubMed] [Green Version]
  14. Castillo, D.; Galvez, J.M.; Herrera, L.J.; Roman, B.S.; Rojas, F.; Rojas, I. Integration of RNA-Seq data with heterogeneous microarray data for breast cancer profiling. BMC Bioinform. 2017, 18, 506. [Google Scholar] [CrossRef] [PubMed]
  15. Davis, S.; Davis, M.S. Imports X: Package ‘GEOquery’. 2013. Available online: http://bioconductor.statistik.tu-dortmund.de/packages/2.12/bioc/manuals/GEOquery/man/GEOquery.pdf (accessed on 12 February 2022).
  16. Weinstein, J.N.; Collisson, E.A.; Mills, G.B.; Shaw, K.R.; Ozenberger, B.A.; Ellrott, K.; Shmulevich, I.; Sander, C.; Stuart, J.M. The cancer genome atlas pan-cancer analysis project. Nat. Genet. 2013, 45, 1113–1120. [Google Scholar] [CrossRef] [PubMed]
  17. Shannon, P.; Markiel, A.; Ozier, O.; Baliga, N.S.; Wang, J.T.; Ramage, D.; Amin, N.; Schwikowski, B.; Ideker, T. Cytoscape: A software environment for integrated models of biomolecular interaction networks. Genome Res. 2003, 13, 2498–2504. [Google Scholar] [CrossRef] [PubMed]
  18. Doncheva, N.T.; Morris, J.H.; Gorodkin, J.; Jensen, L.J. Cytoscape StringApp: Network Analysis and Visualization of Proteomics Data. J. Proteome Res. 2019, 18, 623–632. [Google Scholar] [CrossRef]
  19. Liu, R.Z.; Graham, K.; Glubrecht, D.D.; Germain, D.R.; Mackey, J.R.; Godbout, R. Association of FABP5 expression with poor survival in triple-negative breast cancer: Implication for retinoic acid therapy. Am. J. Pathol. 2011, 178, 997–1008. [Google Scholar] [CrossRef]
  20. Gruosso, T.; Mieulet, V.; Cardon, M.; Bourachot, B.; Kieffer, Y.; Devun, F.; Dubois, T.; Dutreix, M.; Vincent-Salomon, A.; Miller, K.M. Chronic oxidative stress promotes H2 AX protein degradation and enhances chemosensitivity in breast cancer patients. EMBO Mol. Med. 2016, 8, 527–549. [Google Scholar] [CrossRef]
  21. Quigley, D.A.; Tahiri, A.; Luders, T.; Riis, M.H.; Balmain, A.; Borresen-Dale, A.L.; Bukholm, I.; Kristensen, V. Age, estrogen, and immune response in breast adenocarcinoma and adjacent normal tissue. Oncoimmunology 2017, 6, e1356142. [Google Scholar] [CrossRef]
  22. Lingle, W.; Erickson, B.; Zuley, M.; Jarosz, R.; Bonaccio, E.; Filippini, J.; Gruszauskas, N. Radiology data from the cancer genome atlas breast invasive carcinoma [TCGA-BRCA] collection. Cancer Imaging Arch. 2016, 10, K9. [Google Scholar]
  23. Smyth, G.K. Limma: Linear models for microarray data. In Bioinformatics and Computational Biology Solutions Using R and Bioconductor; Springer: Berlin/Heidelberg, Germany, 2005; pp. 397–420. [Google Scholar]
  24. Ritchie, M.E.; Phipson, B.; Wu, D.; Hu, Y.; Law, C.W.; Shi, W.; Smyth, G.K. Limma powers differential expression analyses for RNA-sequencing and microarray studies. Nucleic Acids Res. 2015, 43, e47. [Google Scholar] [CrossRef]
  25. Klaus, B.; Reisenauer, S. An end to end workflow for differential gene expression using Affymetrix microarrays. F1000Research 2016, 5, 1384. [Google Scholar] [CrossRef] [PubMed]
  26. Dohmen, J.; Baranovskii, A.; Ronen, J.; Uyar, B.; Franke, V.; Akalin, A. Identifying tumor cells at the single-cell level using machine learning. Genome Biol. 2022, 23, 123. [Google Scholar] [CrossRef] [PubMed]
  27. Yang, S.; Guo, X.; Yang, Y.-C.; Papcunik, D.; Heckman, C.; Hooke, J.; Shriver, C.D.; Liebman, M.N.; Hu, H. Detecting outlier microarray arrays by correlation and percentage of outliers spots. Cancer Inform. 2006, 2, 117693510600200017. [Google Scholar] [CrossRef]
  28. Mounir, M.; Lucchetta, M.; Silva, T.C.; Olsen, C.; Bontempi, G.; Chen, X.; Noushmehr, H.; Colaprico, A.; Papaleo, E. New functionalities in the TCGA biolinks package for the study and integration of cancer data from GDC and GTEx. PLoS Comput. Biol. 2019, 15, e1006701. [Google Scholar] [CrossRef]
  29. Risso, D.; Schwartz, K.; Sherlock, G.; Dudoit, S. GC-content normalization for RNA-Seq data. BMC Bioinform. 2011, 12, 480. [Google Scholar] [CrossRef]
  30. Bullard, J.H.; Purdom, E.; Hansen, K.D.; Dudoit, S. Evaluation of statistical methods for normalization and differential expression in mRNA-Seq experiments. BMC Bioinform. 2010, 11, 94. [Google Scholar] [CrossRef] [PubMed]
  31. Hansen KD, Irizarry RA, Wu Z: Removing technical variability in RNA-seq data using conditional quantile normalization. Biostatistics 2012, 13, 204–216. [CrossRef] [PubMed]
  32. Zheng, W.; Chung, L.M.; Zhao, H. Bias detection and correction in RNA-Sequencing data. BMC Bioinform. 2011, 12, 290. [Google Scholar] [CrossRef] [PubMed]
  33. Ashburner, M.; Ball, C.A.; Blake, J.A.; Botstein, D.; Butler, H.; Cherry, J.M.; Davis, A.P.; Dolinski, K.; Dwight, S.S.; Eppig, J.T.; et al. Gene ontology: Tool for the unification of biology. The Gene Ontology Consortium. Nat. Genet. 2000, 25, 25–29. [Google Scholar] [CrossRef]
  34. Tomczak, A.; Mortensen, J.M.; Winnenburg, R.; Liu, C.; Alessi, D.T.; Swamy, V.; Vallania, F.; Lofgren, S.; Haynes, W.; Shah, N.H.; et al. Interpretation of biological experiments changes with evolution of the Gene Ontology and its annotations. Sci. Rep. 2018, 8, 5115. [Google Scholar] [CrossRef]
  35. Chen, E.Y.; Tan, C.M.; Kou, Y.; Duan, Q.; Wang, Z.; Meirelles, G.V.; Clark, N.R.; Ma’ayan, A. Enrichr: Interactive and collaborative HTML5 gene list enrichment analysis tool. BMC Bioinform. 2013, 14, 128. [Google Scholar] [CrossRef] [PubMed]
  36. Szklarczyk, D.; Gable, A.L.; Lyon, D.; Junge, A.; Wyder, S.; Huerta-Cepas, J.; Simonovic, M.; Doncheva, N.T.; Morris, J.H.; Bork, P.; et al. STRING v11: Protein-protein association networks with increased coverage, supporting functional discovery in genome-wide experimental datasets. Nucleic Acids Res. 2019, 47, D607–D613. [Google Scholar] [CrossRef] [PubMed] [Green Version]
  37. Szklarczyk, D.; Franceschini, A.; Wyder, S.; Forslund, K.; Heller, D.; Huerta-Cepas, J.; Simonovic, M.; Roth, A.; Santos, A.; Tsafou, K.P.; et al. STRING v10: Protein-protein interaction networks, integrated over the tree of life. Nucleic. Acids Res. 2015, 43, D447–D452. [Google Scholar] [CrossRef] [PubMed]
  38. Enserink, J.M.; Kolodner, R.D. An overview of Cdk1-controlled targets and processes. Cell Div. 2010, 5, 11. [Google Scholar] [CrossRef]
  39. Loukil, A.; Cheung, C.T.; Bendris, N.; Lemmers, B.; Peter, M.; Blanchard, J.M. Cyclin A2: At the crossroads of cell cycle and cell inva-sion. World J. Biol. Chem. 2015, 6, 346. [Google Scholar] [CrossRef]
  40. Androic, I.; Kramer, A.; Yan, R.; Rodel, F.; Gatje, R.; Kaufmann, M.; Strebhardt, K.; Yuan, J. Targeting cyclin B1 inhibits proliferation and sensitizes breast cancer cells to taxol. BMC Cancer 2008, 8, 391. [Google Scholar] [CrossRef]
  41. Jezequel, P.; Campone, M.; Gouraud, W.; Guerin-Charbonnel, C.; Leux, C.; Ricolleau, G.; Campion, L. bc-GenExMiner: An easy-to-use online platform for gene prognostic analyses in breast cancer. Breast Cancer Res. Treat. 2012, 131, 765–775. [Google Scholar] [CrossRef]
  42. Jézéquel, P.; Frenel, J.-S.; Campion, L.; Guérin-Charbonnel, C.; Gouraud, W.; Ricolleau, G.; Campone, M. bc-GenExMiner 3.0: New mining module computes breast cancer gene expression correlation analyses. Database 2013, 2013, bas060. [Google Scholar] [CrossRef]
  43. Jezequel, P.; Gouraud, W.; Ben Azzouz, F.; Guerin-Charbonnel, C.; Juin, P.P.; Lasla, H.; Campone, M. bc-GenExMiner 4.5: New mining module computes breast cancer differential gene expression analyses. Database 2021, 2021, baab007. [Google Scholar] [CrossRef]
  44. Cao, L.; Chen, Y.; Zhang, M.; Xu, D.Q.; Liu, Y.; Liu, T.; Liu, S.X.; Wang, P. Identification of hub genes and potential molecular mecha-nisms in gastric cancer by integrated bioinformatics analysis. PeerJ 2018, 6, e5180. [Google Scholar] [CrossRef]
  45. Apostolou, P.; Fostira, F. Hereditary breast cancer: The era of new susceptibility genes. Biomed. Res. Int. 2013, 2013, 747318. [Google Scholar] [CrossRef]
  46. Gage, M.; Wattendorf, D.; Henry, L. Translational advances regarding hereditary breast cancer syndromes. J. Surg. Oncol. 2012, 105, 444–451. [Google Scholar] [CrossRef] [PubMed]
  47. Nimse, S.B.; Sonawane, M.D.; Song, K.S.; Kim, T. Biomarker detection technologies and future directions. Analyst 2016, 141, 740–755. [Google Scholar] [CrossRef] [PubMed]
  48. Yuan, K.; Wu, M.; Yu, X.; Zhao, X.; Feng, Y.; Li, Y.; Lv, S. Identification of The Prognostic Genes for Early Basal-Like Breast Cancer with Weighted Gene Co-Expression Network Analysis. Medicine 2021, 101, e30581. [Google Scholar] [CrossRef]
  49. Toolabi, N.; Daliri, F.S.; Mokhlesi, A.; Talkhabi, M. Identification of key regulators associated with colon cancer prognosis and pathogenesis. J. Cell. Commun. Signal 2022, 16, 115–127. [Google Scholar] [CrossRef]
  50. Pan, Z.; Li, L.; Fang, Q.; Qian, Y.; Zhang, Y.; Zhu, J.; Ge, M.; Huang, P. Integrated Bioinformatics Analysis of Master Regulators in Anaplastic Thyroid Carcinoma. Biomed. Res. Int. 2019, 2019, 9734576. [Google Scholar] [CrossRef]
  51. Mo, X.C.; Zhang, Z.T.; Song, M.J.; Zhou, Z.Q.; Zeng, J.X.; Du, Y.F.; Sun, F.Z.; Yang, J.Y.; He, J.Y.; Huang, Y.; et al. Screening and identification of hub genes in bladder cancer by bioinformatics analysis and KIF11 is a potential prognostic biomarker. Oncol. Lett. 2021, 21, 205. [Google Scholar] [CrossRef] [PubMed]
  52. Suman, S.; Mishra, A. Network analysis revealed aurora kinase dysregulation in five gynecological types of cancer. Oncol. Lett. 2018, 15, 1125–1132. [Google Scholar] [CrossRef] [PubMed] [Green Version]
Figure 1. The overall research flowchart.
Applsci 13 02403 g001
Figure 2. Array-Array Intensity Correlation (AAIC).
Applsci 13 02403 g002
Figure 3. The top 40 genes that were highly enriched in the KEGG pathways.
Applsci 13 02403 g003
Figure 4. Full PPI network of the differentially expressed breast cancer genes.
Applsci 13 02403 g004
Figure 5. The PPI indicating selected nodes with at least 13 edges. Dark red indicates high degree, light red denotes low degree.
Applsci 13 02403 g005
Figure 6. PPI network presentation with red nodes indicating the up regulated genes and green nodes denoting down regulated genes. The node size indicates node degree.
Applsci 13 02403 g006
Figure 7. Hub gene network identified and ranked based on (a) MNC, (b) MCC, and (c) node degree. The nodes with red colour have higher MNC, MCC, or node degree in the network. The nodes with colour between red and yellow have medium MNC, MCC, or node degree, and the nodes with yellow colour have the lower MNC, MCC, or node degree in the network.
Applsci 13 02403 g007
Figure 8. Overlapped hub genes from the MNC, MCC, and node degree methods.
Applsci 13 02403 g008
Figure 9. The prognostic value analysis of the eight hub genes in breast cancer using the bc-GenExMiner v4.6 web portal. Expression levels of the eight hub genes (CDK1, KIF11, CCNA2, TOP2A, ASPM, AURKB, CCNB2, and CENPE) are significantly associated with the OS of patients in breast cancer (all p < 0.05, HR > 1).
Applsci 13 02403 g009aApplsci 13 02403 g009b
Figure 10. Association between the eight hub genes expression levels and clinicopathological variables (a) age, (b) nodal status, and (c) TNBC & basal-like BC in breast cancer.
Applsci 13 02403 g010aApplsci 13 02403 g010b
Table 1. Metadata for the microarray and RNASeq datasets.
Accession NumberTotal SamplesSelected SamplesPlatformCountryReference
GSE22820186 samples
Sample type:
10 Normal
176 Tumor
AllGPL6480 Agilent-014850 Whole Human Genome Microarray 4 × 44 KCanadaLiu et al. [19]
GSE45827155 samples
Sample type:
11 Normal
14 Human Cell line
130 Tumor
141 samples
Sample type:
11 Normal
130 Tumor
GPL570 [HG-U133_Plus_2] Affymetrix Human Genome U133 Plus 2.0 ArrayFranceGruosso et al. [20]
GSE70905137 samples
Sample type:
47 Normal
43 Mammaplastic reduction
47 Tumor
94 samples
Sample type:
47 Normal
47 Tumor
GPL4133 Agilent-014850 Whole Human Genome Microarray 4 × 44 K G4112FUSAQuigley et al. [21]
TCGA-BRCA1208 samples
Sample type:
113 Normal
1095 Tumor
AllIllumina HiSeqGlobalPan-Cancer Atlas [16,22]
Table 2. The top 10 enriched GO terms in which the DEGs were significantly enriched, in the biological process group.
GO Termp-ValueOdds RatioCombined Score
extracellular structure organization (GO:0043062)1.11266 × 10−125.849043160.9906308
external encapsulating structure organization (GO:0045229)1.25244 × 10−125.817629159.4375212
microtubule cytoskeleton organization involved in mitosis (GO:1902850)4.23453 × 10−127.754571203.0747621
extracellular matrix organization (GO:0030198)3.93235 × 10−114.510988108.0796636
positive regulation of cell cycle process (GO:0090068)1.64727 × 10−97.497769151.6359712
regulation of cell migration (GO:0030334)1.88723 × 10−93.54654571.24355836
mitotic spindle organization (GO:0007052)9.2914 × 10−95.424761100.3264924
endoderm formation (GO:0001706)2.56083 × 10−814.10305246.5261963
mitotic cytokinesis (GO:0000281)5.77801 × 10−810.6279177.1311462
positive regulation of protein kinase B signaling (GO:0051897)7.59979 × 10−84.96123481.32732181
Table 3. The top 10 enriched GO terms in which the DEGs were significantly enriched, in the molecular function group.
GO Termp-ValueOdds RatioCombined Score
protein homodimerization activity (GO:0042803)1.82 × 10−62.45959337632.51094586
platelet-derived growth factor binding (GO:0048407)5.68741 × 10−630.30218069365.9672024
microtubule motor activity (GO:0003777)1.7457 × 10−57.00072124176.69830849
microtubule binding (GO:0008017)1.89485 × 10−53.29533309935.83274576
tubulin binding (GO:0015631)3.43055 × 10−52.85748154229.37549443
motor activity (GO:0003774)6.71537 × 10−55.76955099655.43688284
actin binding (GO:0003779)9.57553 × 10−53.40352733731.49526963
receptor ligand activity (GO:0048018)9.98683 × 10−52.71268038324.98828531
cell-cell adhesion mediator activity (GO:0098632)1.19521 × 10−47.28893058265.8337387
metalloendopeptidase activity (GO:0004222)3.63166 × 10−44.50127699135.65303972
Table 4. The top 10 enriched GO terms in which the DEGs were significantly enriched, in the cellular component group.
GO Termp-ValueOdds RatioCombined Score
collagen-containing extracellular matrix (GO:0062023)4.04 × 10−124.231518111.0119
microtubule (GO:0005874)5.27 × 10−74.31735862.40844
spindle (GO:0005819)1.2 × 10−64.06569255.43982
polymeric cytoskeletal fibre (GO:0099513)1.93 × 10−63.48952245.92285
cell-substrate junction (GO:0030055)3.54 × 10−62.85301435.81027
spindle microtubule (GO:0005876)4.96 × 10−67.1805487.70782
focal adhesion (GO:0005925)7.4 × 10−62.79239832.98852
cell-cell junction (GO:0005911)1.54 × 10−42.77969724.40338
platelet alpha granule (GO:0031091)1.56 × 10−44.57075540.05538
actin-based cell projection (GO:0098858)3.98 × 10−44.4402234.76533
Disclaimer/Publisher’s Note: The statements, opinions and data contained in all publications are solely those of the individual author(s) and contributor(s) and not of MDPI and/or the editor(s). MDPI and/or the editor(s) disclaim responsibility for any injury to people or property resulting from any ideas, methods, instructions or products referred to in the content.

