
Temporal and Spatial Changes in Soil Organic Carbon in a Semi-Arid Area of Aohan County, Chifeng City, China
1
College of Desert Control Science and Engineering, Inner Mongolia Agricultural University, Hohhot 010018, China
2
Key Laboratory of Desert Ecosystem Conservation and Restoration, State Forestry and Grassland Administration of China, Hohhot 010018, China
*
Author to whom correspondence should be addressed.
Water 2023, 15(18), 3253; https://doi.org/10.3390/w15183253
Submission received: 16 August 2023
/
Revised: 31 August 2023
/
Accepted: 7 September 2023
/
Published: 13 September 2023
(This article belongs to the Special Issue Rainfall and Water Flow-Induced Soil Erosion-Volume 2.0)
Abstract
:Soil organic carbon (SOC) plays a crucial role in arid zones, while land-use change could lead to changes in the balance of SOC. Therefore, the aim of this study was to determine the impact of land-use change on the temporal and spatial variability in SOC at the county scale. A semi-arid zone (Aohan County, Northeast China) covering a surface of 3800 km2 was selected for this study. SOC data for 65 and 182 soil samples from 1985 and 2021, respectively, were collected for major land-use types (forestland, farmland, grassland, and sandy land) across Aohan County to a depth of 20 cm. The impacts of different land-use types and land-use changes on SOC were evaluated. The results showed that land-use change enhanced the spatial variability in SOC over the last 36 years. The mean SOC in 2021 (7.49 g kg−1) was significantly higher than that in 1985 (6.91 g kg−1). Converting sandy land into grassland and farmland into forest or grassland would lead to significant accumulation of SOC, while the depletion of SOC occurred after grassland afforestation. The balance between aboveground biomass inputs and SOC decomposition was the determining reason that affected the accumulation of SOC. Vegetation restoration due to land-use change could alter both soil texture and the C/N ratio and could have positive effects on ecosystem recovery.
1. Introduction
Soil is the largest carbon pool in terrestrial ecosystems, and it is equal to the sum of the atmospheric and biotic carbon pools [1]. It is widely accepted that land-use change affects the balance of soil organic carbon (SOC) and, hence, may cause the modification of global terrestrial C cycling [2]. Land-use change would lead to an associated change in the soil carbon pool [3]. The change from one ecosystem to another could result in dynamic changes in SOC. Particularly, a change in land cover or improper soil-use types may impair C cycling, thereby decreasing SOC contents and increasing CO2 emissions [4]. So, better knowledge of the characteristics of land-use change will help to explain the characteristics of spatiotemporal variations in SOC.
Land-use change is an important factor affecting the storage and decomposition of SOC. For example, Post and Kwon [5] pointed out that returning farmland to forest or grass has been proposed as a promising way to increase soil carbon storage. At the same time, many scientists have pointed out the significant decrease in soil carbon as a result of the conversion of forests or natural vegetation into farmland [6,7,8]. Similarly, afforestation is known to be an effective measure for ecological remediation, while some studies have pointed out that afforestation would lead to a decrease [9] or an increase [10,11] in SOC. Those different results depended on different factors [12] due to different environments and the land-use ages of the studied sites, which may distort the effects of land use [3]. These dramatic changes in vegetation cover are expected to modify the soil properties and microclimate, as it takes a long time for them to stabilize and establish a new balance of C cycling [13].
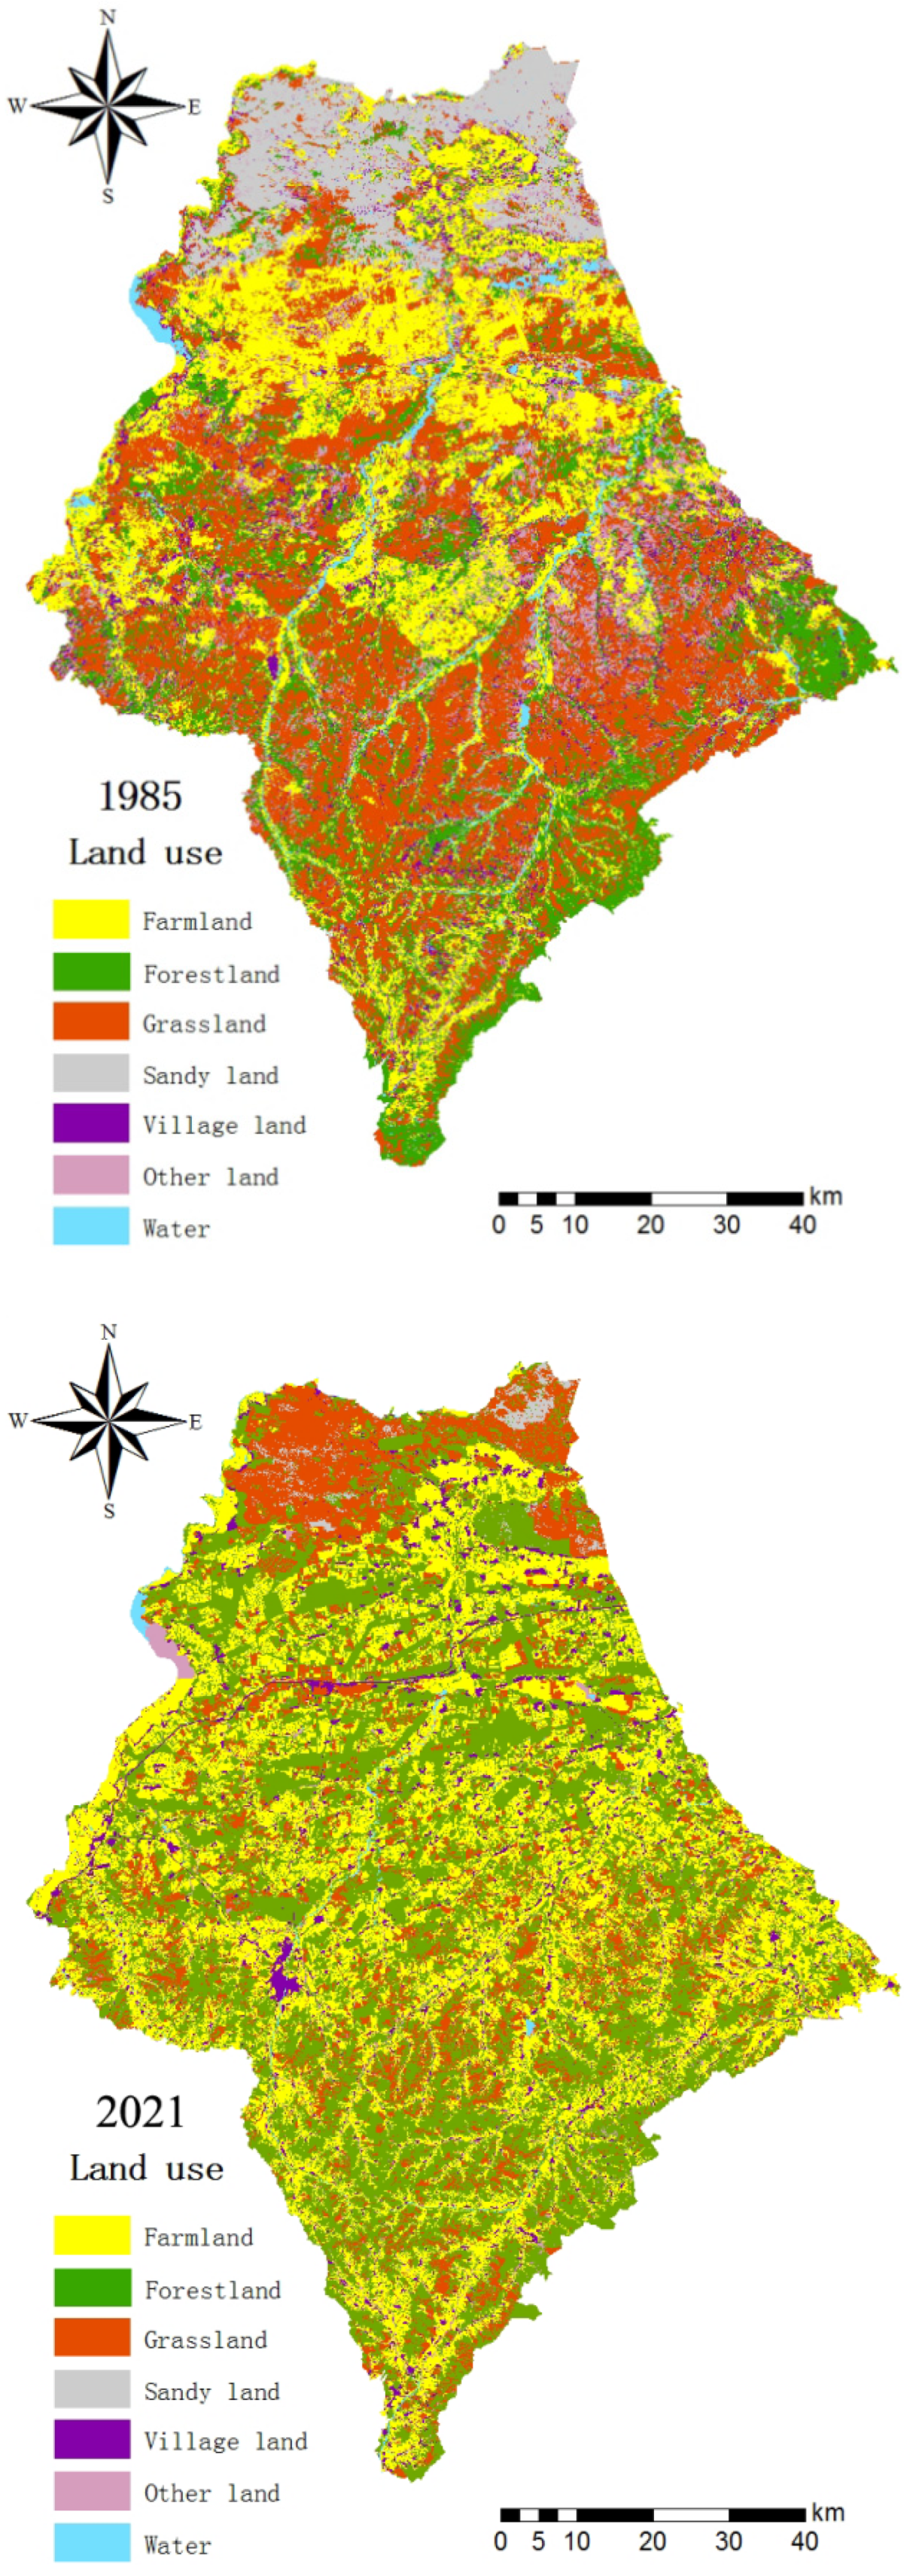
With the development of urbanization, China has experienced dramatic and unprecedented land-use changes over the last 36 years. Many kinds of land-use changes occurred rapidly and widely, especially in projects for returning farmland to forests, which have been an important act of ecological engineering in forestry and have been implemented since 1999 in China. So far, the area of farmland afforestation has been 9.27 × 10⁵ km2, with a high preservation rate of 98.4%, which causes carbon fixation of 3.4 × 10⁷ t per year and oxygen release of 8.2 × 10⁷ t per year [14]. Returning farmland to forests will be a long-term project in China. It was estimated that there would be 28,268.08 km2 of slope farmland and serious desertification suitable for returning farmland to forests and grasslands by 2020. However, for a long time, a lack of data spanning different time periods meant that the study of the soil carbon pool was confined to carbon reserve estimates made at specific points in time [15]. On the other hand, it is difficult to obtain information on land-use age and history in many cases. It takes decades to centuries for SOC to equilibrate, so it is more important to investigate the difference in SOC on a temporal scale [16].
This study took Aohan County of Chifeng City, Inner Mongolia, as the research object and used remote sensing, GIS, and other tools to determine the sampling location of Aohan County through indoor simulation and field investigation. We also carried out profile sampling. Classical statistics and geostatistics were used to analyze the spatial heterogeneity and distribution pattern of SOC content in the study area, reveal the leading factors affecting its spatial variation, and estimate the SOC storage and distribution characteristics. Based on the investigation of the SOC content in Aohan County in 1985 and 2021, the changing characteristics of SOC storage during the period of 1985–2021 were analyzed, and the effects of different land-use types and land-use changes on SOC were evaluated in order to better predict future spatial changes in SOC in the study area, and provide a reference for accurate fertilization, and scientific and rational use of land resources.
2. Materials and Methods
2.1. Study Site
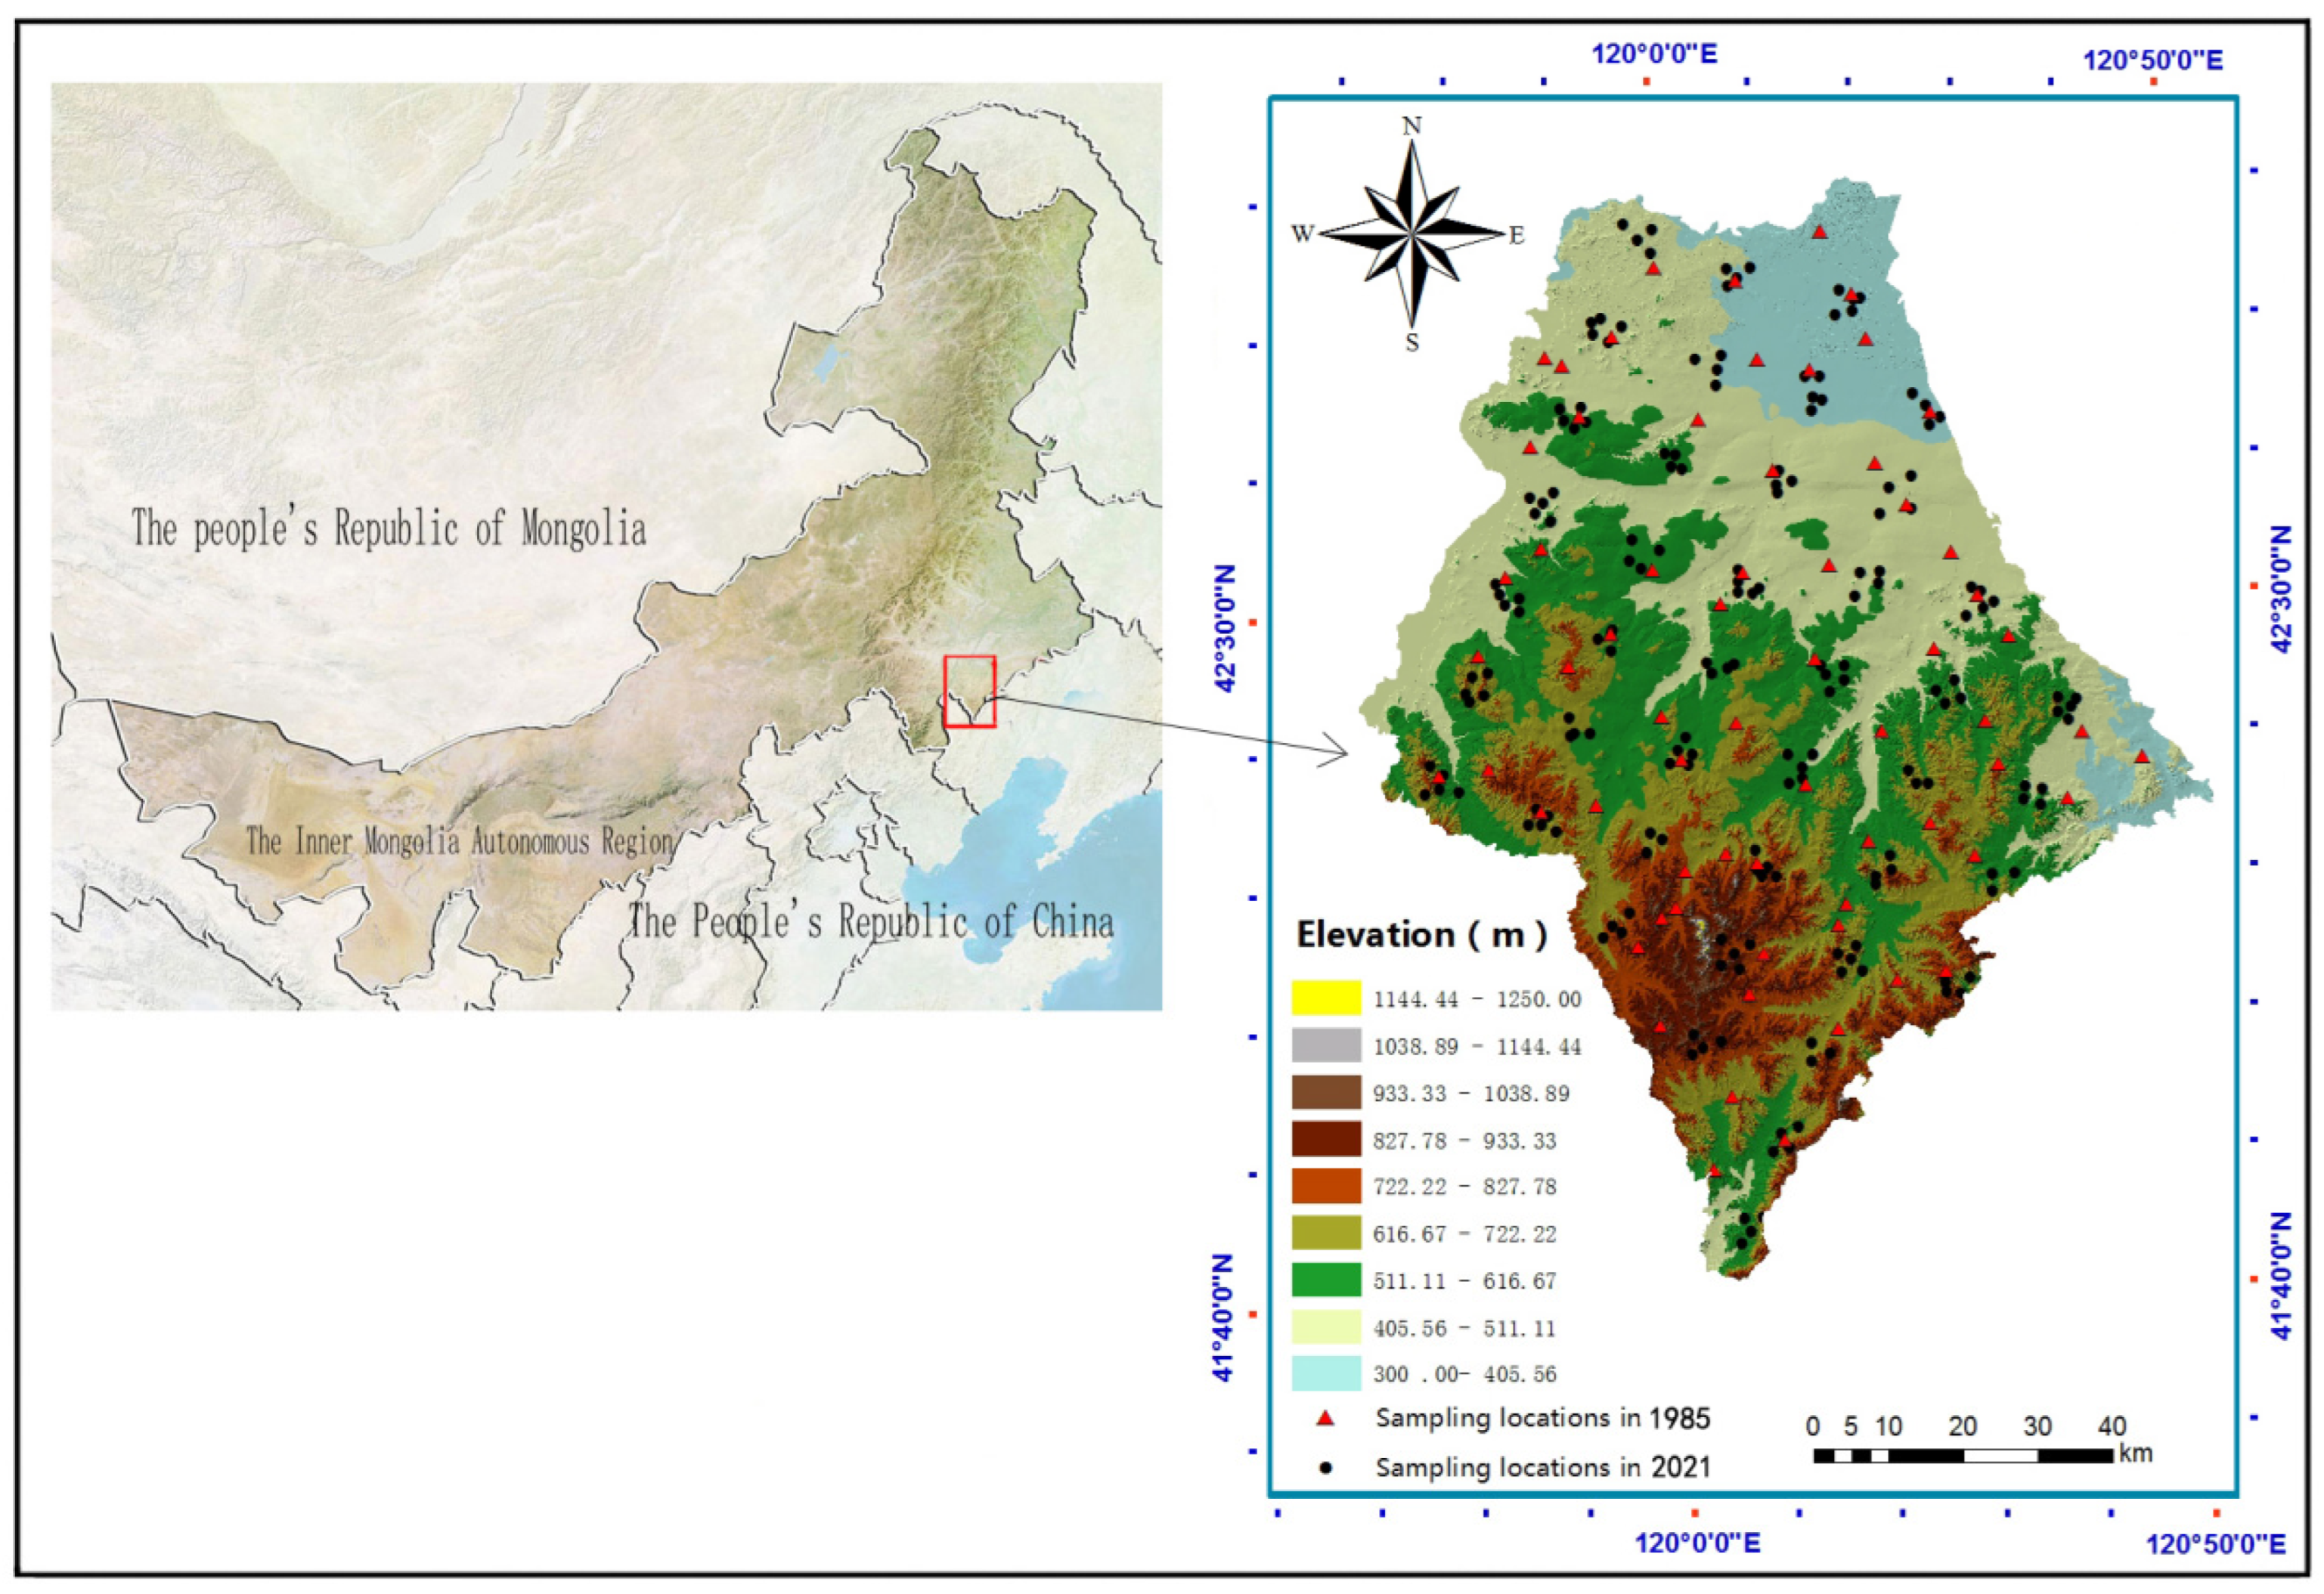
The study site, Aohan County (41°42′–42°02′ N, 119°30′–120°54′ E), is located in Inner Mongolia Autonomous Region, Northeast China. The climate of the study area, covering a surface of 8300 km2, is a semi-arid temperate continental climate. The mean annual atmospheric temperature is 6 °C, with a maximum temperature of 39.7 °C and a minimum temperature of −30.9 °C. The mean annual precipitation is 310–460 mm. The mean annual evaporation ranges from 2000 to 2600 mm. The elevation ranges from 300 to 1250 m (Figure 1). Four types of soil are distributed in the study area. From north to south, they are brown earth, cinnamon soil, chestnut soil, and aeolian sandy soil.
2.2. Soil Sampling
In this study, the SOC data that were taken in 1985 for 65 sites and records on sampling locations were obtained from the Bureau of Land and Resources of Inner Mongolia Autonomous Region, China. Soil data for 2021 were collected from different types of soil plots in the study area, for a total of 182 soil plots (Table 1). Different land-use types were taken into account to determine the distribution of the sites (Figure 2). In order to explain the influence of land-use change on SOC, these sites comprised the following four types of land-use change: farmland to forestland, farmland to grassland, grassland to forestland, and sandy land to grassland. A total of 24 sites from 1985 were collected as the reference sites and these 24 sites have not undergone significant land-use changes in at least the last 100 years. At the same time, the corresponding 24 sites in 2021 were collected as the conversion sites; they had existed in the present land-use type for at least 20 years and were chosen to ensure that the major effects of SOC dynamics had already occurred. All of the conversion sites were situated directly adjacent to the reference sites to maintain consistent environmental conditions.
After determining the sites, 4 sampling points were arranged in an “S”-shaped distribution; the interval between the profiles was about 5 m. Surface soil samples (0–20 cm) were collected at each sampling point. The soil samples from each sampling point were evenly mixed into one sample to describe the characteristics of that sampling location. The soil samples were then cleaned for subsequent measurement of the SOC content. The SOC content was measured by using dichromate oxidation and titration with ferrous ammonium sulfate. Total N was measured by using the semi-micro Kjeldahl method [17]. The soil texture (clay, silt, and sand) was measured with a Mastersizer 3000 (Malvern Instruments Ltd., Malvern, UK).
2.3. Geostatistics
The spatial variability and spatial autocorrelation of SOC were analyzed by using a semivariogram of the geostatistics. A semivariogram is a basic tool of geostatistics that represents the mathematical expectation of the square of the regional variable Z(xi) and the increment Z(xi + h), namely, the variance of the regional variable. Its general form is as follows:
where Z(xi) and Z(xi + h) represent the measured values for the SOC content at location xi. Xi + h and r(h) are the semivariance for a lag distance h, and N(h) is the number of data pairs separated by h.
The nugget value (C0) and sill (C + C0) are important parameters in semivariograms. Based on the theory of geostatistics, the nugget value (C0) is expressed by the experimental error, which is less than the actual sampling-scale variation caused by the random part, namely, the spatial heterogeneity. The sill (C + C0) usually represents the total variation in system space, the ratio of the nugget and sill (C0/C + C0) describes the degree of the system variables of the spatial correlation, and (C0/C + C0) indicates the spatial variability caused by the random part, which accounts for the proportion of the total system variance. The values of <0.25, 0.25–0.75, and >0.75 can show strong, moderate, and weak spatial autocorrelation in SOC, respectively [18].
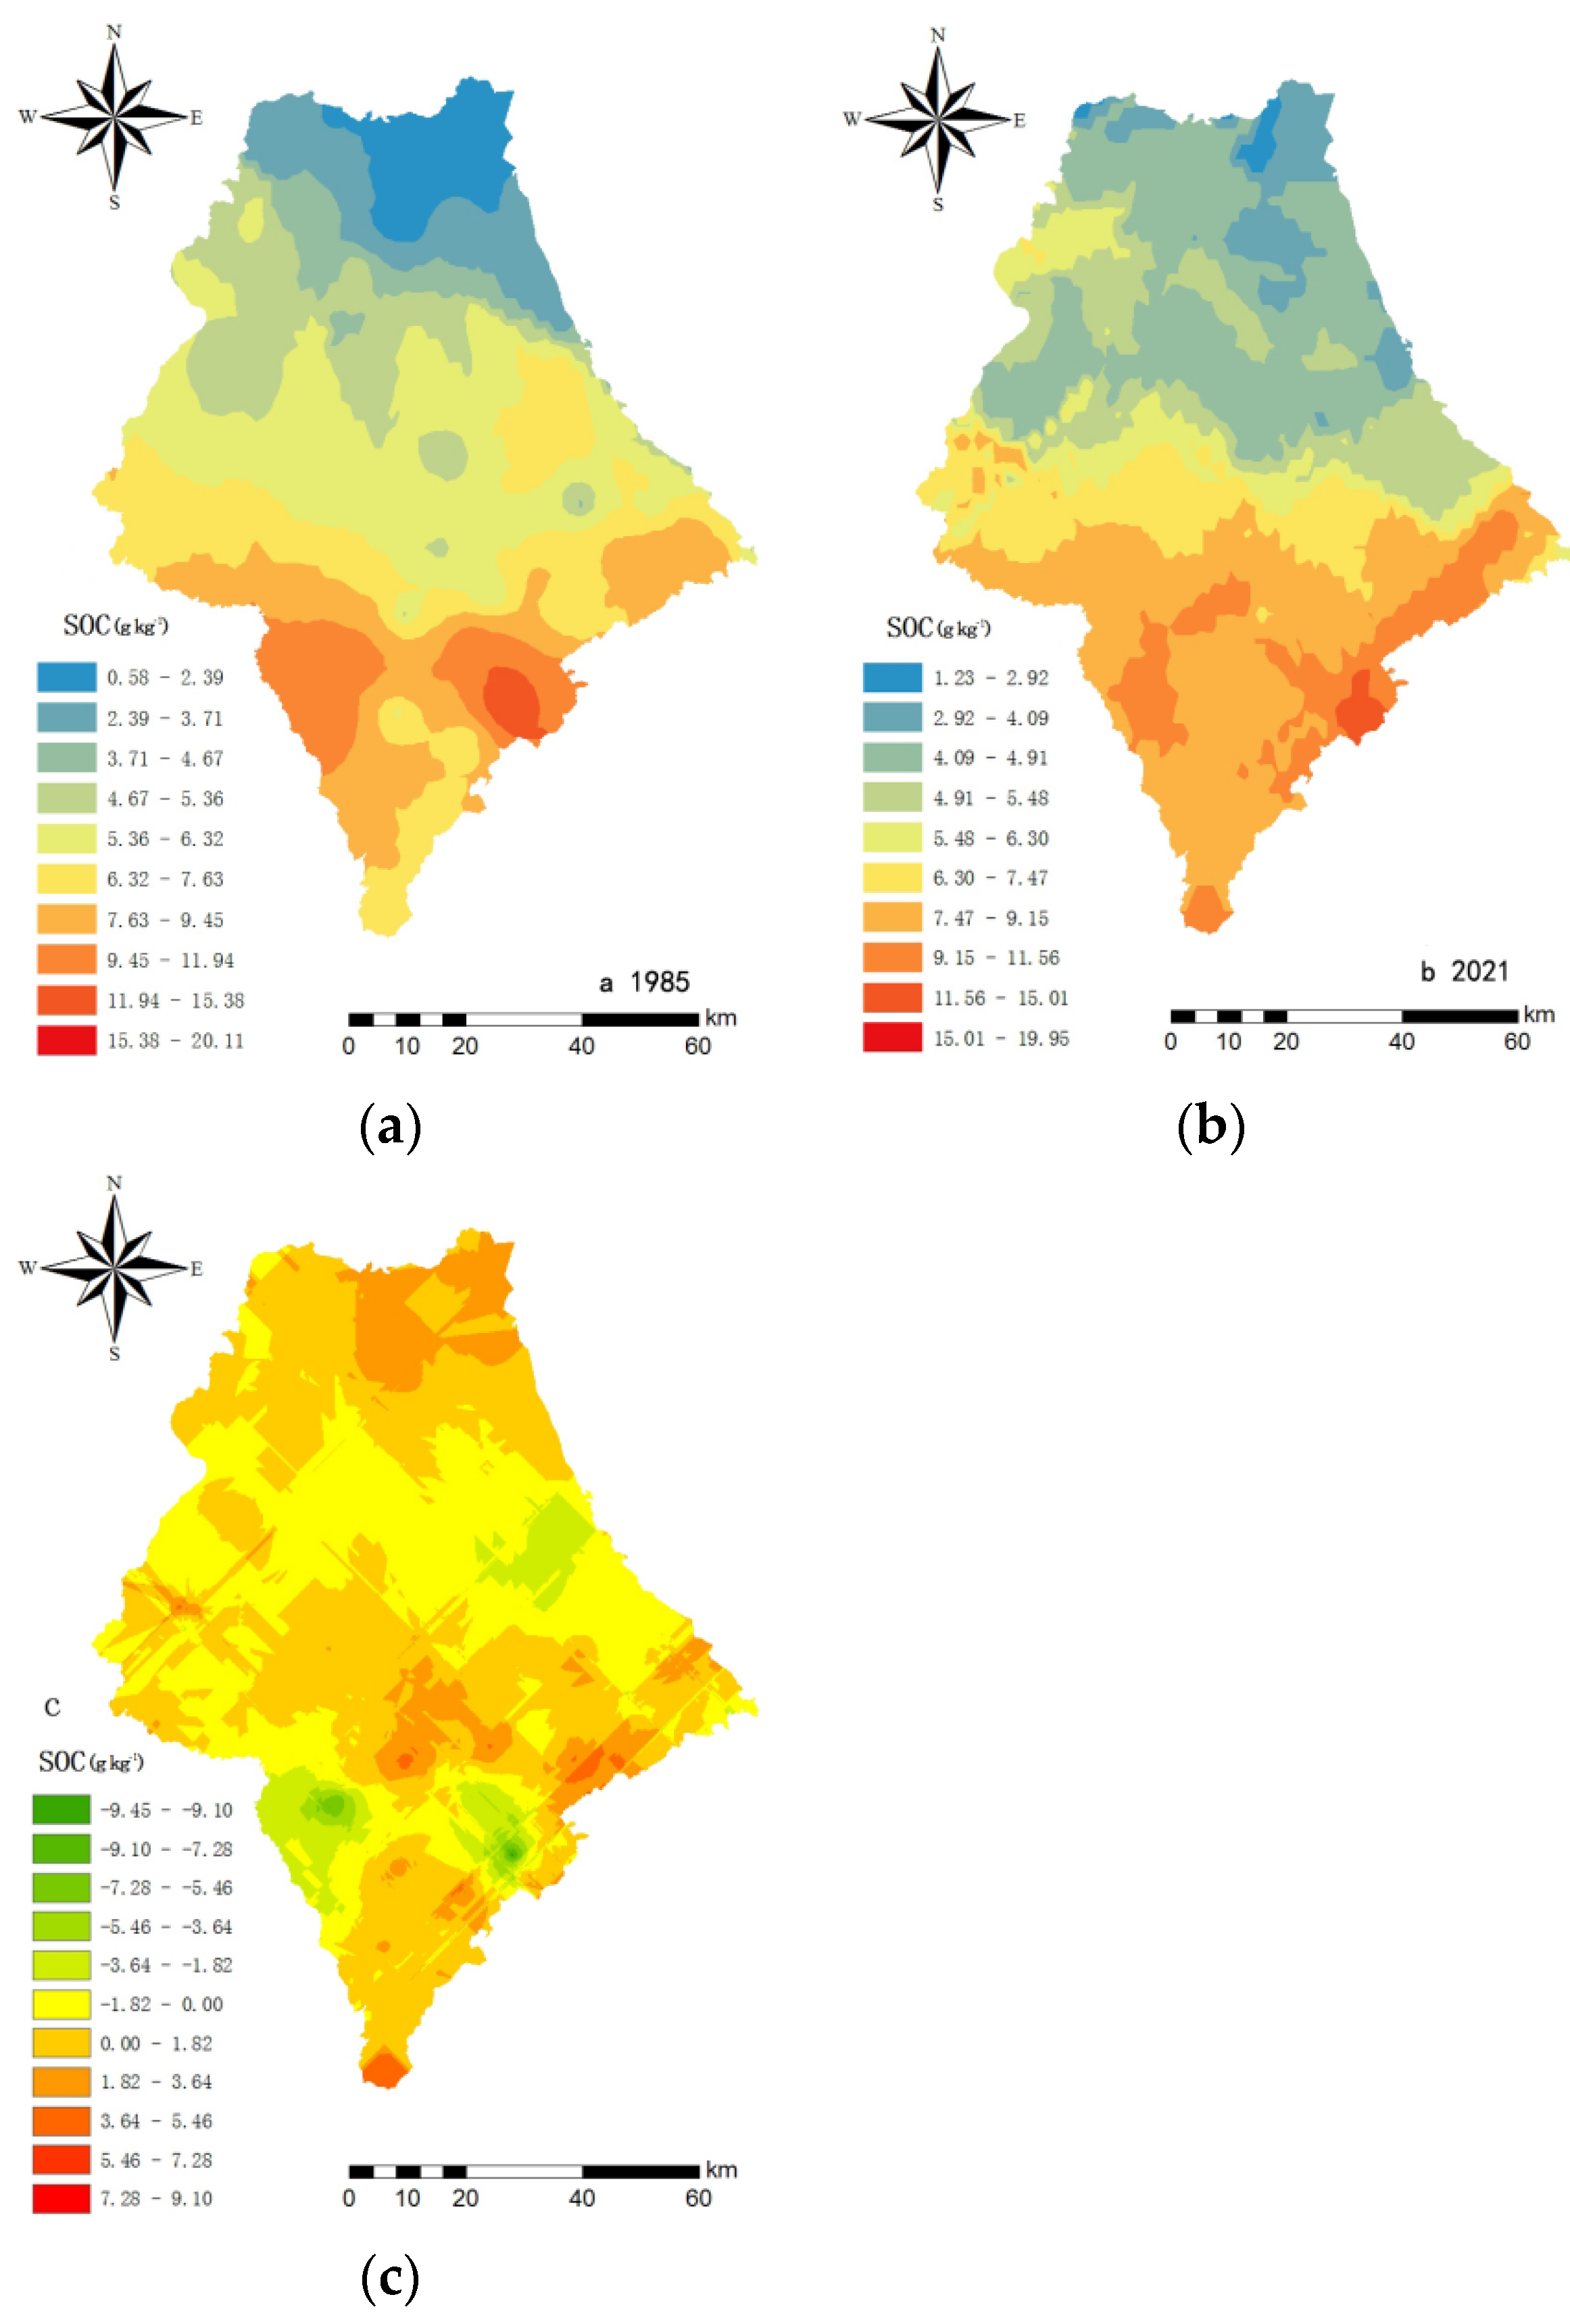
A semivariogram analysis was carried out by using GS + 7.0 [19]. Ordinary kriging was used to estimate the SOC content at the unsampled locations. The optimal theoretical model was determined by the determining coefficient (R2) and the least residual sums of squares (RSSs). Predicted maps of the SOC content in 1985 and 2021 were created with ArcGIS10.0 (Figure 3). The predicted maps of the SOC content were tested through cross-validation.
2.4. Statistical Analysis
Prior to the analysis, the data were examined for normality with the Kolmogorov–Smirnov test. Descriptive statistics for the SOC data from 1985 and 2021 were obtained to gain a preliminary understanding of the datasets. The differences in SOC content between the different periods and land types were examined by using ANOVA with a Tukey test for multiple pairwise comparisons. All data were analyzed using R 3.0.1 software.
3. Results and Discussion
3.1. Descriptive Statistical Analysis of SOC
The distributions of SOC content in 1985 and 2021 were similar, indicating that the SOC content in the northeast was relatively low and gradually increased toward the southwest (Figure 3). The distribution of SOC content in 1985 showed an island-like pattern; the low-SOC-value zones were mainly distributed in the northeast, and the SOC level in the south central zone was greater (Figure 3a). By 2021, the SOC content in most areas was higher than that in 1985, and the distribution patterns showed a strong variability with a north–south trend, which showed a transition from a high to a low distribution (Figure 3b). The lowest SOC content in 1985 and 2021 was still found in the northeast (Figure 3c), and the overall trend of the SOC distribution patterns did not significantly change between 1985 and 2021.
The results of the descriptive statistical analysis (Table 2) showed that there was a significant difference in SOC between 1985 and 2021 according to the results of ANOVA (p < 0.05). The results indicated that, on average, the SOC increased from 1985 to 2021 in the top 20 cm of soil. The statistical data showed that the coefficient of variation of the SOC was in the range from 40.96 to 50.73%, illustrating that the SOC content exhibited a moderate discrete degree in 1985 and 2021, although the SOC in 2021 showed higher variability. Skewness and kurtosis were able to reflect the distribution characteristics of SOC. The SOC content in 2021 was represented by a normal distribution, whereas that in 1985 was not well represented by a normal distribution.
3.2. Analyses of the Spatial Structures of SOC
The data from 1985 that did not conform to a normal distribution needed to be square-root transformed and fitted for the semivariance function. A comparison of the precision of fitting with different models, the theoretical model, and the parameters of the semivariogram for the SOC content are presented in Table 3. The SOC content in 2021 was fitted with a spherical model, whereas the SOC content in 1985 was fitted with an exponential model. C0/(C + C0) of the SOC in 2021 was 36.61% (Table 3). Both the structural factors and random factors had influences on the spatial variability of SOC. The proportion of spatial variability caused by the random part in 2021 was 36.61%, showing a moderate spatial dependence. In contrast, C0/(C + C0) of the SOC in 1985 was far lower than 25%, indicating that the spatial variability in the SOC was mainly caused by structural factors with a strong spatial autocorrelation; the spatial variability caused by the random factors was decreased and the structural factors gradually became dominant. The possible causes for the spatial variability derived from structural factors were the topographical factors, climatic factors, and soil parent materials, which strengthened the spatial correlation of SOC. The random factors, which were mainly derived from drastic human activities, weakened the spatial correlation of the SOC content [18]. This was in agreement with the trend of the decrease in the values of the semivariogram from 18.3 km for 1985 to 2.1 km for 2021.
3.3. SOC Content according to the Change in Land-Use Types
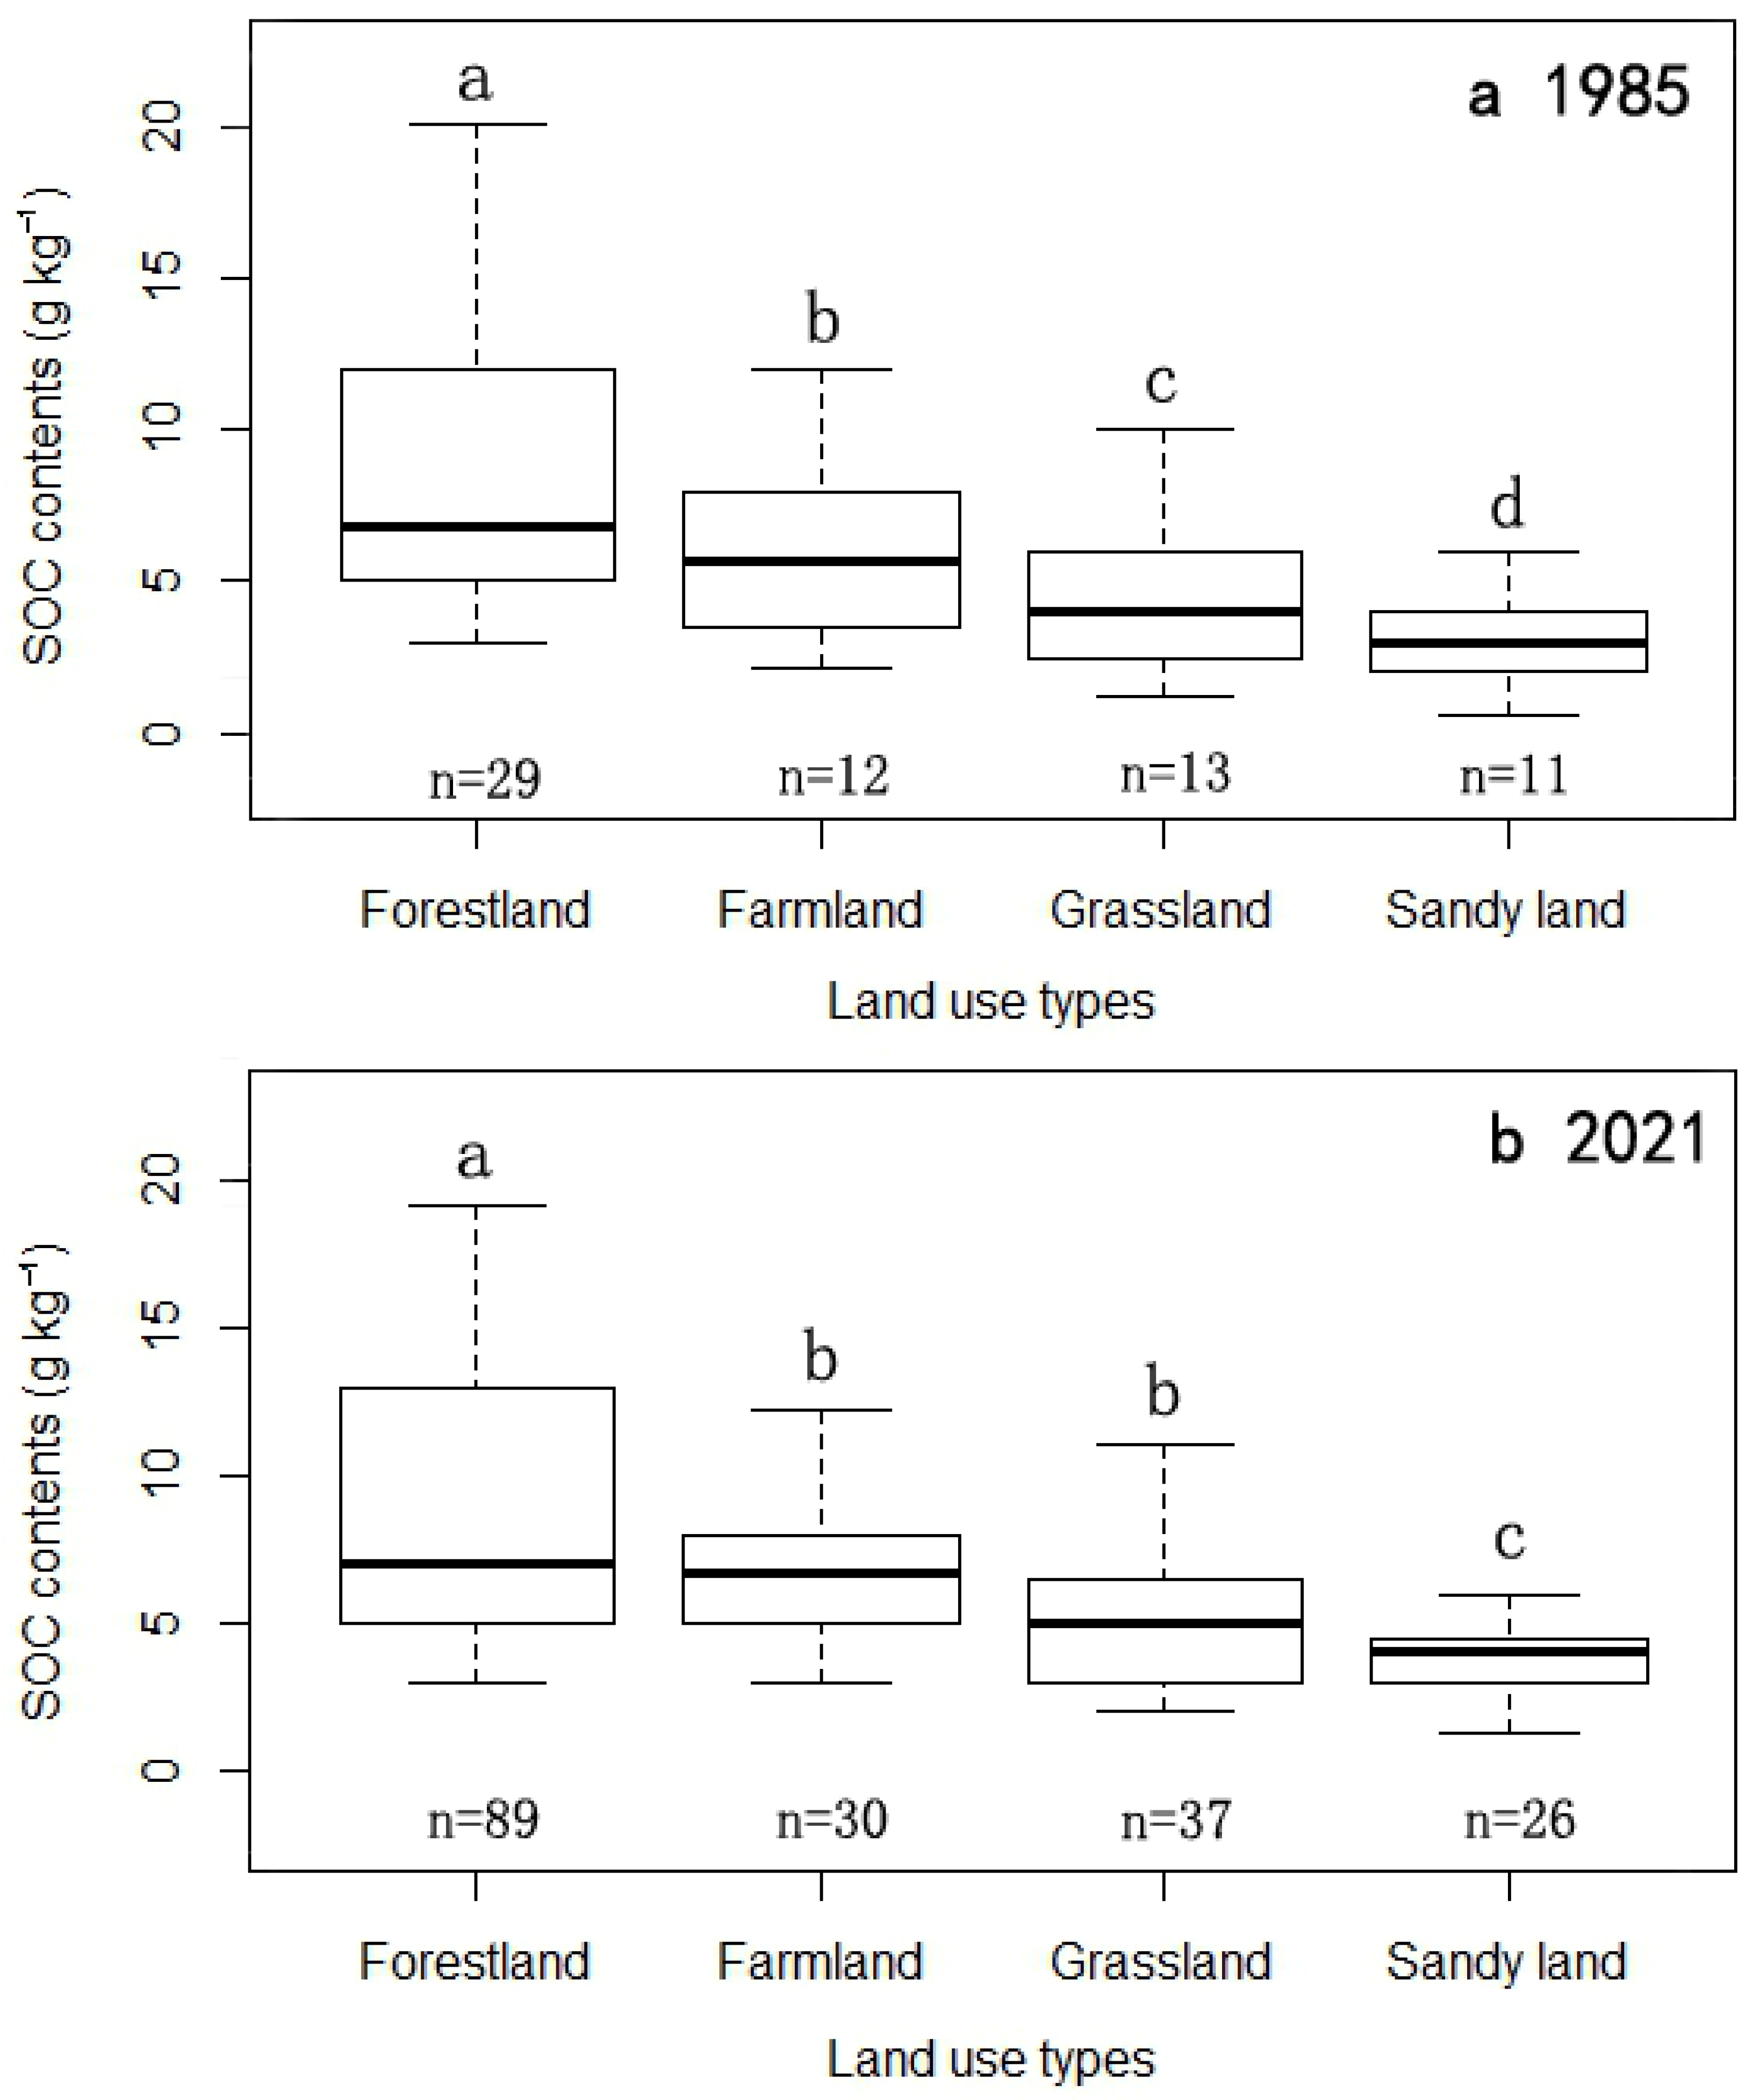
The mean SOC content was significantly different among the land-use types in 1985 and 2021 according to the ANOVA (p < 0.05) (Figure 4). The SOC content exhibited a significant order from high to low: forestland > farmland > grassland > sandy land. Considering the soil of forestland as a reference, the farmland and grassland showed a decrease in the mean SOC of approximately 30%, and the mean SOC content was reduced by almost 56% in sandy land.
The SOC content was different when one land-use type had been changed to another land-use type (Table 4). Farmland-to-grassland conversion led to the greatest increase in the total accumulation of mean SOC content of 4.21 g kg−1, which was similar to the SOC accumulation after farmland afforestation (2.01 g kg−1). Major depletion of SOC occurred after converting grassland into forestland (−1.43 g kg−1). At the same time, a significant accumulation of SOC was found after conversion of sandy land into grassland.
4. Discussion
4.1. Spatial Distribution Characteristics of SOC
The spatial heterogeneity of SOC is an unavoidable problem in the soil carbon pool. Jobbágy pointed that about 59% of the SOC is stored below a depth of 20 cm [20]. The current research on the spatial variations in SOC mostly focuses on the surface soil, and the variations in surface SOC are also complex. Therefore, research on spatial variations in SOC has greater requirements for the number of samples. On the time scale, the differences in the accumulation, decomposition, and transformation efficiency of soil organic matter would show different characteristics with time, and the passing of time would strengthen the original differences [21]. For example, affected by Horqin sandy land, the northern part of this study area had strong wind and sand activities, with sparse vegetation, very low coverage, and serious wind erosion. As a result, the accumulation of SOC in the area with aeolian sandy soil worsened year by year. However, in the middle of Aohan county, the rainfall was more than 450 mm, and the soil type also changed from cinnamon soil and chestnut soil to cinnamon soil and brown soil. The main vegetation type was forest vegetation and the litter under the forest was enriched with a large amount of organic matter, which is an important source of SOC. As time went on, the difference in SOC content between the different regions became more and more obvious, which led to great differences in SOC in the local areas. On the spatial scale, the horizontal distribution of SOC in the study area was high in the south and low in the north. Aohan county is located in a semi-arid area and the north is connected with Horqin sandy land, so the soil fertility level is not high as a whole. However, there are obvious differences in soil and vegetation between the south and north of Aohan county. The zonal distribution of vegetation from south to north was forest vegetation, herb vegetation, and sandy vegetation. Vegetation and soil have interacted in the region for a long time. The zonal distribution of soil controls the distribution of vegetation and comprehensively affects the horizontal distribution of SOC. Studies in different regions have verified that the soil type is an important environmental factor that changes the differences in the spatial distribution of SOC [22]. Aboveground vegetation is an important source of SOC, and differences in SOC are obvious with different vegetation types. On a small scale, the distribution of SOC with different species of trees in areas with the same soil type showed great differences. On a large spatial scale, the communities of vegetation showed obvious regional characteristics, and the SOC was more obviously affected by the zonal distribution of vegetation [23]. At the county level, the distribution of vegetation from south to north was characterized by a transition from forest vegetation to xerophytes and then to sandy vegetation [24]. Meng et al. pointed out that the zonal vegetation in Inner Mongolia was closely related to the distribution of SOC [25]. They suggested that the carbon sequestration effect of temperate forest vegetation was the best, followed by that of temperate shrub vegetation, and the carbon sequestration values of meadow and desert vegetation were the lowest, which verified the conclusions of this study. In this study, there were no significant changes in climate and temperature within the study area. The sensitivity of SOC to external environmental changes was mainly reflected in the vegetation, water, and terrain. At present, in studies on similar scales, more attention is paid to the correlation between environmental factors and the overall SOC; such studies generally come to the conclusion that vegetation, soil bulk density, water content, topography, and other factors affect the average content of organic carbon in the whole soil profile [26,27].
The distribution of SOC in different times and spaces showed great differences. In this study, the changes in SOC before and after 30 years were analyzed on a time scale. The results showed that, through the restoration of vegetation and rational allocation of land use, the SOC content was significantly higher than that 30 years before. Xueqi et al. suggested that changes in land-use modes were the main driving force affecting spatio-temporal variations in SOC, which was consistent with the conclusion of this study [27]. However, vegetation restoration mainly enhanced the capacity for conserving SOC by controlling regional water and soil loss. Due to the increase in the duration of vegetation restoration, the growth of vegetation tends to stabilize the community and greatly improves soil fertility. Especially in the sandy soil area, there was much room for an increase in SOC, and the potential for soil carbon fixation was high [28]. This study also pointed out that the growth rate of SOC was the highest in the aeolian sandy soil area in the north of Aohan County after 30 years of vegetation restoration. Peng et al. showed that SOC reserves were increased by 19.21% after 30 years of returning farmland to forests in a loess hilly region [29]. Li et al. also suggested that SOC increased and other soil properties changed after years of returning farmland. This was consistent with the obvious soil improvement due to the changes in land-use modes found in this study [30]. However, the research on the time scale was mainly limited by the shortage of historical data; a complete time series of soil data was extremely difficult to obtain and short-term research would not be enough to reflect the dynamic change trends in SOC. Therefore, space is often used to replace methods focused on time or a comparative analysis of time points could be carried out. The dynamic simulation and prediction of future SOC are still important directions for soil carbon pool research.
4.2. The Influence of Land-Use Types on SOC Content
Land-use changes such as tillage, afforestation, and urban expansion have taken place on a massive scale and have weakened the spatial correlation of SOC [31,32,33]. Juan et al. [34] also found that surface soil was most directly influenced by land-use change and the impact was gradually enhanced by the spatial variability in SOC. This finding is in agreement with those of previous studies by Assad et al. [35] and Martin et al. [36]. This is mainly because the different land uses and managements affect the inputs of organic residues. One of the main sources of SOC is surface litter; because of the high levels of litter inputs in forests, the SOC in forestland was significantly higher than that of other land-use types [37]. In the present work, more SOC was found in forestland than in farmland. This was related to lower input, an increased microbial availability of organic matter [38], the deterioration of SOC stabilization due to tillage, and a subsequent mineralization of SOC promoted by increased soil temperature [6,8]. The higher forestland root turnover might also explain the greater SOC accumulation in forestland than in farmland because root-derived carbon is regarded as a major source of SOC [39]. At the same time, the SOC content of sandy land was less than half of forestland. The desertification of land is an important threat, as it causes a decrease in SOC. The lowest SOC content in sandy land was likely caused by soil erosion because of the low vegetation coverage and the aeolian environment [40].
Changes in land-use types are key factors influencing SOC content. Christopher and Axel [41] pointed out SOC accumulation after a land-use change from farmland to grassland and forestland. Several studies also showed that the afforestation of grassland would lead to a depletion of SOC [42,43,44]. Afforestation significantly alters SOC storage due to plant residual inputs. However, SOC accumulation following afforestation is largely induced by both the increased biomass input and decreased SOC decomposition [45,46]. In this study, a significant accumulation of SOC after returning farmland to forestland and grassland was found. The process of the conversion from forestland or grassland into farmland and the management afterward reduced carbon inputs from litter and enhanced the carbon outputs by breaking the protection of SOC [6]. The cessation of plowing after converting farmland into grassland or forestland led to an accumulation of SOC near the surface and provided a better protection of SOC against decomposition [47,48]. Furthermore, Aslan et al. [49] found that the adoption of no-tillage practices could protect soil from biological degradation and maintain soil quality in comparison with that under plow tillage management. Hence, it was shown that returning farmland to forestland and grassland would provide a new environment without the disturbance of plowing for vegetation restoration, which further explains the increase in forestland SOC [48,50].
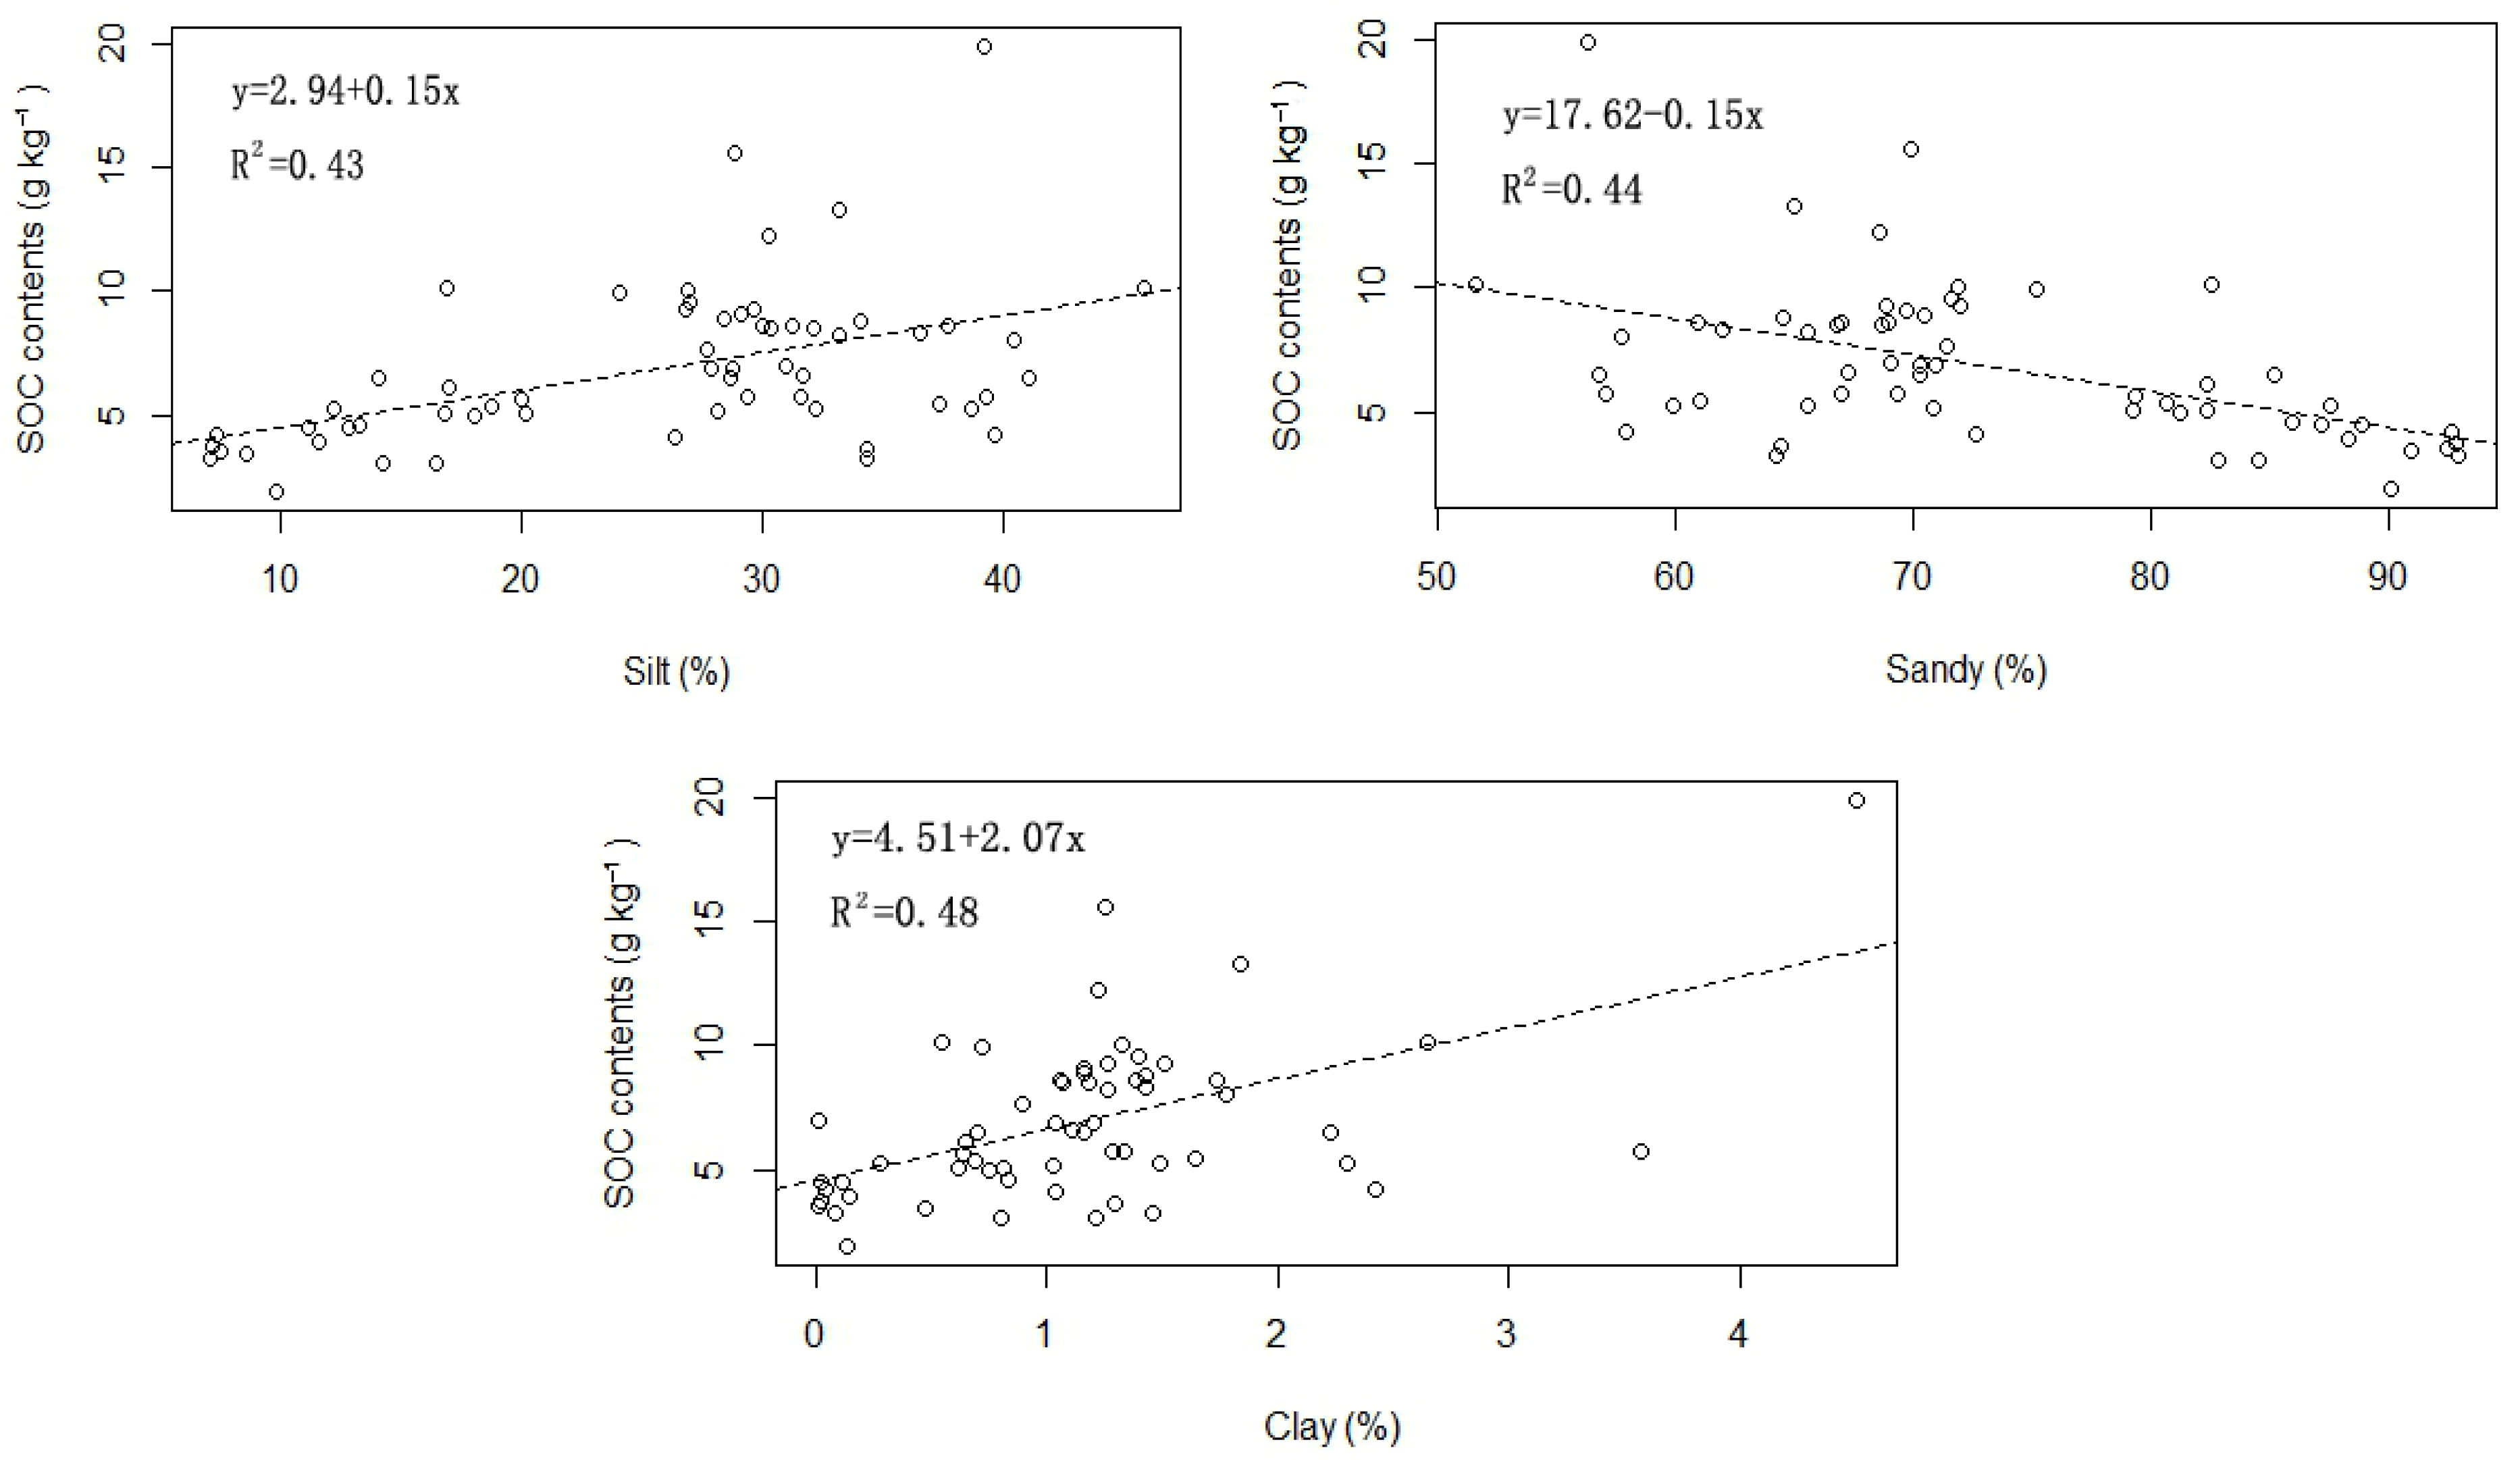
It is widely accepted that land-use change affects soil properties, and the changes in land-use types strongly impacted the physical and chemical soil attributes associated with carbon cycling in this area. The C:N ratios of different land-use types in our results showed that the forestland and grassland had higher C:N ratios than those of farmland and sandy land (Table 3). A significant increase in the C:N ratio was found after the conversion of farmland into forestland and grassland, and from sandy land into grassland, indicating that there was a slower decomposition rate on forestland and grassland [51,52]. The lower C:N ratio on farmland compared to that on forestland and grassland explained the increase in SOC decomposition [53,54]. Clay-rich soil even tended to show higher SOC content (Table 3, Figure 5). A significant increase in clay after returning farmland to forest- and grassland was found. As SOC and clay particles interact to slow the decomposition process [55], soil with higher clay content has the potential to hold more SOC. Vegetation restoration would be an effective method of increasing the SOC by changing the soil properties, which were shown to depend on the land-use type.
5. Conclusions
Extrinsic anthropogenic activities—especially land-use changes—have taken place on a massive scale, thus enhancing the spatial variability of SOC over the last 36 years. Significantly different means of SOC content were found among different land-use types, which exhibited the following order from high to low: forestland > farmland > grassland > sandy land. By 2021, the SOC content was higher than that in 1985 in most regions of the study area. The average SOC in 2021 was 7.49 g kg−1, which was significantly higher than 6.91 g kg−1 in 1985. The phenomenon of SOC accumulation after returning farmland to forest or grassland was found, while SOC depletion occurred after converting grassland into forestland. The abundant aboveground inputs and relatively low decomposability on forestland could increase SOC compared to other land-use types. However, agricultural tillage is a key factor in reducing SOC by reducing carbon inputs from litter and breaking the protection of carbon. This was attributed to the accumulation of SOC by different land-use types, which was mainly associated with the balance between aboveground biomass inputs and SOC decomposition. The changes in SOC appeared to be influenced by both soil texture and the C/N ratio during processes of land-use change. We concluded that vegetation restoration is a key process in SOC accumulation.
Author Contributions
Conceptualization, L.L. and X.D.; Data curation, Funding acquisition, L.L., X.D. and Y.S.; Investigation, Resources, Writing—review & editing, Project administration, L.L., X.D., Y.S., P.Z., S.Z. and Z.Z. All authors have read and agreed to the published version of the manuscript.
Funding
Funding was provided by the project “Improving the scientific research ability of young teachers: spatial–temporal variations in hydraulic erosion under different slope vegetation patterns in the Yellow River Basin” (BR220109). Higher Education Reform and Development Project—Young Science and Technology Talents (NJYT22046), 2021.12–2023.12, Inner Mongolia Department of Education.
Data Availability Statement
Data are available on request due to restrictions.
Conflicts of Interest
The authors declare no conflict of interest.
References
- Regina, S.; Jūratė, A.; Donata, T.; Gintaras, S. Impact of sward formation on soil organic carbon variation and relations with soil microbial activity. Zemdirbyste-Agriculture 2022, 109, 195–202. [Google Scholar]
- Benito, M.; Jaime, B.; Daniel, L.; Osorio, M.; Jimenez, M.; Melendez, J.R. Differences in the ratio of soil microbial biomass carbon (MBC) and soil organic carbon (SOC) at various altitudes of Hyperalic Alisol in the Amazon region of Ecuador. F1000Research 2020, 9, 443. [Google Scholar]
- Simes, R.; Menezes, C.; Sales, A.T.; Primo, D.C.; Sampaio, B. Soil and vegetation carbon stocks after land-use changes in a seasonally dry tropical forest. Geoderma 2021, 390, 114943. [Google Scholar]
- Bouajila, A.; Omar, Z.; Magherbi, G. Soil aggregation, aggregate-associated organic carbon, and total nitrogen under different land use in regosols of coastal arid lands in gabes, tunisia. Arab. J. Geosci. 2021, 14, 1933. [Google Scholar] [CrossRef]
- Post, W.M.; Kwon, K.C. Soil carbon sequestration and land-use change:processes and potential. Glob. Chang. Biol. 2000, 6, 317–327. [Google Scholar] [CrossRef]
- Gao, G.; Tuo, D.; Han, X.; Jiao, L.; Fu, B. Effects of land-use patterns on soil carbon and nitrogen variations along revegetated hillslopes in the chinese loess plateau. Sci. Total Environ. 2020, 746, 141156. [Google Scholar] [CrossRef]
- Lozano-García, B.; Francaviglia, R.; Renzi, G.; Doro, L.; Parras-Alcántara, L. Land use change effects on soil organic carbon store. an opportunity to soils regeneration in mediterranean areas: Implications in the 4p1000 notion. Ecol. Indic. 2020, 119, 106831. [Google Scholar] [CrossRef]
- Poeplau, C.; Don, A.; Vesterdal, L.; Leifeld, J.; Van, W.B.; Schumacher, J.; Gensior, A. Temporal dynamics of soil organic carbon after land-use change in the temperate zone—Carbon response functions as a model approach. Glob. Chang. Biol. 2011, 17, 2415–2427. [Google Scholar] [CrossRef]
- Tahir, M.M.; Khalid, A.B.; Mehmood, K.; Khaliq, A.; Rahim, N. Variations in Soil Carbon and Nitrogen Contents under Different Land Uses in Sub-Temperate Highland of Azad Kashmir. Eurasian Soil Sci. 2021, 54, 586–596. [Google Scholar] [CrossRef]
- Li, Y.; Xie, T.; Yang, H.; Li, X. Revegetation enhances soil organic carbon mineralization and its temperature sensitivity in the Tengger Desert, North China. Catena 2022, 218, 712. [Google Scholar] [CrossRef]
- Neff, J.C.; Barger, N.N.; Baisden, W.T.; Fernandez, D.P.; Asner, G.P. Soil carbon storage responses to expanding pinyonjuniper populations in southern Utah. Ecol. Appl. 2009, 19, 1405–1416. [Google Scholar] [CrossRef]
- Laganiere, J.; Angers, D.A.; Pare, D. Carbon accumulation in agricultural soils after afforestation: A meta-analysis. Glob. Change Biol. 2010, 16, 439–453. [Google Scholar] [CrossRef]
- Lv, X.; Jia, G.; Yu, X.; Niu, L. Vegetation and Topographic Factors Affecting SOM, SOC, and N Contents in a Mountainous Watershed in North China. Forests 2022, 13, 742. [Google Scholar] [CrossRef]
- State Forestry Administration. Monitoring of Ecological Benefits of Returning Farmland to Forest Project: 2014; China Forestry Press: Beijing, China, 2015. [Google Scholar]
- Wang, S.Q.; Zhou, C.H.; Li, K.R.; Zhu, S.L.; Huang, F.H. Analysis on spatial distribution characteristics of soil organic carbon reservoir in China. Acta Geogr. Sin. 2000, 55, 533–544. [Google Scholar]
- Breuer, L.; Huisman, J.A.; Keller, T.; Frede, H.G. Impact of a conversion from cropland to grassland on C and N storage and related soil properties: Analysis of a 60-year chronosequence. Geoderma 2006, 133, 6–18. [Google Scholar] [CrossRef]
- Walkley, A. A critical examination of a rapid method for determining organic carbon in soils-effects of variations in digestion conditions and of inorganic soil constituents. Soil Sci. 1947, 63, 251–264. [Google Scholar] [CrossRef]
- Chien, Y.J.; Lee, D.Y.; Guo, H.Y.; Houng, K.H. Geostatistical analysis of soil properties of mid-west Tai soils. Soil Sci. 1997, 162, 291–298. [Google Scholar] [CrossRef]
- Gamma Design Software 2004, GS+ Version 7. GeoStatistics for the Environmental Sciences. User’s Guide. Gamma Design Software, LLC: Plainwell, MI, USA, 2004; p. 160.
- Zhang, Y.; Ai, J.; Sun, Q.; Li, Z.; Hou, L.; Song, L.; Tang, G.; Li, L.; Shao, G. Soil organic carbon and total nitrogen stocks as affected by vegetation types and altitude across the mountainous regions in the Yunnan Province, south-western China. Catena 2021, 196, 104872. [Google Scholar] [CrossRef]
- Yu, Z.; Si, X.; Tiezhou, W. Multi-stage constant current charging strategy considering SOC intervals and voltage thresholds. Glob. Energy Interconnect. 2022, 5, 143–153. [Google Scholar]
- Luan, H.; Yuan, S.; Gao, W.; Tang, J.; Li, R.; Zhang, H.; Huang, S. Changes in organic C stability within soil aggregates under different fertilization patterns in a greenhouse vegetable field. J. Integr. Agric. 2021, 20, 2758–2771. [Google Scholar] [CrossRef]
- Dong, J.; Wang, L.; Quan, Q.; Zhang, J.; Li, X.; Zhao, D.; Fang, J.; Cao, Q.; Liu, J. Factors controlling soil organic carbon content in wetlands at multiple scales and assessment of the universality of estimation equations: A mega-data study. Sci. Total Environ. 2022, 827, 154380. [Google Scholar] [CrossRef] [PubMed]
- Zhi, J.; Jing, C.; Lin, S.; Zhang, C.; Liu, Q.; DeGloria, S.D.; Wu, J. Estimating soil organic carbon stocks and spatial patterns with statistical and GIS-based methods. PLoS ONE 2017, 9, e97757. [Google Scholar] [CrossRef] [PubMed]
- Zhang, M.; Li, X.; Wang, H.; Huang, Q. Comprehensive analysis of grazing intensity impacts soil organic carbon: A case study in typical steppe of Inner Mongolia, China. Appl. Soil Ecol. 2018, 129, 1–12. [Google Scholar] [CrossRef]
- Gouri, S.B.; Pravat, K.S.; Ramkrishna, M. Comparison of GIS-based interpolation methods for spatial distribution of soil organic carbon (SOC). J. Saudi Soc. Agric. Sci. 2018, 17, 114–126. [Google Scholar]
- Xueqi, X.; Zhongfang, Y.; Yuan, X.; Xin, S.; Tao, Y.; Hou, Q. Spatial analysis of land use change effect on soil organic carbon stocks in the eastern regions of China between 1980 and 2000. Geosci. Front. 2017, 8, 597–603. [Google Scholar]
- Chipomho, J.; Parwada, C.; Rugare, J.T.; Mabasa, S.; Chikowo, R.; Mashingaidze, A.B. Influence of soil organic carbon, fertiliser management, and weeding regime on weed dynamics and maize productivity on sandy soils in eastern Zimbabwe. South Afr. J. Plant Soil 2021, 38, 81–92. [Google Scholar] [CrossRef]
- Peng, W.; Zhang, K.; Yang, Q. Prediction of the impact of returning farmland to forests on soil organic carbon in the Loess Plateau. Reg. Res. Dev. 2006, 25, 94–99. [Google Scholar]
- Li, Y.; Liu, W.; Feng, Q.; Zhu, M.; Yang, L.; Zhang, J. Effects of land use and land cover change on soil organic carbon storage in the Hexi regions, Northwest China. J. Environ. Manag. 2022, 312, 114911. [Google Scholar] [CrossRef]
- Pedra, F.; Polo, A.; Ribeiro, A.; Domingues, H. Effects of municipal solid waste compost and sewage sludge on mineralization of soil organic matter. Soil Biol. Biochem. 2007, 39, 1375–1382. [Google Scholar] [CrossRef]
- Anderson, R.; Brye, K.R.; Wood, L.S. Aggregate Stability as Affected by Landuse and Soil Properties in the Lower Mississippi River Valley. Soil Sci. Soc. Am. J. 2019, 85, 1512–1524. [Google Scholar] [CrossRef]
- Qiu, L.F.; Zhu, J.X.; Zhu, Y.H.; Hong, Y.; Wang, K.; Deng, J.S. Land use changes induced soil organic carbon variations in agricultural soils of Fuyang County, China. J. Soils Sediments 2013, 13, 981–988. [Google Scholar] [CrossRef]
- Juan, A.; Roque, O.; Noelia, G.F.; Antonio, R.N.; Maria, A.; Javier, G.P.; Maria, M.M. Land use and climate change impacts on soil organic carbon stocks in semi-arid Spain. J. Soils Sediments 2013, 13, 265–277. [Google Scholar]
- Assad, E.D.; Pinto, H.S.; Martins, S.C.; Groppo, J.D.; Salgado, P.R.; Evangelista, B.; Vasconcellos, E.; Sano, E.E.; Pavão, E.; Luna, R.; et al. Changes in soil carbon stocks in Brazil due to land use: Paired site comparisons and a regional pasture soil survey. Biogeosciences 2013, 10, 6141–6160. [Google Scholar] [CrossRef]
- Martin, W.; Margit, V.L.; Peter, S.U.G.; Hangen, A.R.; Bernd, S.; Ingrid, K.K. Land use effects on organic carbon storage in soils of Bavaria: The importance of soil types. Soil Tillage Res. 2005, 146, 296–302. [Google Scholar]
- Yao, M.K.; Angui, P.K.T.; Konate, S.; Tondoh, J.E.; Tano, Y.; Abbadie, L.; Benest, D. Effects of land use types on soil organic carbon and nitrogen dynamics in midwest Côte d’Ivoire. Eur. J. Sci. Res. 2010, 40, 211–222. [Google Scholar]
- Daniel, B.; Cristiane, A.S.; Kellen, B.C.; Nagomi, K.; Galdino, A.; Waldemar, Z.; Marco, A.N. Effects of land use on soil organic carbon and microbial processes associated with soil health in southern Brazil. Eur. J. Soil Biol. 2013, 55, 117–123. [Google Scholar]
- Zhong, Z.; Wu, S.; Lu, X.; Ren, Z.; Wu, Q.; Xu, M.; Ren, C.; Yang, G.; Han, X. Organic carbon, nitrogen accumulation, and soil aggregate dynamics as affected by vegetation restoration patterns in the Loess Plateau of China. Catena 2021, 196, 104867. [Google Scholar] [CrossRef]
- Fu, Y.S.; Xia, X.Q.; Yang, Z.F.; Li, J. Storage and Distribution of Soil Organic Carbon in Inner Mongolia. Geoscience 2012, 26, 886–895. [Google Scholar]
- Christopher, P.; Axel, D. Sensitivity of soil organic carbon stocks and fractions to different land-use changes across Europe. Geoderma 2013, 192, 189–201. [Google Scholar]
- Yuan, J.; Zhang, Y.; You, C.; Cao, R.; Tan, B.; Li, H.; Jiang, Y.; Yang, W. The three-dimension zonal pattern of soil organic carbon density in China’s forests. Catena 2021, 196, 104950. [Google Scholar] [CrossRef]
- Davis, M.R.; Condron, L.M. Impact of grassland afforestation on soil carbon in New Zealand: A review of paired-site studies. Aust. J. Soil Res. 2002, 40, 675–690. [Google Scholar] [CrossRef]
- Thuille, A.; Schulze, E.D. Carbon dynamics in successional and afforested spruce stands in Thuringia and the Alps. Glob. Chang. Biol. 2006, 12, 325–342. [Google Scholar] [CrossRef]
- Farley, K.A.; Jobbágy, E.G.; Jackson, R.B. Effects of afforestation on water yield: A global synthesis with implications for policy. Glob. Chang. Biol. 2005, 11, 1565–1576. [Google Scholar] [CrossRef]
- Morris, S.J.; Bohm, S.; Haile-Mariam, S.; Paul, E. Evaluation of carbon accrual in afforested agricultural soils. Glob. Chang. Biol. 2007, 13, 1145–1156. [Google Scholar] [CrossRef]
- Franzluebbers, A.J.; Stuedemann, J.A. Particulate and non-particulate fractions of soil organic carbon under pastures in the Southern Piedmont USA. Environ. Pollut. 2002, 116, 53–62. [Google Scholar] [CrossRef]
- Wang, J.; Wang, H.; Li, X.; Liu, S. Effects of environmental factors and tree species mixtures on the functional groups of soil organic carbon across subtropical plantations in southern China. Plant Soil 2022, 480, 265–281. [Google Scholar] [CrossRef]
- Aslan, T.; Choudhary, M.A.; Saggar, S. Tillage impacts on soil microbial biomass C, N and P, earthworms and agronomy after two years of cropping following permanent pasture in New Zealand. Soil Tillage Res. 1999, 51, 103–111. [Google Scholar] [CrossRef]
- Xing, G.; Wang, X.; Jiang, Y.; Yang, H.; Mai, S.; Xu, W.; Hou, E.; Huang, X.; Yang, Q.; Liu, W.; et al. Variations and influencing factors of soil organic carbon during the tropical forest succession from plantation to secondary and old–growth forest. Front. Ecol. Evol. 2023, 10, 1104369. [Google Scholar] [CrossRef]
- Uddin, M.J.; Hooda, P.S.; Mohiuddin, A.S.M.; Haque, M.E.; Smith, M.; Waller, M.; Biswas, J.K. Soil organic carbon dynamics in the agricultural soils of Bangladesh following more than 20 years of land use intensification. J. Environ. Manag. 2022, 305, 114427. [Google Scholar] [CrossRef]
- Vargas, D.N.; Bertiller, M.B.; Ares, J.O.; Carrera, A.L.; Sain, C.L. Soil C and N dynamics induced by leaf-litter decomposition of shrubs and perennial grasses of the Patagonian Monte. Soil Biol. Biochem. 2006, 38, 2401–2410. [Google Scholar] [CrossRef]
- John, B.; Yamashita, T.; Ludwig, B.; Flessa, H. Storage of organic carbon in aggregate and density fractions of silty soils under different types of land use. Geoderma 2005, 128, 63–79. [Google Scholar] [CrossRef]
- Marin, S.E.; Silver, W.L.; Swanston, C.W.; Ostertag, R. Soil organic matter dynamics during 80 years of reforestation of tropical pastures. Glob. Chang. Biol. 2009, 15, 1584–1597. [Google Scholar] [CrossRef]
- Rice, P.J.; Anderson, T.A.; Coats, J.R. Degradation and persistence of metolachlor in soil: Effects of concentration, soil moisture, soil depth, and sterilization. Environ. Toxicol. Chem. 2002, 21, 2640–2648. [Google Scholar] [CrossRef] [PubMed]
Figure 1.
The location of the study area and sample points with classes of elevation.

Figure 2.
Maps of the land-use types in 1985 and 2021 in the study area.

Figure 3.
Maps of the distributions of SOC content in the study area in 1985 (a) and 2021(b), and of changes in SOC between 1985 and 2021 (c).
Figure 3.
Maps of the distributions of SOC content in the study area in 1985 (a) and 2021(b), and of changes in SOC between 1985 and 2021 (c).

Figure 4.
Box plot of the SOC content on different types of land in (a) 1985 and (b) 2021. Values followed by different lowercase letters are significantly different between land-use types based on the Tukey test at p < 0.05; n is the number of soil samples.
Figure 4.
Box plot of the SOC content on different types of land in (a) 1985 and (b) 2021. Values followed by different lowercase letters are significantly different between land-use types based on the Tukey test at p < 0.05; n is the number of soil samples.

Figure 5.
The relationship between SOC content and soil rich in clay, silt, and sand.


Table 1.
Basic characteristics of the plot distribution.
| Year | Slope (°) | Number of Plots | Altitude (m) | Number of Plots | Soil Type | Number of Plots | Land-Use Change Type | Number of Plots |
|---|---|---|---|---|---|---|---|---|
| 1985 | <5 | 23 | <500 | 24 | Aeolian Sandy soil | 16 | Farmland | 12 |
| 5~10 | 16 | 500~700 | 15 | Chestnut soil | 18 | Forestland | 29 | |
| 10~15 | 10 | 700~900 | 13 | Cinnamon soil | 20 | Grassland | 13 | |
| 15~20 | 8 | 900~1100 | 7 | Brown earth | 11 | Sandy land | 11 | |
| 20~25 | 4 | >1100 | 6 | |||||
| >25 | 4 | |||||||
| 2021 | <5 | 81 | <500 | 32 | Aeolian Sandy soil | 45 | Farmland | 89 |
| 5~10 | 37 | 500~700 | 43 | Chestnut soil | 64 | Forestland | 30 | |
| 10~15 | 22 | 700~900 | 54 | Cinnamon soil | 40 | Grassland | 37 | |
| 15~20 | 21 | 900~1100 | 38 | Brown earth | 33 | Sandy land | 26 | |
| 20~25 | 12 | >1100 | 15 | |||||
| >25 | 9 |
Table 2.
Summary of the SOC content in the study area in 1985 and 2021.
| Year | SOC Contents (g kg−1) | SD | CV (%) | Skewness | Kurtosis | N | ||
|---|---|---|---|---|---|---|---|---|
| Minimum | Mean | Maximum | ||||||
| 1985 | 0.58 | 6.91 a | 20.11 | 2.83 | 40.96 | 1.29 | 5.55 | 65 |
| 2021 | 1.23 | 7.49 b | 19.95 | 3.80 | 50.73 | 0.17 | 1.09 | 182 |
Note: Different letters indicate significant differences in SOC content between 1985 and 2021 at p < 0.05 according to the Tukey test.
Table 3.
Theoretical model and parameters of semivariogram for the SOC content.
| Year | Model | Nugget | Sill | Range (m) | Nugget/Sill (%) | RSS | R2 |
|---|---|---|---|---|---|---|---|
| 1985 | Exponential | 0.001 | 0.387 | 18300 | 0.26 | 0.04 | 0.74 |
| 2021 | Spherical | 0.28 | 0.77 | 2100 | 36.61 | 21.10 | 0.73 |
Table 4.
Changes in SOC with the changes in land-use type; the values from after the land-use change are given in parentheses and the values from before the land-use change are given outside of parentheses.
Table 4.
Changes in SOC with the changes in land-use type; the values from after the land-use change are given in parentheses and the values from before the land-use change are given outside of parentheses.
| Land-Use Change Type | SOC Change (g kg−1) | N | Clay (%) | Silt (%) | Sandy (%) | C/N Ratio |
|---|---|---|---|---|---|---|
| Farmland to Forestland | 2.01 | 7 | 0.65 (1.12) * | 17.01 (17.75) | 82.33 (81.13) * | 11.51 (13.46) * |
| Farmland to Grassland | 4.21 | 8 | 0.84 (1.44) * | 21.21 (24.41) * | 77.96 (74.15) * | 10.12 (11.54) * |
| Grassland to Forestland | −1.43 | 5 | 1.04 (1.11) | 23.79 (22.64) | 75.18 (76.25) * | 12.52 (13.12) * |
| Sandy land to Grassland | 3.11 | 4 | 0.97 (1.22) * | 11.47 (13.98) * | 87.32 (84.79) * | 10.41 (12.25) * |
Note: Values with * indicate a statistically significance difference between the reference sites (outside of parentheses) and conversion sites (in parentheses) based on the Tukey test at p < 0.05.
Disclaimer/Publisher’s Note: The statements, opinions and data contained in all publications are solely those of the individual author(s) and contributor(s) and not of MDPI and/or the editor(s). MDPI and/or the editor(s) disclaim responsibility for any injury to people or property resulting from any ideas, methods, instructions or products referred to in the content. |
© 2023 by the authors. Licensee MDPI, Basel, Switzerland. This article is an open access article distributed under the terms and conditions of the Creative Commons Attribution (CC BY) license (https://creativecommons.org/licenses/by/4.0/).
Share and Cite
MDPI and ACS Style
Li, L.; Dong, X.; Sheng, Y.; Zhang, P.; Zhang, S.; Zhu, Z. Temporal and Spatial Changes in Soil Organic Carbon in a Semi-Arid Area of Aohan County, Chifeng City, China. Water 2023, 15, 3253. https://doi.org/10.3390/w15183253
AMA Style
Li L, Dong X, Sheng Y, Zhang P, Zhang S, Zhu Z. Temporal and Spatial Changes in Soil Organic Carbon in a Semi-Arid Area of Aohan County, Chifeng City, China. Water. 2023; 15(18):3253. https://doi.org/10.3390/w15183253
Chicago/Turabian StyleLi, Long, Xiaoyu Dong, Yan Sheng, Peng Zhang, Shangxuan Zhang, and Zhizhuo Zhu. 2023. "Temporal and Spatial Changes in Soil Organic Carbon in a Semi-Arid Area of Aohan County, Chifeng City, China" Water 15, no. 18: 3253. https://doi.org/10.3390/w15183253
Note that from the first issue of 2016, this journal uses article numbers instead of page numbers. See further details here.