Article

Influence of Extraction Methods on the Phytochemical Profile of Sambucus nigra L.

1
Faculty of Agriculture, University of Life Sciences “King Mihai I” from Timisoara, Calea Aradului No. 119, 300645 Timisoara, Romania
2
Faculty of Food Engineering, University of Life Sciences “King Mihai I” from Timisoara, Calea Aradului No. 119, 300645 Timisoara, Romania
3
Faculty of Veterinary Medicine, University of Life Sciences “King Mihai I” from Timisoara, Calea Aradului No. 119, 300641 Timisoara, Romania
*
Author to whom correspondence should be addressed.
Agronomy 2023, 13(12), 3061; https://doi.org/10.3390/agronomy13123061
Submission received: 17 November 2023 / Revised: 6 December 2023 / Accepted: 11 December 2023 / Published: 14 December 2023
(This article belongs to the Special Issue Extraction and Analysis of Bioactive Compounds in Crops—Series II)

Abstract

:
The aim of this work is to evaluate the influence of drying methods, extraction solvent, and extraction methods on the phytochemical profile of Sambucus nigra L. flowers harvested from the western region of Romania. Two drying methods for plant conditioning (room temperature and lyophilization), two extraction solvents (70% ethyl alcohol and water), and three extraction methods (conventional extraction (C), ultrasound-assisted extraction, and microwave extraction) were used. For the evaluation of the phytochemical profile, the following spectrophotometric methods were investigated: total polyphenol content, total antioxidant activity using the DPPH and FRAP methods, and flavonoid content. In addition to the spectrophotometric methods, the individual polyphenols were evaluated using the LC/MS method. Using atomic absorption spectrometry, the macro and microelement content of Sambucus nigra L. flowers was assessed. The results showed that the drying method, the solvent used for extraction, and the extraction method influenced the phytocompound content. The analyses showed that in terms of polyphenols, flavonoid content, and antioxidant activity, high values were recorded for lyophilization-dried samples compared to samples dried at room temperature. Also, higher values were recorded for alcoholic extracts compared to aqueous extracts, but also for extracts obtained by the ultrasound-assisted method, followed by extracts obtained via microwave compared to extracts obtained by conventional extraction.

1. Introduction

Medicinal plants serve as an abundant reservoir of bioactive substances with diverse functions within the body and find effective application in complementary medicine as a substitute for conventional medical practices. Medicinal plants encompass cultivated or naturally grown plant species possessing pharmaceutical attributes due to their chemical makeup. They are employed in natural remedies and therapies for both human and animal healthcare.
One plant that has garnered interest is black elder (Sambucus nigra L.), commonly referred to as elderberry, owing to its simple cultivation and abundant presence of bioactive components [1].
Sambucus nigra L., commonly known as black elderberry or common elderberry, belongs to the Adoxaceae family (previously part of the large Caprifoliaceae family) [2]. This medicinal shrub or small tree is indigenous to Western and Southern regions of Europe and North Africa, but it has also been introduced to various other parts of the world, including North America, Southeast Asia, and Australia.
Widely employed in herbal medicine and the food industry, the fruits of Sambucus nigra L. are shiny and metallic, appearing as purple-black drupes with a diameter ranging from 6 to 8 mm. These drupes grow in corymbs, with each cluster containing several hundred pieces [3].
Regarding Sambucus nigra L., every component of the plant (including its flowers, bark, leaves, and fruits) is abundant in phytochemicals, with Sambucus nigra L. being the most abundant in bioactive compounds among all the plant parts [4].
Sambucus nigra L. has been extensively utilized in traditional medicine for an extended period, owing to its effectiveness in treating various conditions via its diaphoretic, diuretic, and antipyretic properties. They seal the capillary walls, enhance their flexibility, and hinder the leakage of red blood cells and plasma from the vessels due to the presence of compounds like rutin, which possess vitamin P-like properties. Additionally, Sambucus nigra L. exhibit anti-inflammatory and antibacterial characteristics, making them a popular choice for gargling to alleviate sore throats or as compresses to address conjunctivitis. Typically, Sambucus nigra L. is primarily employed as dried flower infusions for both internal and external use [5].
The inflorescences of the elder are natural resources abundant in bioactive substances. Regrettably, they are perishable and only accessible for a brief period due to their seasonal nature. In order to ensure a year-round supply of these active compounds, it is necessary to preserve (stabilize) fresh plant materials before initiating the extraction procedures [6].
The obtained results show the practical importance and applicability of Sambucus nigra L. extract in medicine by emphasizing the extraction method that leads to the maximum content of active principles and the establishment of effective treatment doses in different diseases. Elderberry extracts have found applicability in medicine as diuretics and in the treatment/prevention of metabolic syndrome [7]. The high content of bioactive compounds with antioxidant potential has a positive role in adjusting the concentration of ROS in intestinal contents and in the intestinal epithelial cells [8]. Elderberry extract has proven to have pronounced antimicrobial activity with applicability in medicine. Previous studies have highlighted the antibacterial potential of the extract against Gram-positive and Gram-negative bacteria such as Staphylococcus aureus (MRSA), Bacillus cereus, Salmonella poona, and Pseudomonas aeruginosa [9].
The antiviral potential of elderberry extract has been proven inclusive in the prophylactic treatment of COVID-19 [4]. Last but not least, elderberry extract finds practical applicability in medicine as an antiproliferative agent proven against some.
Given the effectiveness of Sambucus nigra L. products in the treatment of cold and influenza symptoms, recent studies have shown that they can be a potential adjunctive treatment for the COVID-19 virus [10]. The effectiveness of plant compounds’ biological functions relies on the active principles’ quality and quantity in various plant-based preparations [11]. Therefore, it holds significant scientific and practical importance to enhance the preparation and extraction procedure for these active principles from a specific plant, ensuring the efficient extraction of compounds with functional roles.
Sustainable and eco-friendly technologies encompass procedures for processing plants. Selecting the appropriate extraction technique and the solvent is a crucial factor in achieving the best possible concentration of natural compounds in the extract. Choosing an efficient extraction method and following the correct procedural steps is essential to ensure optimal performance and enhanced stability of the compounds being extracted.
The extraction step is very important in the recovery of bioactive compounds from natural sources. The extraction method differs depending on the type of active principles that are intended to extract as a priority. In the case of extracts rich in polyphenols with medicinal applications, ethanolic extract led to the highest concentration (>44%) [12]; the combination of ethanol with water increases the extraction yield [13], while 60% methanol allowed the extraction of a higher percentage of procyanidins and flavonoids. Microwave-assisted extraction (MAE) brings some additional advantages in the extraction of polyphenols, such as low costs, small quantities of solvent, short extraction time, temperature control, energy saving, and obtaining an extract with higher antioxidant activity compared to conventional methods [14].
Ultrasound-assisted extraction (UAE), or sonication, improves the extraction yield of phenolic compounds from various plant sources by up to 35% [15]. A study regarding the efficiency of UAE extraction on phenolic compounds from functional foods with EDB was reported by Oniszczuk et al. [16].
In this regard, the objectives of this work were not only to optimize the extraction process in order to obtain a higher content of total polyphenols (TPC) and total flavonoids (TFC) but also a higher antioxidant (AA) and antimicrobial activity and individual polyphenols (LC-MS). The influence of (i) the sample drying method: drying at room temperature (D) and lyophilization (L); (ii) the influence of the extraction method: conventional extraction (C); ultrasound-assisted extraction (U) and microwave extraction (M), and (iii) the influence of the solvent used for extraction: 70% ethyl alcohol (A) and water (W) were studied. In this study, elderberry (Sambucus nigra L.) collected from wild flora in western Romania was analyzed.

2. Materials and Methods

2.1. Plant Material

The Sambucus nigra L. flowers (S) were collected from the spontaneous flora from Dudestii Noi 45°50′51″ N 21°06′30″ E, Timis County, Romania, in May. The freshly gathered flower clusters were carefully chosen, any plant parts unfit for processing were eliminated, and subsequently, the superior plant material remained. Following that, the prepped blossoms were split into two sets to carry out the preservation procedure for the freshly cut flowers, employing a variety of techniques. The plant vouchers (VSNH.ULST-BD72) were deposited at the botanical collection of the Herbarium of Botany Department of the Faculty of Agriculture, University of Life Sciences “King Mihai I” from Timisoara.

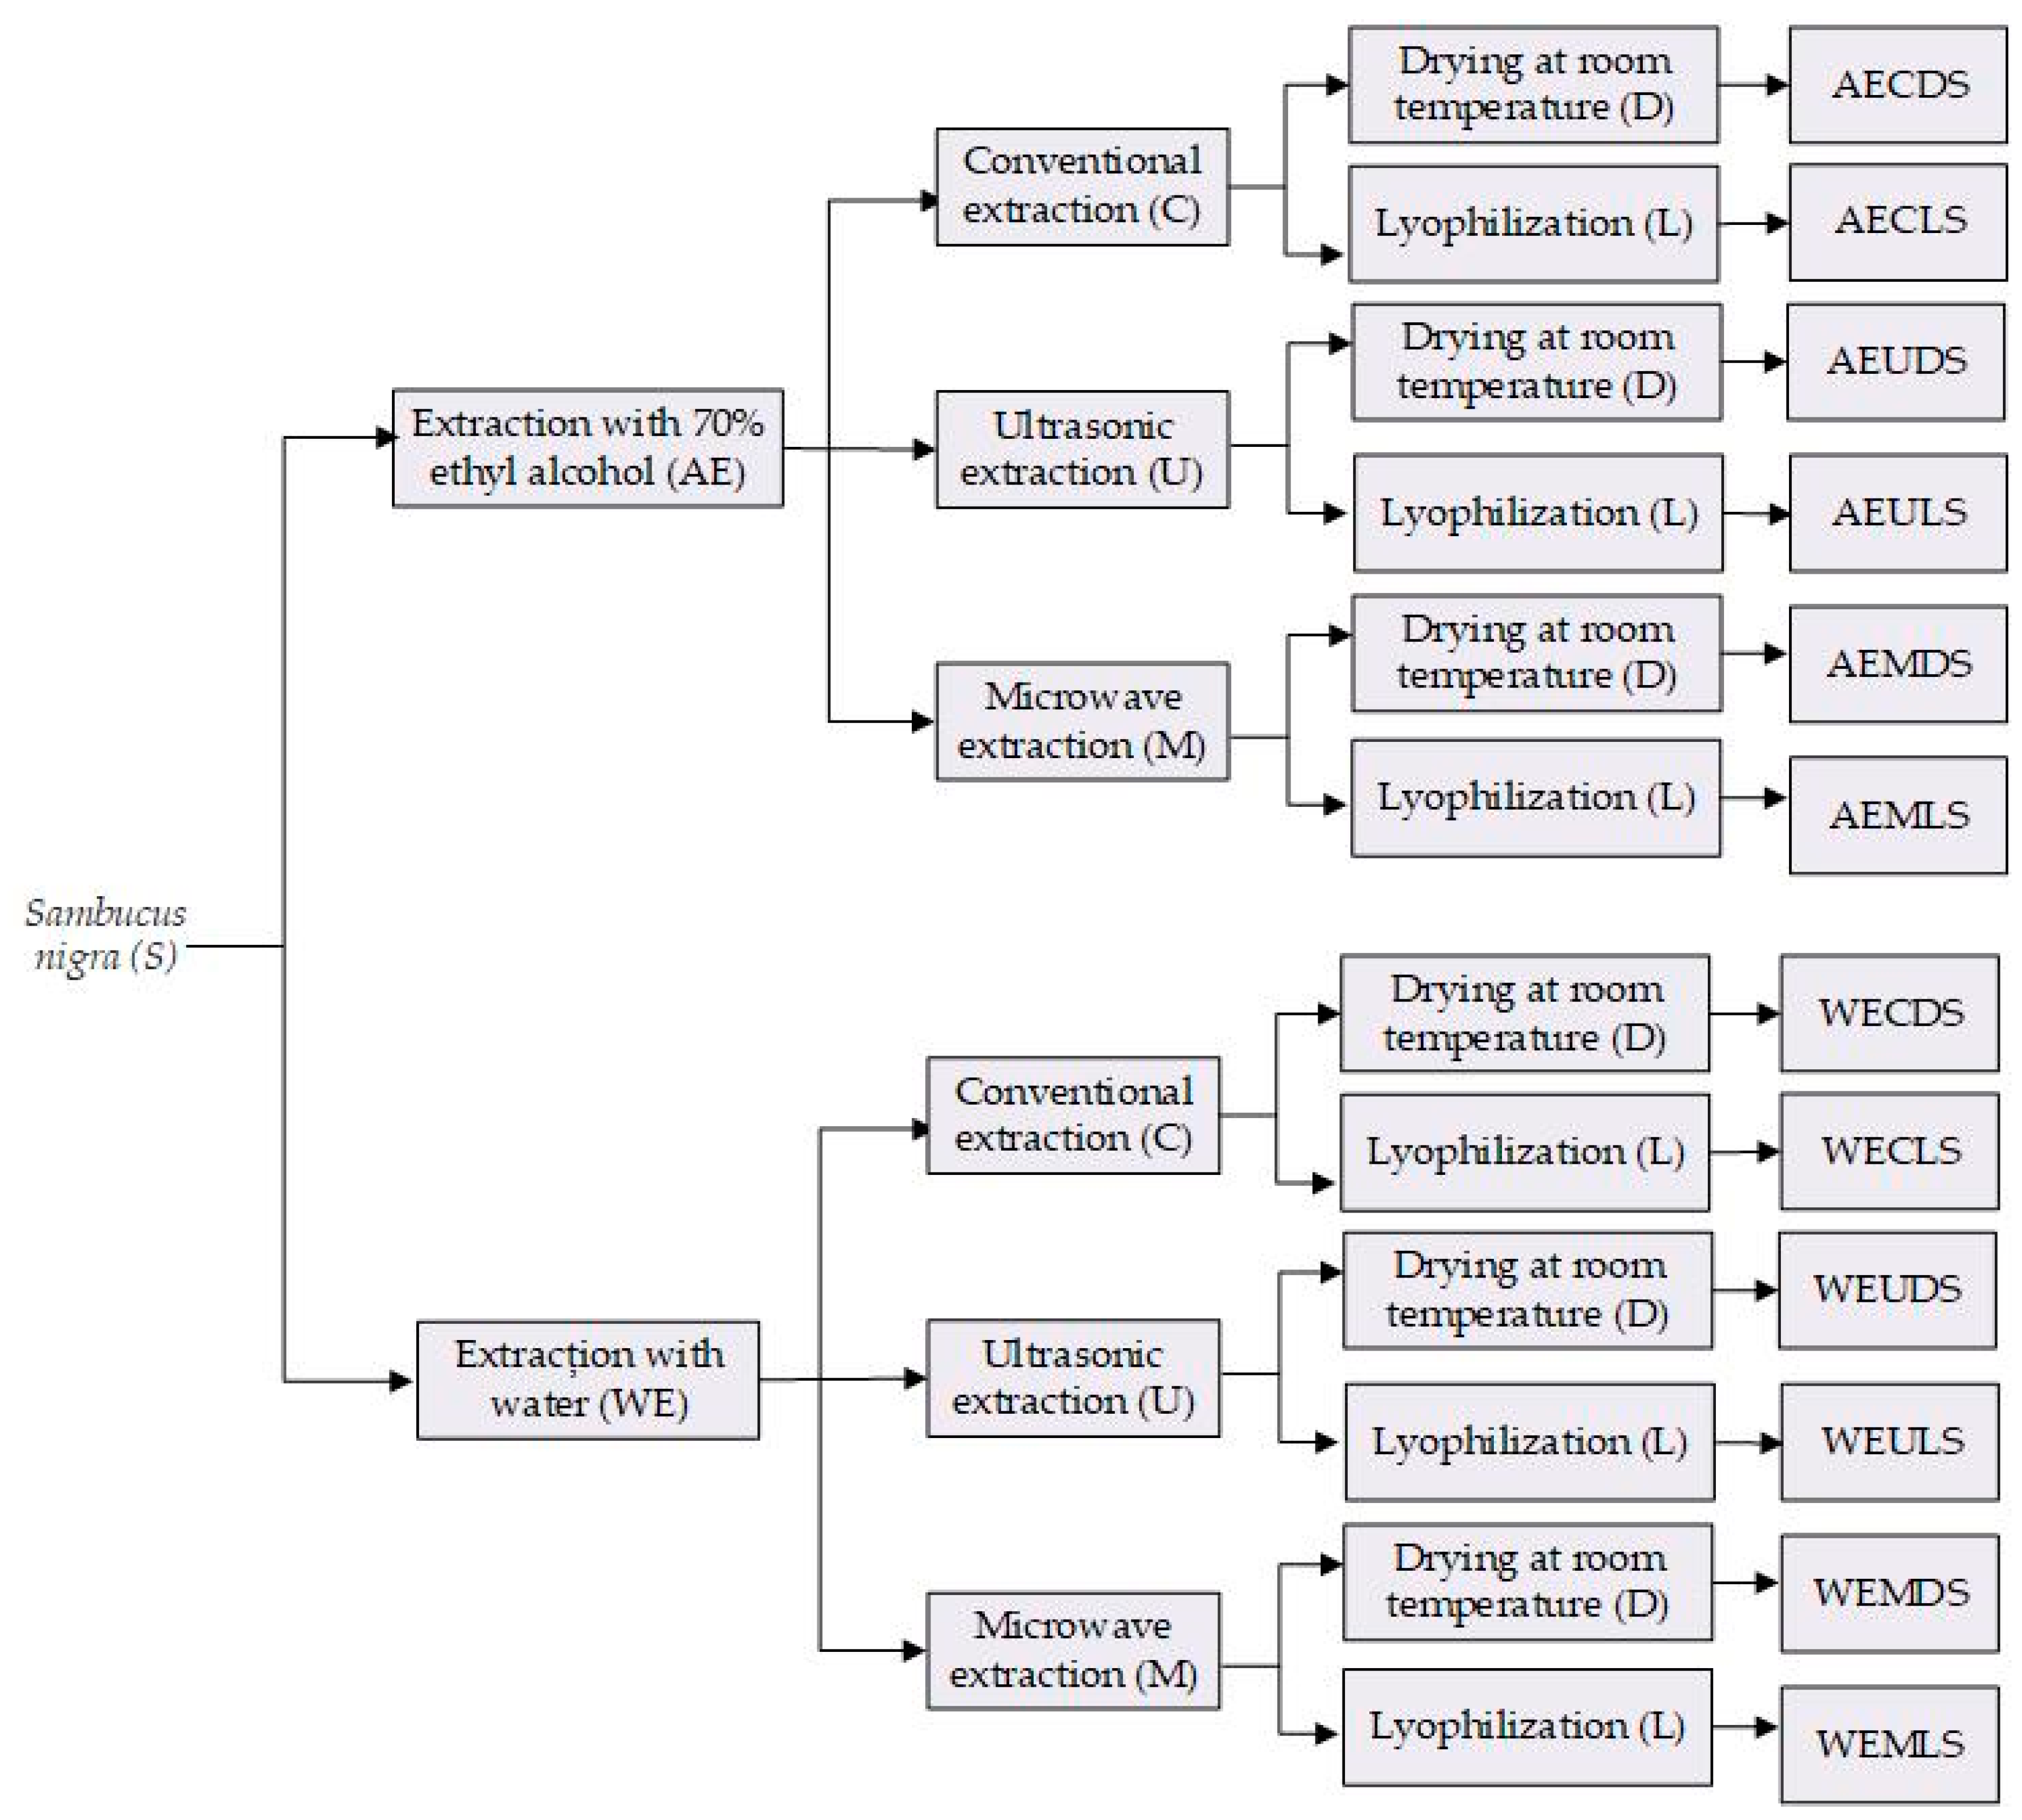
2.2. The Preparation of Plant Material and Plant Extracts

Sambucus nigra L. (S) was divided into two batches that were subjected to two drying modes: room temperature (U) and lyophilization (L).
The initial samples were allowed to air dry under ambient conditions and were periodically turned until they reached a constant °C sample mass. The dried samples were then packed in paper bags and stored at 18–20 °C in the absence of light.
The second sample of plant material was frozen at a temperature of −70 °C and then subjected to the lyophilization process for 24 h using a Unicryo Freeze Drying Duo Lyophilization System by Uniequip, Germany.
The dried samples were then extracted using two different extraction solvents: 70% ethyl alcohol (A) and water (W). For alcoholic extraction, 70% ethyl alcohol was used, as this combination has been shown to increase the extraction yield [13]. The extracts obtained were subjected to three different extraction methods: conventional extraction (C), ultrasonic extraction (U), and microwave extraction (M). This resulted in 12 extracts, as shown in Figure 1.
The extracts thus obtained were stored at 2–4 °C until tested for antioxidant, antimicrobial, and anti-inflammatory activities.

2.2.1. Conventional Extraction with Solvents (C)

The plant sample (1.0 g) was extracted with 20 mL of 70% ethanol (Sigma-Aldrich, St. Louis, MO, USA; Merck KGaA, Darmstadt, Germany) using a Holt plate stirrer (IDL, Freising, Germany) for a duration of 30 min. After this, the samples were subsequently filtered using Whatman filter paper (Sigma-Aldrich; Merck KGaA, Darmstadt, Germany) and stored at a temperature of 4 °C until they were ready for chemical and microbiological analyses. The same method was used for the aqueous extract.

2.2.2. Ultrasound-Assisted Extraction (U)

A 1.0 g sample was combined with 20 mL of 70% ethanol in an ultrasonic water bath (FALC Instruments, Treviglio, Italy). The extraction was carried out for 30 min at room temperature, utilizing an ultrasonic power of 216 watts and a frequency of 40 kHz. Following extraction, the resulting extracts were filtered using Whatman filter paper (Sigma-Aldrich; Merck KGaA, Darmstadt, Germany) and then stored at a temperature of 4 °C for subsequent analysis. The same method was used for the aqueous extract.

2.2.3. Microwave Extraction (M)

A combination of a 1.0 g sample and 20 mL of 70% ethanol underwent microwave-assisted extraction for a duration of 10 min at 600W power. Following this, the resulting extracts were filtered using Whatman filter paper (from Sigma-Aldrich; Merck KGaA, Darmstadt, Germany) and subsequently preserved at a temperature of 4 °C for subsequent analysis. The same method was used for the aqueous extract.

2.3. Macro and Microelements Determination

Composition of Sambucus nigra L. in macro and microelements was determined after calcination of the sample at 800C in a kiln (SLN 53 STD, POL-EKO-Aparatura SP, Wodzislaw, Poland) and extraction in 20% HCl (Sigma-Aldrich Chemie GmbH, Munich, Germany). For the quantification of macro and microelements, the atomic absorption spectrometry (AAS) method was used. The identification and quantification procedure is described by Horablaga et al. [17].

2.4. Antioxidant Profile

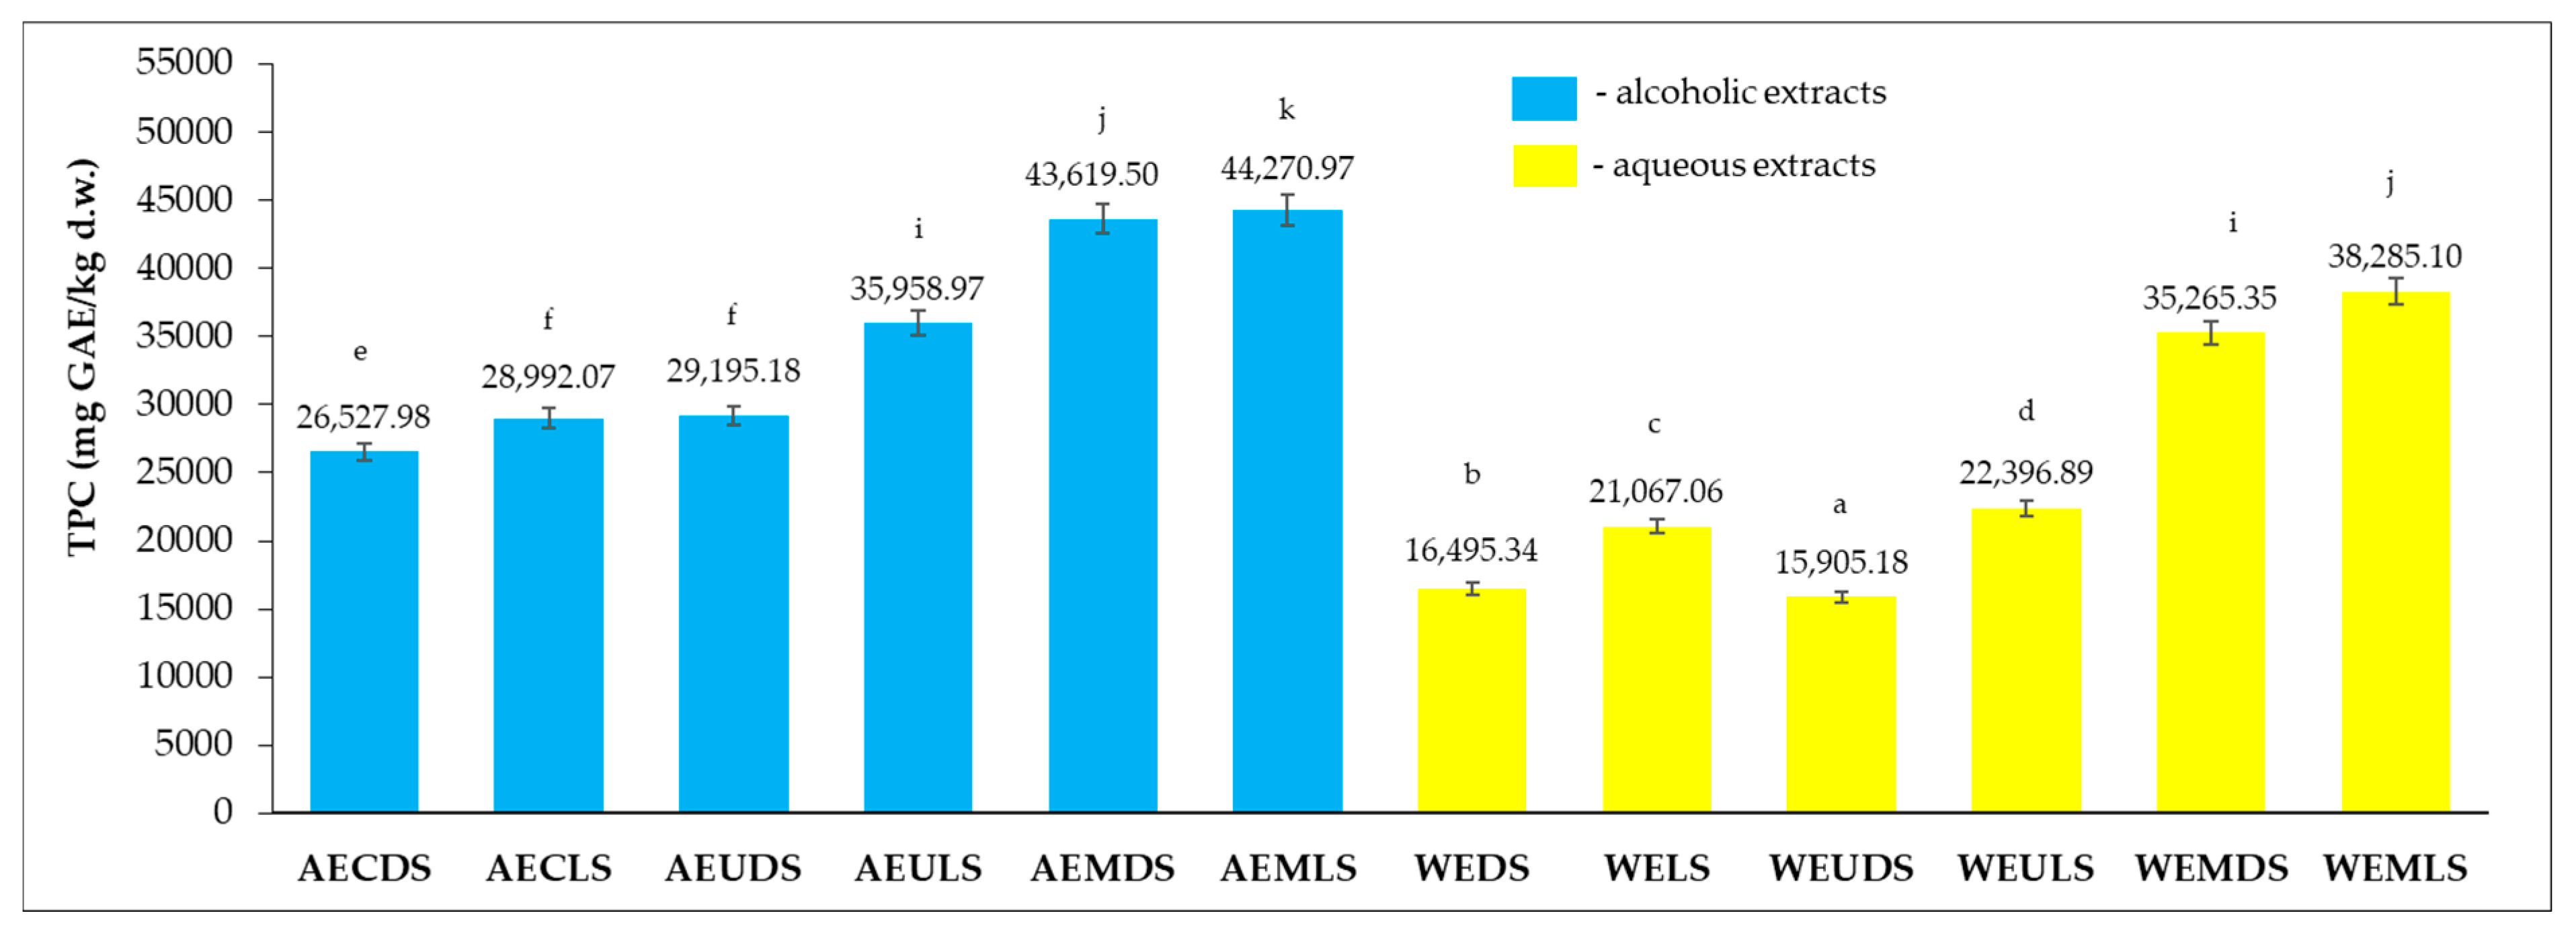
2.4.1. Determination of Total Polyphenols Content (TPC)

The Folin–Ciocalteu method was used to determine the total polyphenol content (TPC) of the 12 extracts of Sambucus nigra L. An amount of 0.5 mL of each extract prepared as described above was measured, and 1.25 mL Folin–Ciocalteu reagent (1:10 aqueous dilution) (Sigma-Aldrich Chemie GmbH, Munich, Germany) was added to each extract. The resulting mixture was allowed to stand for 5 min at room temperature, after which 1 mL of 60g/L Na2CO3 (Geyer GmbH, Renningen, Germany) was added to each sample. The prepared samples were incubated in a thermostat (INB500 from Memmert GmbH, Schwabach, Germany) at 50 °C for 30 min. After incubation, the absorbance was read at 750 nm using a UV-VIS spectrophotometer (Specord 205; Analytik Jena AG, Jena, Germany). Three determinations were carried out for each sample; the results were expressed in mg GAE/kg d.w. [18]. The calibration curve was obtained using gallic acid as standard (0–200 µg/mL), and the calibration equation was y = 0.0174x + 0.1224 (R2 = 0.9986).

2.4.2. Determination of Total Flavonoids Content (TFC)

The determination of total flavonoid content was carried out according to the method described by Hulea et al. [19] with minor modifications. Thus, 1 mL extract was measured into a test tube, over which 4 mL distilled water, 0.3 mL NaNO2 solution (5%), and 0.3 mL Al(NO3)3 solution (10%) were added. After a 6 min rest at room temperature, 2 mL 1 M NaOH solution was added to the mixture, and the mixture was made up to 10 mL with 70% ethanol. After a further 15 min rest at room temperature, the absorbance of the mixture was read at 510 nm using a UV-VIS spectrophotometer (Specord 205; Analytik Jena AG, Jena, Germany). Ethanol 70% was used as a reference. The sample was analyzed in triplicate, and the result was expressed as the mean value of mg QUE/100 g ± standard deviation (SD) in mg QUE/100 g.
The calibration curve was performed using quercitine (Sigma-Aldrich Chemie GmbH, Munich, Germany) in the concentration range of 5–100 μg/mL, and the calibration equation was y = 0.0051x + 0.6312 (R2 = 0.9995).

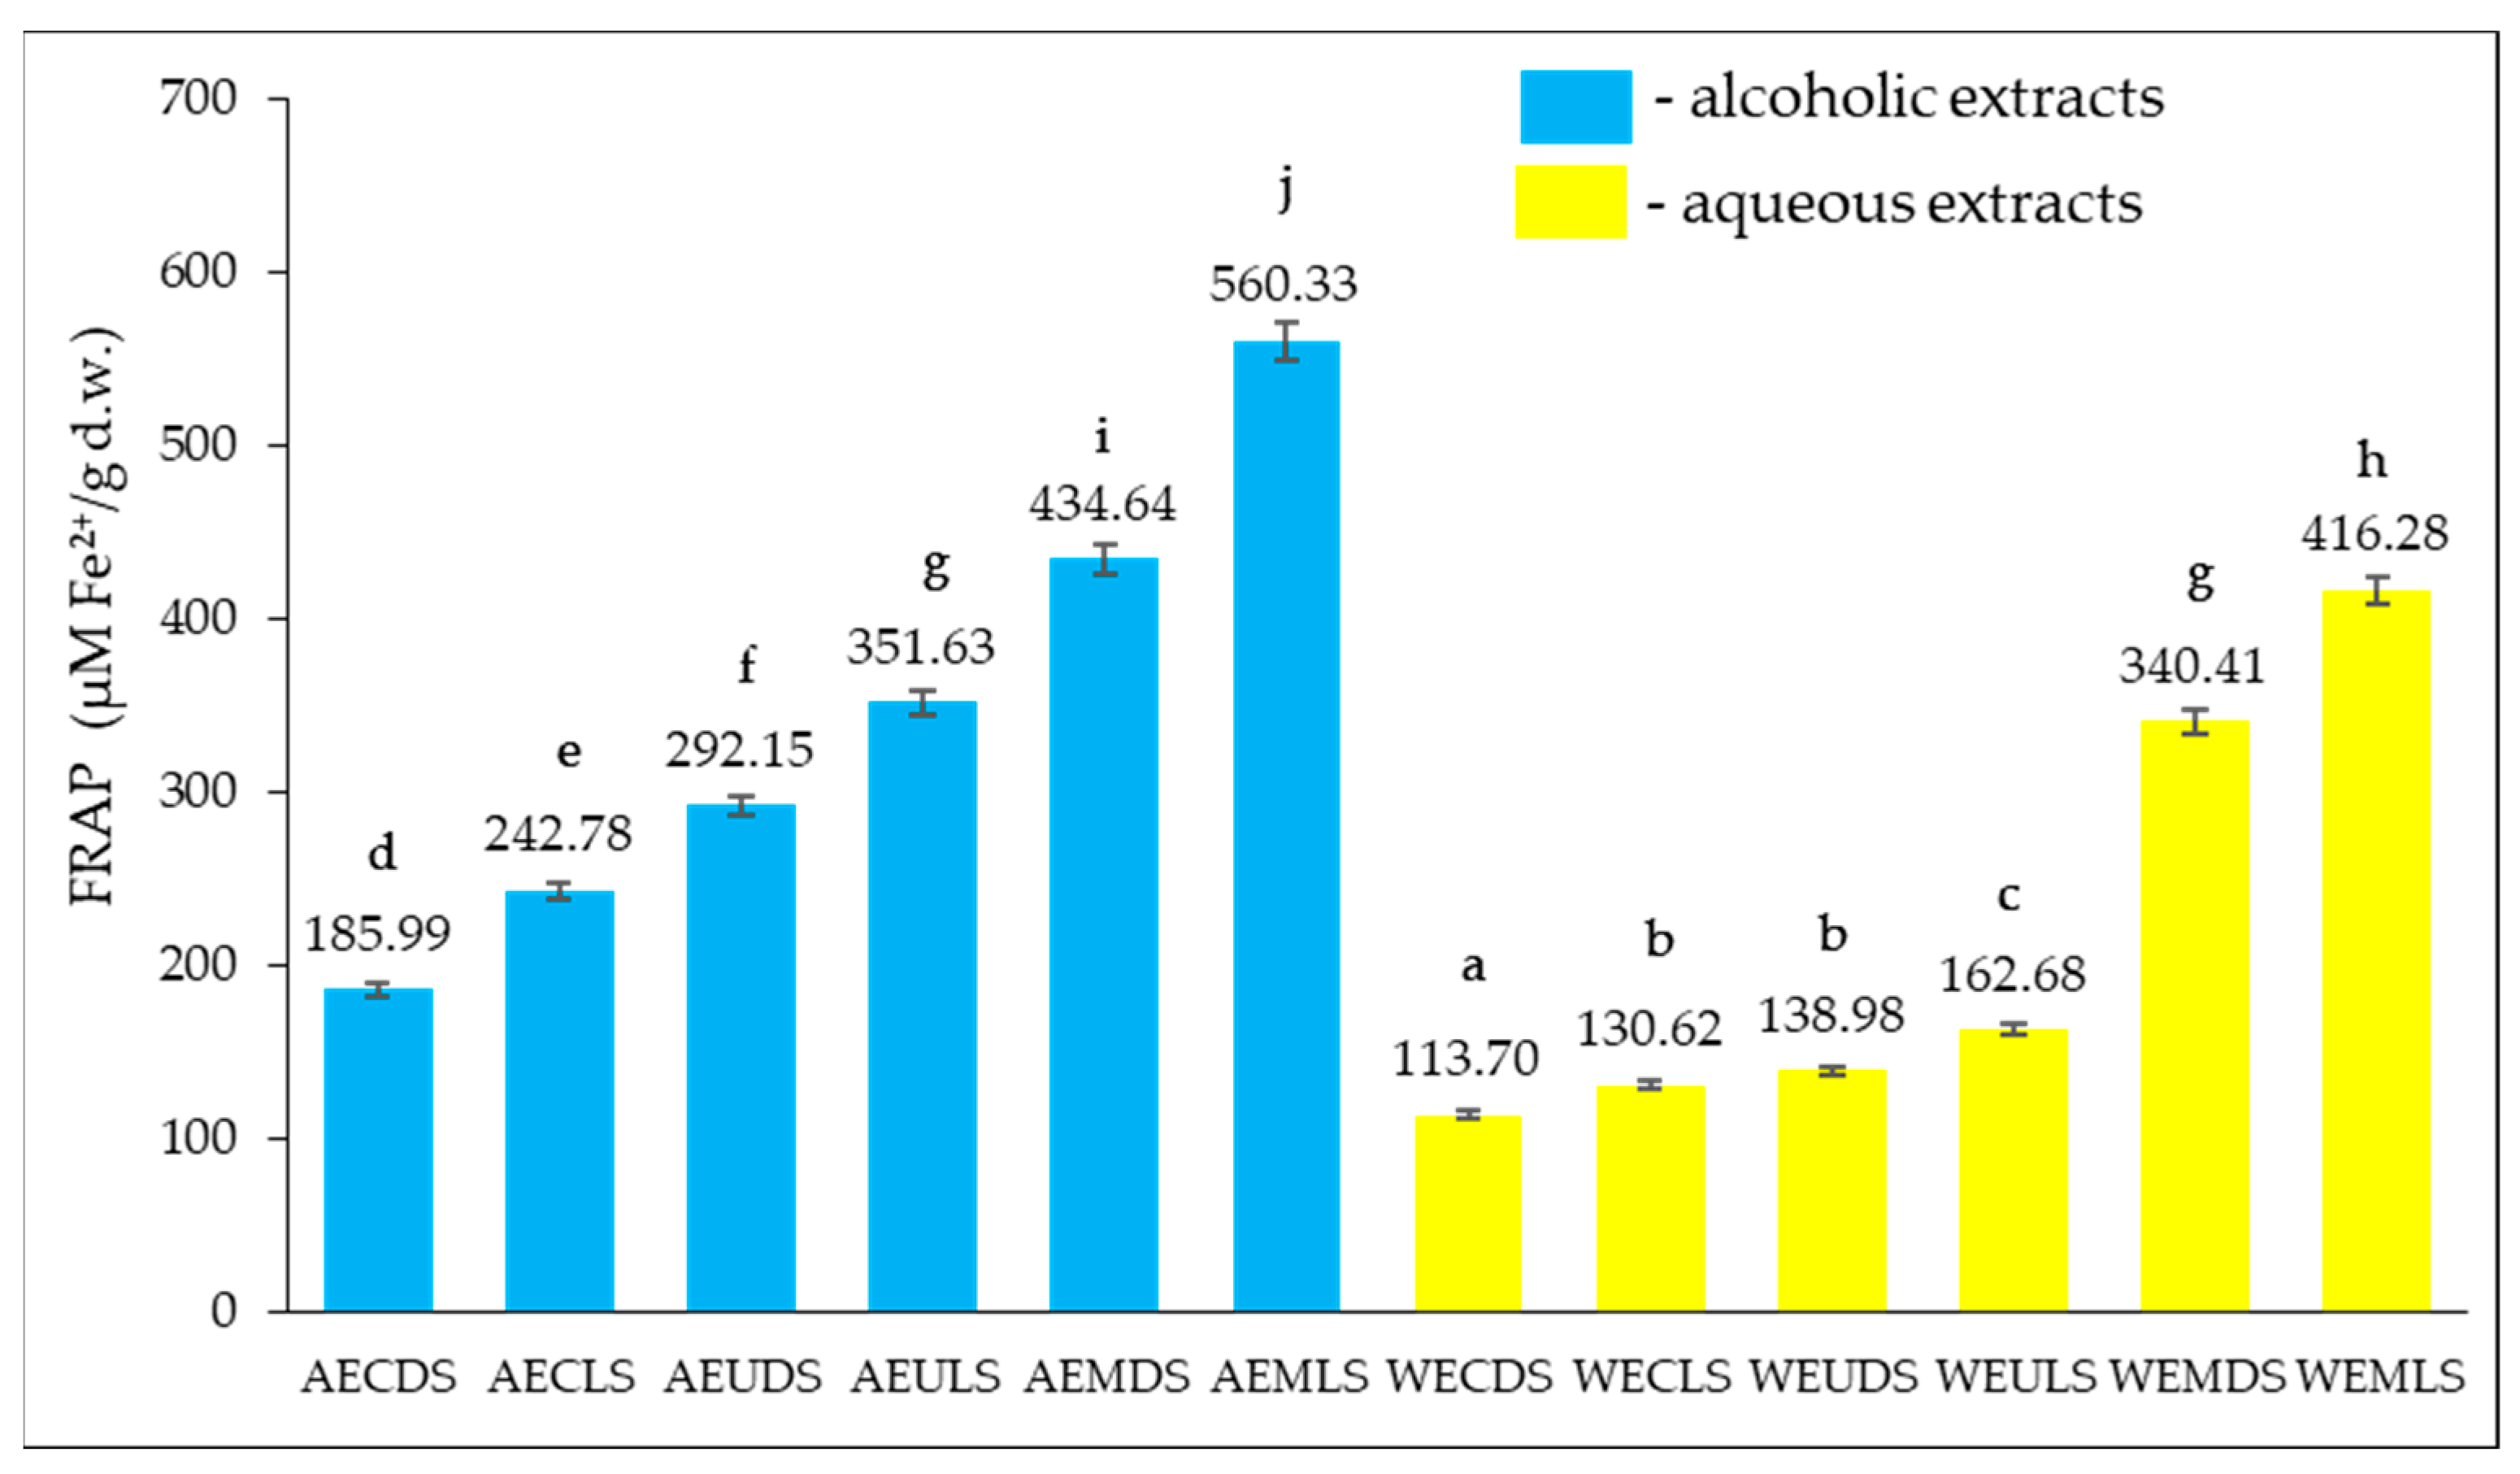
2.4.3. Antioxidant Activity by Ferric Reducing Antioxidant Power (FRAP) Assay

The ferric-reducing ability of both ethanolic and aqueous extracts of Sambucus nigra L. was investigated via the FRAP assay following the procedure described by Metzner Ungureanu et al. [20]. Technically, the FRAP assay is based on the ability of antioxidant compounds in plant extracts to reduce ferric ion (Fe3+) to the ferrous form (Fe2+) in the presence of tripyridyltriazine (TPTZ) by generating a deep blue Fe2+—TPTZ complex that exhibits an absorbance maximum at 593 nm [21]. Prior to analysis, the obtained extracts were diluted with distilled water as follows: 1:50 (v/v) for WEDS, WELS, AEDS, AELS, WEUDS, and WEULS; and 1:100 (v/v) for AEUDS, AEULS, AEMDS, AEMLS, WEMDS, and WEMLS. Next, 0.5 mL of diluted extracts were mixed with 2.5 mL of working solution and incubated at 37 °C for 30 min, after which the absorbance was measured at 593 nm against a blank sample obtained under the same conditions. FRAP values were reported as µM Fe2+ equivalent/g DW of plant material and computed from a calibration curve drawn using FeSO4·7H2O solutions with concentrations in the range 0.05–0.5 µM Fe2+ equivalent/mL. All determinations were performed in triplicate, and the results were given as mean value ± SD. FRAP values were reported as µM Fe2+ equivalent/g DW of plant material and computed from a calibration equation (y = 2.3559x − 0.0189, R2 = 0.9986) drown using FeSO4·7H2O solutions with concentrations in the range 0.05–0.5 µM Fe2+ equivalent/mL.

2.4.4. Antioxidant Capacity by 1,1-Diphenyl-2-picrylhydrazyl (DPPH) Assay

For the evaluation of antioxidant activity (AA), 0.03 mM 1,1-diphenyl-2-picrylhydryl ethanolic solution (DPPH, Sigma-Aldrich, Taufkirchen, Germany) was used. One mL of extract was taken, and 2.5 mL of DPPH solution was added. The resulting mixture was shaken vigorously and incubated for 30 min in the dark at room temperature. After this rest, the absorbance was read at 518 nm using a UV-VIS spectrophotometer (Specord 205; Analytik Jena AG, Jena, Germany). Ethyl alcohol 70% was used as a reference. The sample was analyzed in triplicate, and the mean value was reported. AA of the examined goji sample was calculated using Equation (1):
RSA   ( % ) = A control A sample A control × 100
where Acontrol—the absorbance value of the control sample and Asample—the absorbance values of the extract sample.
The antioxidant capacity of the extracts was expressed as IC50 value and compared with that of ascorbic acid [17].

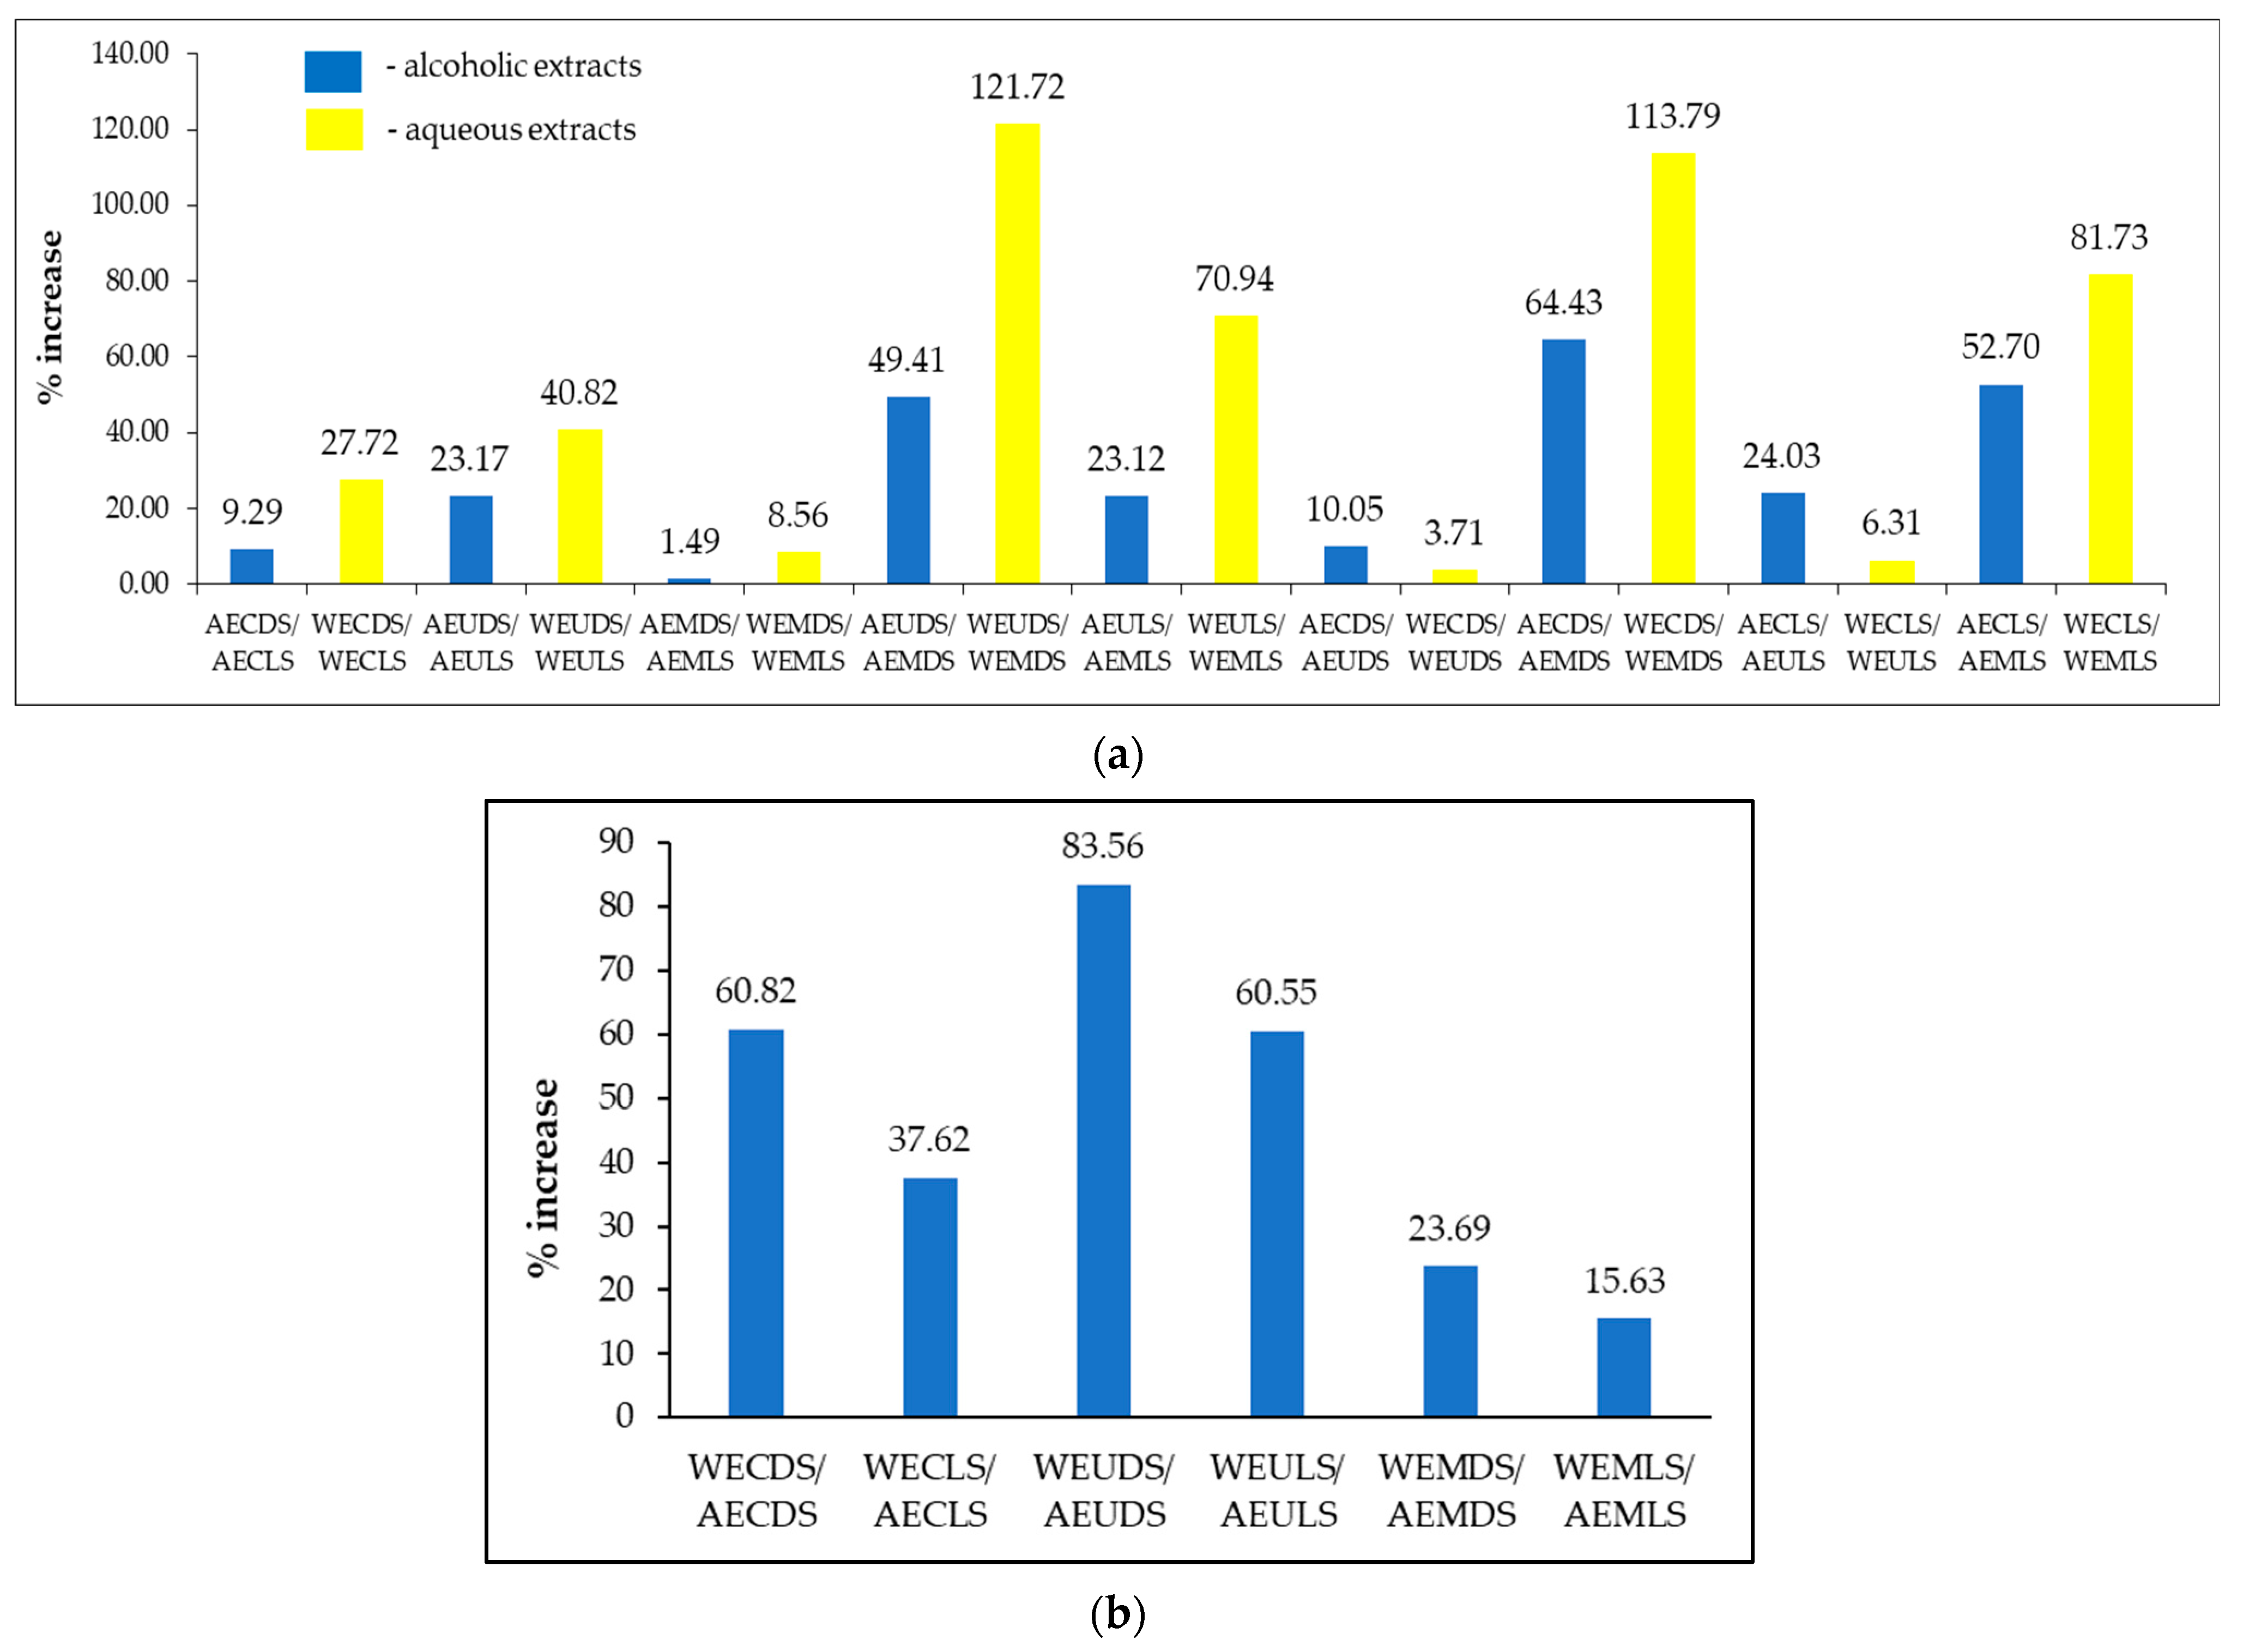
2.4.5. Influence of Drying Methods on Extraction Method and Extraction Solvent

After evaluating the TPC, TFC, and FRAP content in the 12 extracts, the increases between drying methods (D and L), extraction methods (C, U, and M), and extraction solvent (AE and WE) were calculated according to Table 1.
  • where:
TPCD,TFCD, FRAPD—TPC (mg GAE/g d.w.), TFC (mg QUE/g d.w.), FRAP (µM Fe2+ equivalent/mL) of dried samples at room temperature;
TPCL,TFCL, FRAPL—TPC (mg GAE/g d.w.), TFC (mg QUE/g d.w.), FRAP (µM Fe2+ equivalent/mL) of lyophilized sample;
TPCC (mg GAE/g d.w.), TFCC (mg QUE/g d.w.), FRAPC (µM Fe2+ equivalent/mL) − TPC (mg GAE/g d.w.), TFC (mg QUE/g d.w.), FRAP (µM Fe2+ equivalent/mL) of samples obtained by conventional extraction;
TPCU (mg GAE/g d.w.), TFCU (mg QUE/g d.w.), FRAPU (µM Fe2+ equivalent/mL) − TPC (mg GAE/g d.w.), TFC (mg QUE/g d.w.), FRAP (µM Fe2+ equivalent/mL) of samples obtained by ultrasonic extraction;
TPCM (mg GAE/g d.w.), TFCM (mg QUE/g d.w.), FRAPM (µM Fe2+ equivalent/mL) − TPC (mg GAE/g d.w.), TFC (mg QUE/g d.w.), FRAP (µM Fe2+ equivalent/mL) of samples obtained by microwave extraction;
TPCWE (mg GAE/g d.w.), TFCWE (mg QUE/g d.w.), FRAPWE (µM Fe2+ equivalent/mL) − TPC (mg GAE/g d.w.), TFC (mg QUE/g d.w.), FRAP (µM Fe2+ equivalent/mL) of samples obtained by extraction with water;
TPCAE (mg GAE/g d.w.), TFCAE (mg QUE/g d.w.), FRAPAE (µM Fe2+ equivalent/mL) − TPC (mg GAE/g d.w.), TFC (mg QUE/g d.w.), FRAP (µM Fe2+ equivalent/mL) of samples obtained by extraction with ethyl alcohol.

2.4.6. Individual Polyphenols Content Detected by LC-MS

The LC-MS method was used to determine the individual polyphenol content according to the procedure described by Cadariu et al. [22]. The equipment used was LC-MS (Shimadzu 2010 EV, Kyoto, Japan) equipped with electrospray ionization and SPD-10A UV and LC-MS 2010 detectors. The chromatographic conditions for the determination of polyphenolic compounds were Nucleodur CE 150/2 C18 Gravity SB 150 mm × 2.0 mm column (Macherey-Nagel GmbH & Co., KG, Germany) and a flow rate of 0.2 mL/min. The compounds were separated with gradient elution: 5% B (0.01–20 min), 5–40% B (20.01–50 min 10 min), 40–95% B (50–55 min), and 95% B (55–60 min), where A was the aqueous formic acid solution, pH = 3, and B acetonitrile and formic acid solution, pH = 3. The calibration curves used were in the range of 20–50 µg/mL, and the calibration equation used and R2 for the 12 samples are shown in Table 2. The individual polyphenolic compounds detected in the 12 samples were expressed as mg/g dry weight (d.w.). All samples were analyzed in triplicate, and results were presented as mean ± standard deviation (SD).

2.5. Statistical Analysis

All measurements were taken in triplicate, and the findings are given as mean values with standard deviation (SD). Statistical processing of data was performed using Microsoft Excel 365. Data were analyzed via one-way analysis of variance (t-test).

3. Results and Discussion

3.1. Macro and Microelements

The experimental results on the composition of Sambucus nigra L. flowers in macro and microelements (Table 3) show that Mg was the macroelement with the highest concentration (2979.75 ppm) present in the sample analyzed, followed by Ca (3296.52 ppm) and K (2018.81 ppm). Significant amounts of Cu (11.28 ppm), Zn (39.48 ppm), Fe (56.78 ppm), and Mn (66.11 ppm) were also found.
The results obtained for macro and microelement content are in agreement with results reported by other researchers in the scientific literature. Thus, Szymański and Szymański [23] reported a content of 25,167 ppm K, 4995 ppm Ca, 4291 ppm Mg, 10.45 ppm Cu, 64.36 ppm Fe, 52.4 ppm Mn, and 33.2 ppm Zn. Młynarczyk et al. [4] reported close mineral contents in Sambucus nigra L. flower, i.e., between 2673.90 and 3333.60 µg/g d.w. Ca; 493.70–1555.60 µg/g d.w. Mg; 52.2–103.0 µg/g d.w. Fe; 6.5–13.8 µg/g d.w. Cu; 31.8–41.1 µg/g d.w. Zn; and 19.7–60.0 µg/g d.m. Mn. Diviš et al. [24] reported 24.4 mg/kg Zn, 174 mg/kg Mn, 866 mg/kg Fe, 4294 mg/kg Mg, 8.33 mg/kg Cu, and 22,472 mg/kg K.

3.2. Antioxidant Profile

Determination of Total Polyphenols Content

The total content of polyphenols (TPC) of the alcoholic and aqueous extracts of Sambucus nigra L. studied is presented in Figure 1 and is expressed in mg GAE/kg dry matter (d.w.).
From the results obtained for the 12 extracts (Figure 2), it can be seen that the highest TPC content was recorded for AEMLS (44,270.97 mg GAE/kg d.w.) and the lowest for WECDS (16,495.34 mg GAE/kg d.w.). Analyzing the influence of the extraction solvent, it can be seen that the highest values were recorded for the alcoholic extracts (26,527.983–44,270.97 mg GAE/kg d.w.) compared to aqueous extracts (16,495.34–38,285.10 mg GAE/kg d.w.). Regarding the drying method, significantly higher TPC values were recorded for lyophilization samples (21,067.06–44,270.97 mg GAE/kg d.w.) compared to samples dried at room temperature (16,495.34–43,619.50 mg GAE/kg d.w.). The extraction method also influenced the TPC content, with higher values being obtained for samples extracted by microwave (35,265.35–44,270.97 mg GAE/kg d.w.), followed by samples extracted by ultrasound (15,908.18–35,958.97 mg GAE/kg d.w.), and finally, samples extracted by conventional method (16,495.34–28,992.07 mg GAE/kg d.w.) recorded the lowest values. With the exception of the AEULS and WEMDS samples, there were statistically significant differences (p < 0.05) between all other samples according to the t-test lyophilization.
Analyzing the influence of the drying method on the TPC content of the alcoholic extracts (Figure 3a), an almost insignificant increase can be observed between AEMDS/AEMLS (1.49%) and a significantly higher increase between AECDS/AEMDS (64.43%). In the case of aqueous extracts (Figure 3a), a small increase was recorded between WECDS/WEUDS (3.71%) compared to WEUDS/WEMDS (121.72%). The influence of extraction solvent (Figure 3b) is minimal between WEMLS/AEMLS (15.63%) and maximal between WEUDS/AEUDS (83.56%).
The values recorded in the present study are consistent with those reported in other studies published in the scientific literature, namely Tabaszzewska and Sikora [25] reported in their study on composition and antioxidant properties of Sambucus nigra L. extracts, a polyphenol content of 2072.50 mg for the extract obtained from the fresh plant, 619.04 mg for the extract obtained from the frozen plant, 2813.32 mg for the extract obtained from the air-dried plant, and 4070.35 mg for the extract obtained from the lyophilization plant. Mikulic-Petkovsek et al. [26] reported for flowers of different elderberry species or interspecific hybrids a total polyphenol content between 7410 and 40,137 mg GAE/kg d.w. and Gentsgevva et al. [27] reported a polyphenol content between 299.3 and 49.2 mg GAE/g d.w. Regarding the influence of the extraction method, Horablaga et al. [17], who analyzed the influence of the sample preparation/extraction method on the phytochemical profile and antimicrobial activities of 12 commonly consumed medicinal plants, recorded results similar to those reported in the present study, i.e., the highest values being recorded for extracts obtained by microwave, followed by extracts obtained by ultrasound and finally extracts obtained by the conventional method.

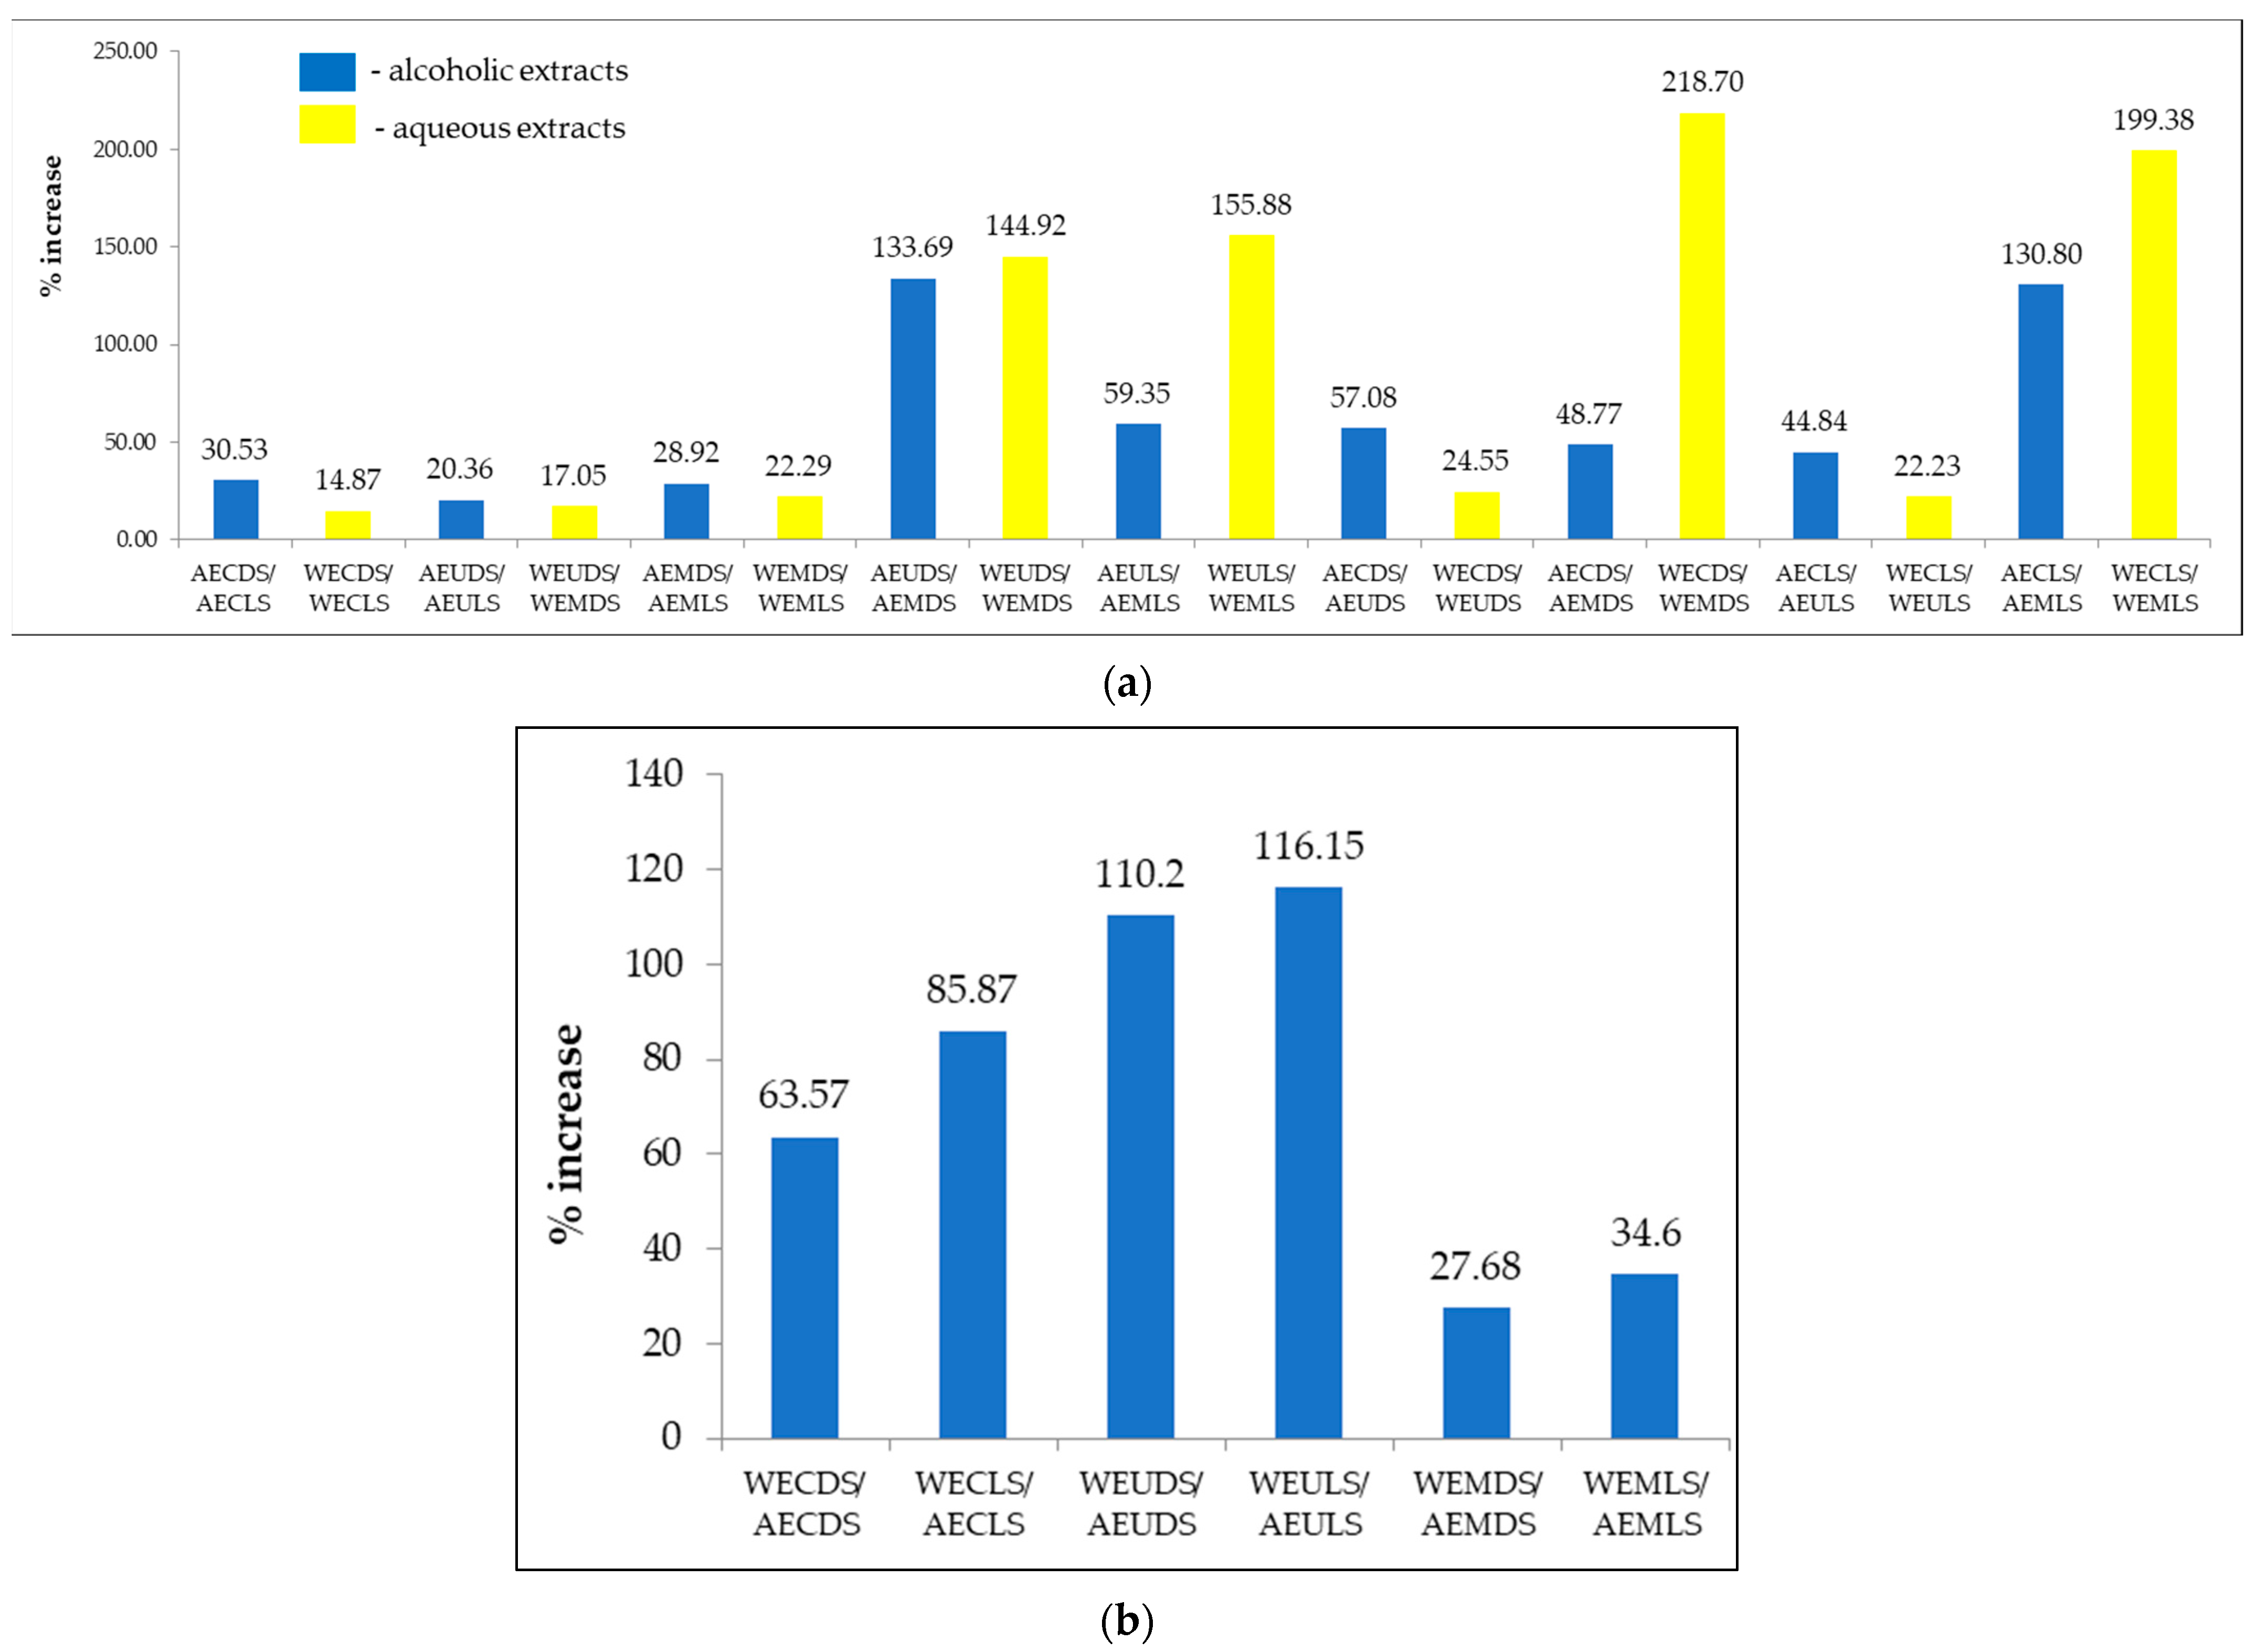
3.3. Antioxidant Activity

Since the antioxidant potential is a key parameter for establishing the therapeutic benefits of plant extracts, in this study, two antioxidant assays were used, radical scavenging (DPPH) and reducing power (FRAP), since the antioxidant properties of plant material extracts can be manifested by different mechanisms of action. Both assays are recommended as simple, fast, reproducible and cost-effective tools for evaluating the antioxidant activity of plant extracts [28].

3.3.1. Antioxidant Activity by Ferric Reducing Antioxidant Power (FRAP) Assay

Figure 4 illustrates the antioxidant activity expressed as ferric reducing antioxidant power for Sambucus nigra L. extracts (dried at ambient temperature and by lyophilization, respectively), obtained using different extraction solvents (water, respectively, 70% v/v ethyl alcohol) and different extraction techniques (conventional extraction and contemporary techniques such as microwave-assisted extraction and ultrasound-assisted extraction).
Particular attention was paid to assessing the impact of the extraction solvent, the drying conditions of the plant material, and the extraction technique used.
It can be seen (Figure 4) that for both room temperature dried and lyophilization Sambucus nigra L. samples, higher FRAP values were recorded for ethanolic extracts compared to those obtained for Sambucus nigra L. aqueous extracts.
Thus, the FRAP values were obtained for AEDS, EFTA, and AEUDS. AEULS, AEMDS, and AEMLS were higher than those recorded for the corresponding samples WEDS, WELS, WEUDS, WEULS, WEMDS, and WEMLS. These results are in agreement with those reported by Milena et al. [29], who found higher FRAP values in Sambucus nigra L. ethanolic extracts compared with aqueous extracts. Alcohols or mixtures of alcohol and water have been widely used to obtain plant extracts rich in bioactive compounds, such as polyphenols, with a demonstrated antioxidant effect since these compounds are more soluble in less polar solvents than water [30].
In the study conducted by Haș et al. [31], FRAP values of 185 μmol Fe2+/g DW were reported for alcoholic extracts of Sambucus nigra L. obtained via conventional extraction.
For both alcoholic and aqueous extracts, it was found that the initial processing of Sambucus nigra L. samples via lyophilization resulted in a higher degree of preservation of bioactive compounds with antioxidant action so that the FRAP values of extracts from lyophilization plant material were higher than those of extracts from samples dried at room temperature.
Thus, based on our results it was noted that FRAP (AECLS) > FRAP (AECDS), FRAP (AEULS) > FRAP (AEUDS), FRAP (AEMLS) > FRAP (AEMDS), respectively, FRAP (WECLS) > FRAP (WECDS), FRAP (WEULS) > FRAP (WEUDS); FRAP (WEMLS) > FRAP (WEMDS). The same finding was reported in the study carried out by Tabaszewska and Sikora [25] on the effect of stabilization of plant material by freezing, drying and freeze-drying on the composition and antioxidant properties of Sambucus nigra L. with the highest FRAP values reported for extracts prepared by maceration of lyophilization Sambucus nigra L. in hydroalcoholic solutions of ethanol or methanol.
Another aspect well highlighted in Figure 5 is that the extraction technique significantly influences the FRAP values of ethanolic and aqueous Sambucus nigra L. extracts. Thus, microwave-assisted extraction led to the highest FRAP values, followed by ultrasound-assisted extraction, with the lowest FRAP values being obtained for extracts obtained by the conventional extraction technique.
It is well documented that these modern techniques boost extraction efficiency via phenomena that occur along the processes, such as the interaction between the microwave and polar molecules in the medium during microwave-assisted extraction, whereas in ultrasound-assisted extraction, the phenomenon responsible is cavitation [32].
Both ultrasound-assisted and microwave-assisted extraction provide plant extracts with a higher concentration of active species and enhanced biological activity, and the advantages of these techniques over conventional ones have already been proven [32,33].
On the basis of the obtained ferric-reducing potential, it can be noted that the best extraction technique was the microwave-assisted extraction using 70% (v/v) ethyl alcohol as a solvent, followed by ultrasound-assisted extraction in 70% (v/v) ethyl alcohol since the extracts obtained by these techniques showed stronger antioxidant activity compared with the conventional extraction.
Figure 5 depicts the changes in the FRAP value of the extracts in response to Sambucus nigra L. drying conditions and extraction solvent (a) and extraction method (b).
From Figure 5a, it can be noted that lyophilization, applied as a method of stabilization of plant material, led to increases in FRAP value in the range of 14.87–30.53%, compared to Sambucus nigra L. samples conditioned by drying at ambient temperature. In addition, extraction in an alcoholic medium favoured the extraction of bioactive compounds with antioxidant action, recording increases in the FRAP value in the range of 27.68–116.15%, compared to the values of samples processed by extraction in an aqueous medium.
Regarding the impact of the extraction technique applied to the preparation of extracts, Figure 5 shows that ultrasound-assisted and microwave-assisted extraction resulted in increases in FRAP values in the range of 17.05–218.70%, respectively, compared to the values recorded by applying the conventional extraction technique. Microwave-assisted extraction also led to increases in FRAP values in the range of 17.05–155.88% compared to the values recorded by applying the ultrasound-assisted extraction technique.
These results may be the starting point for further research to create products with superior bioactivity and may open up new opportunities for exploiting the bioactive potential of this medicinal plant.

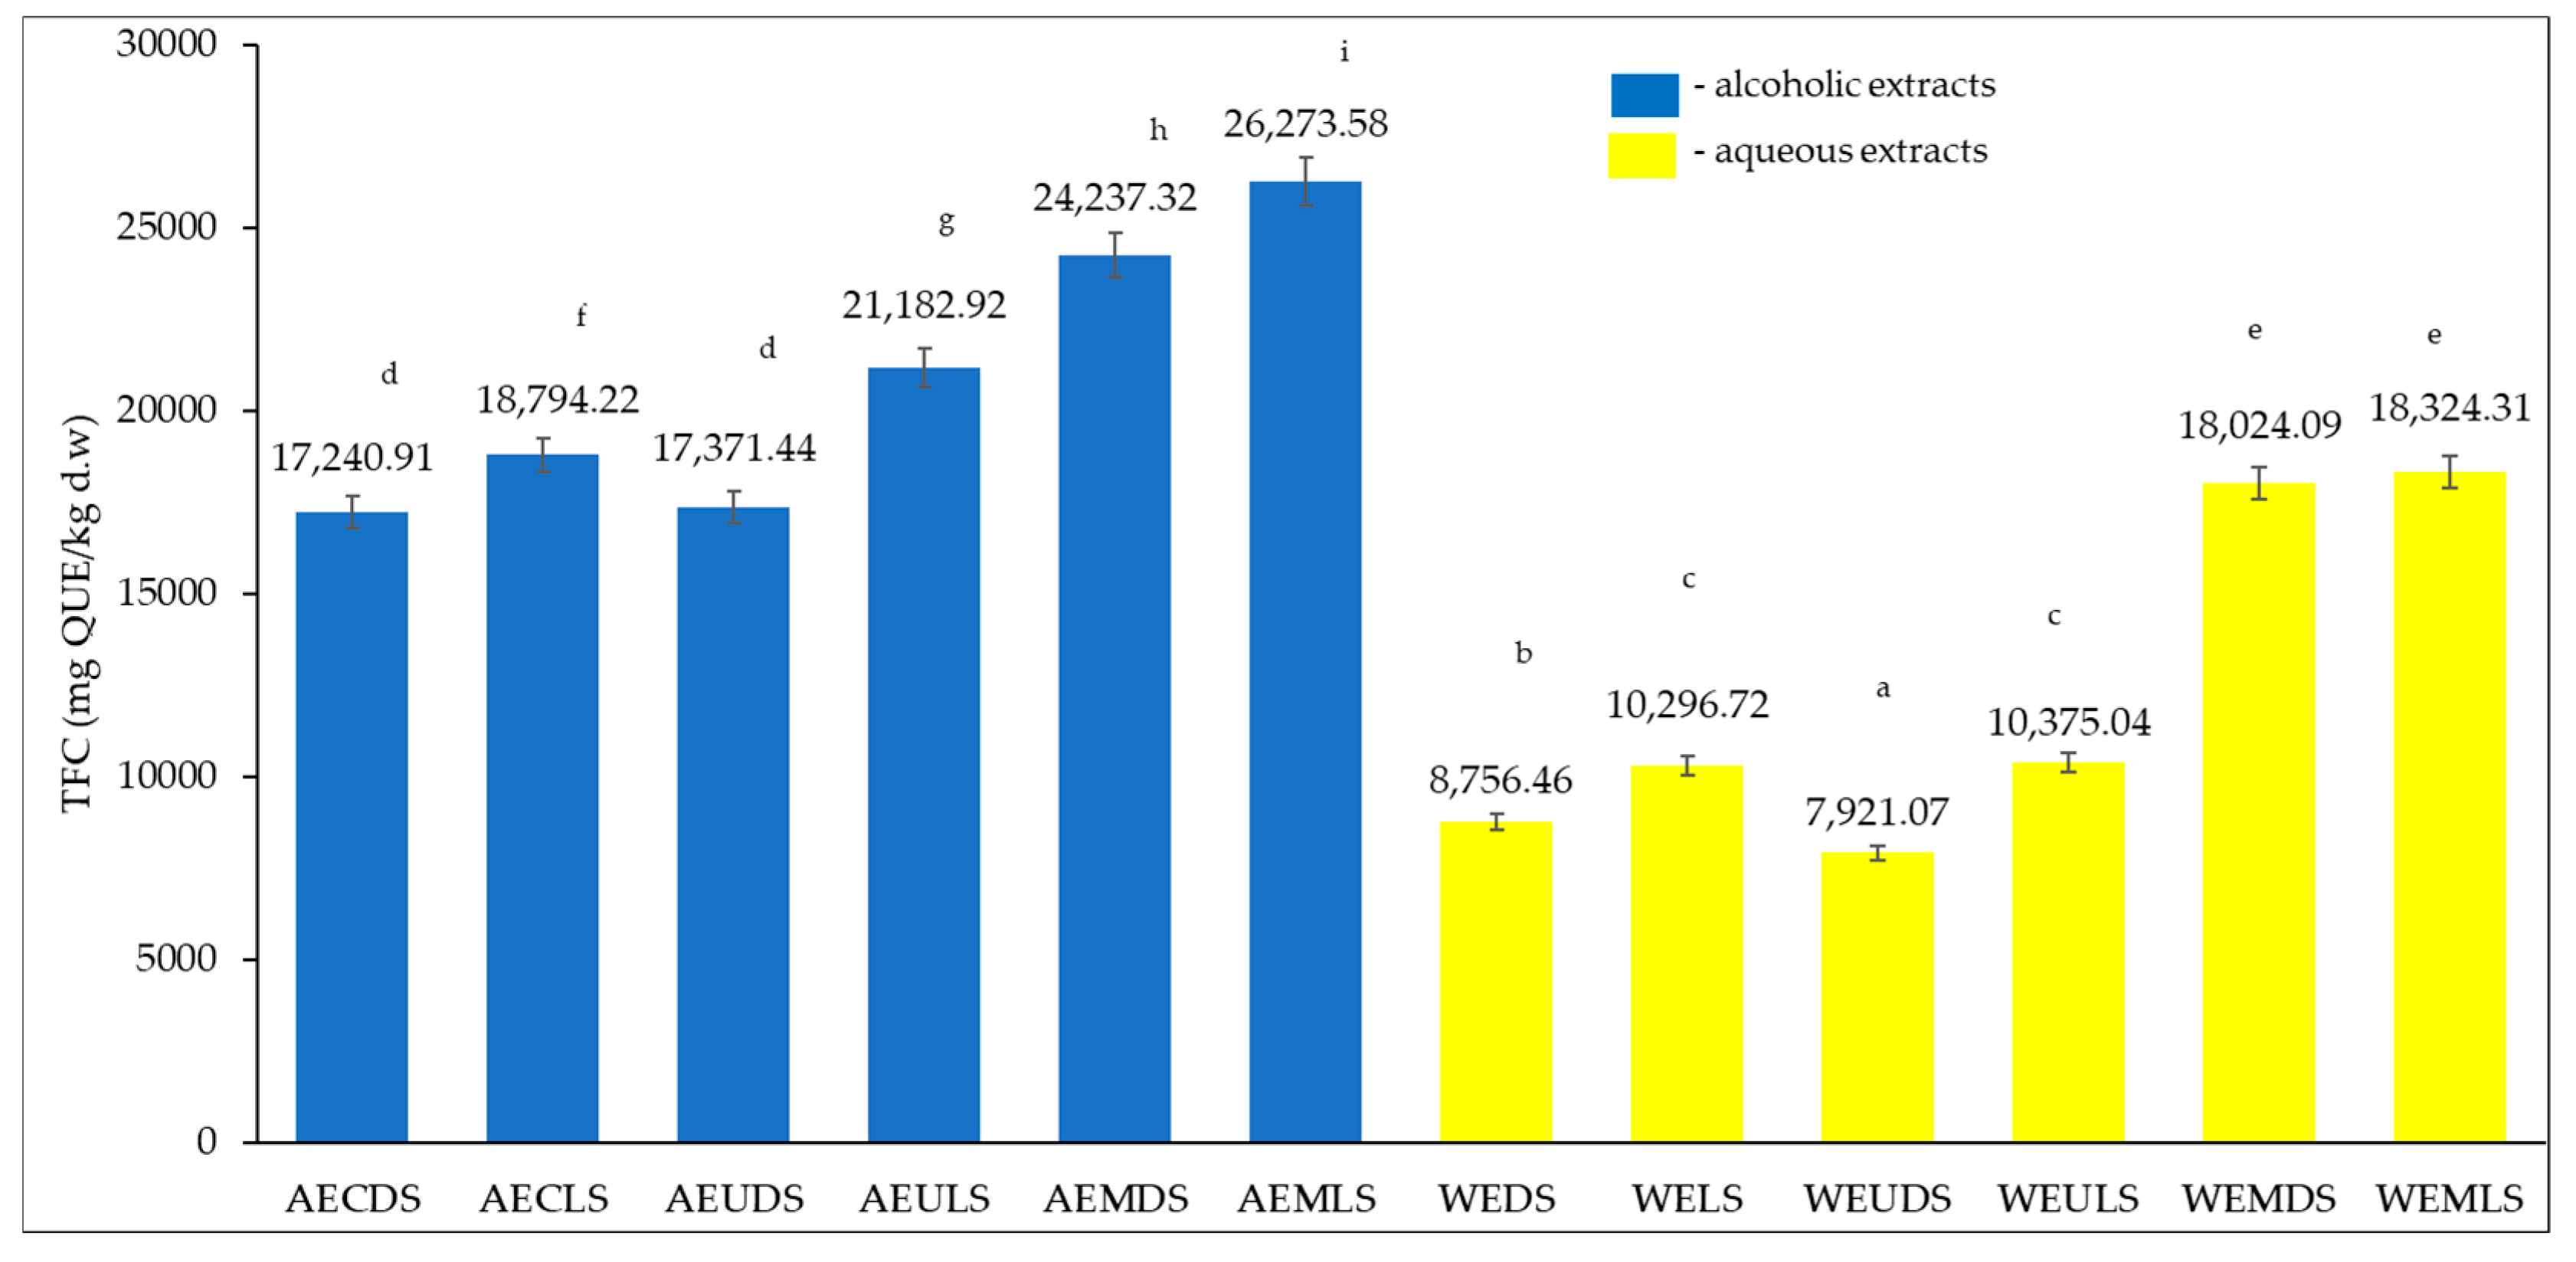
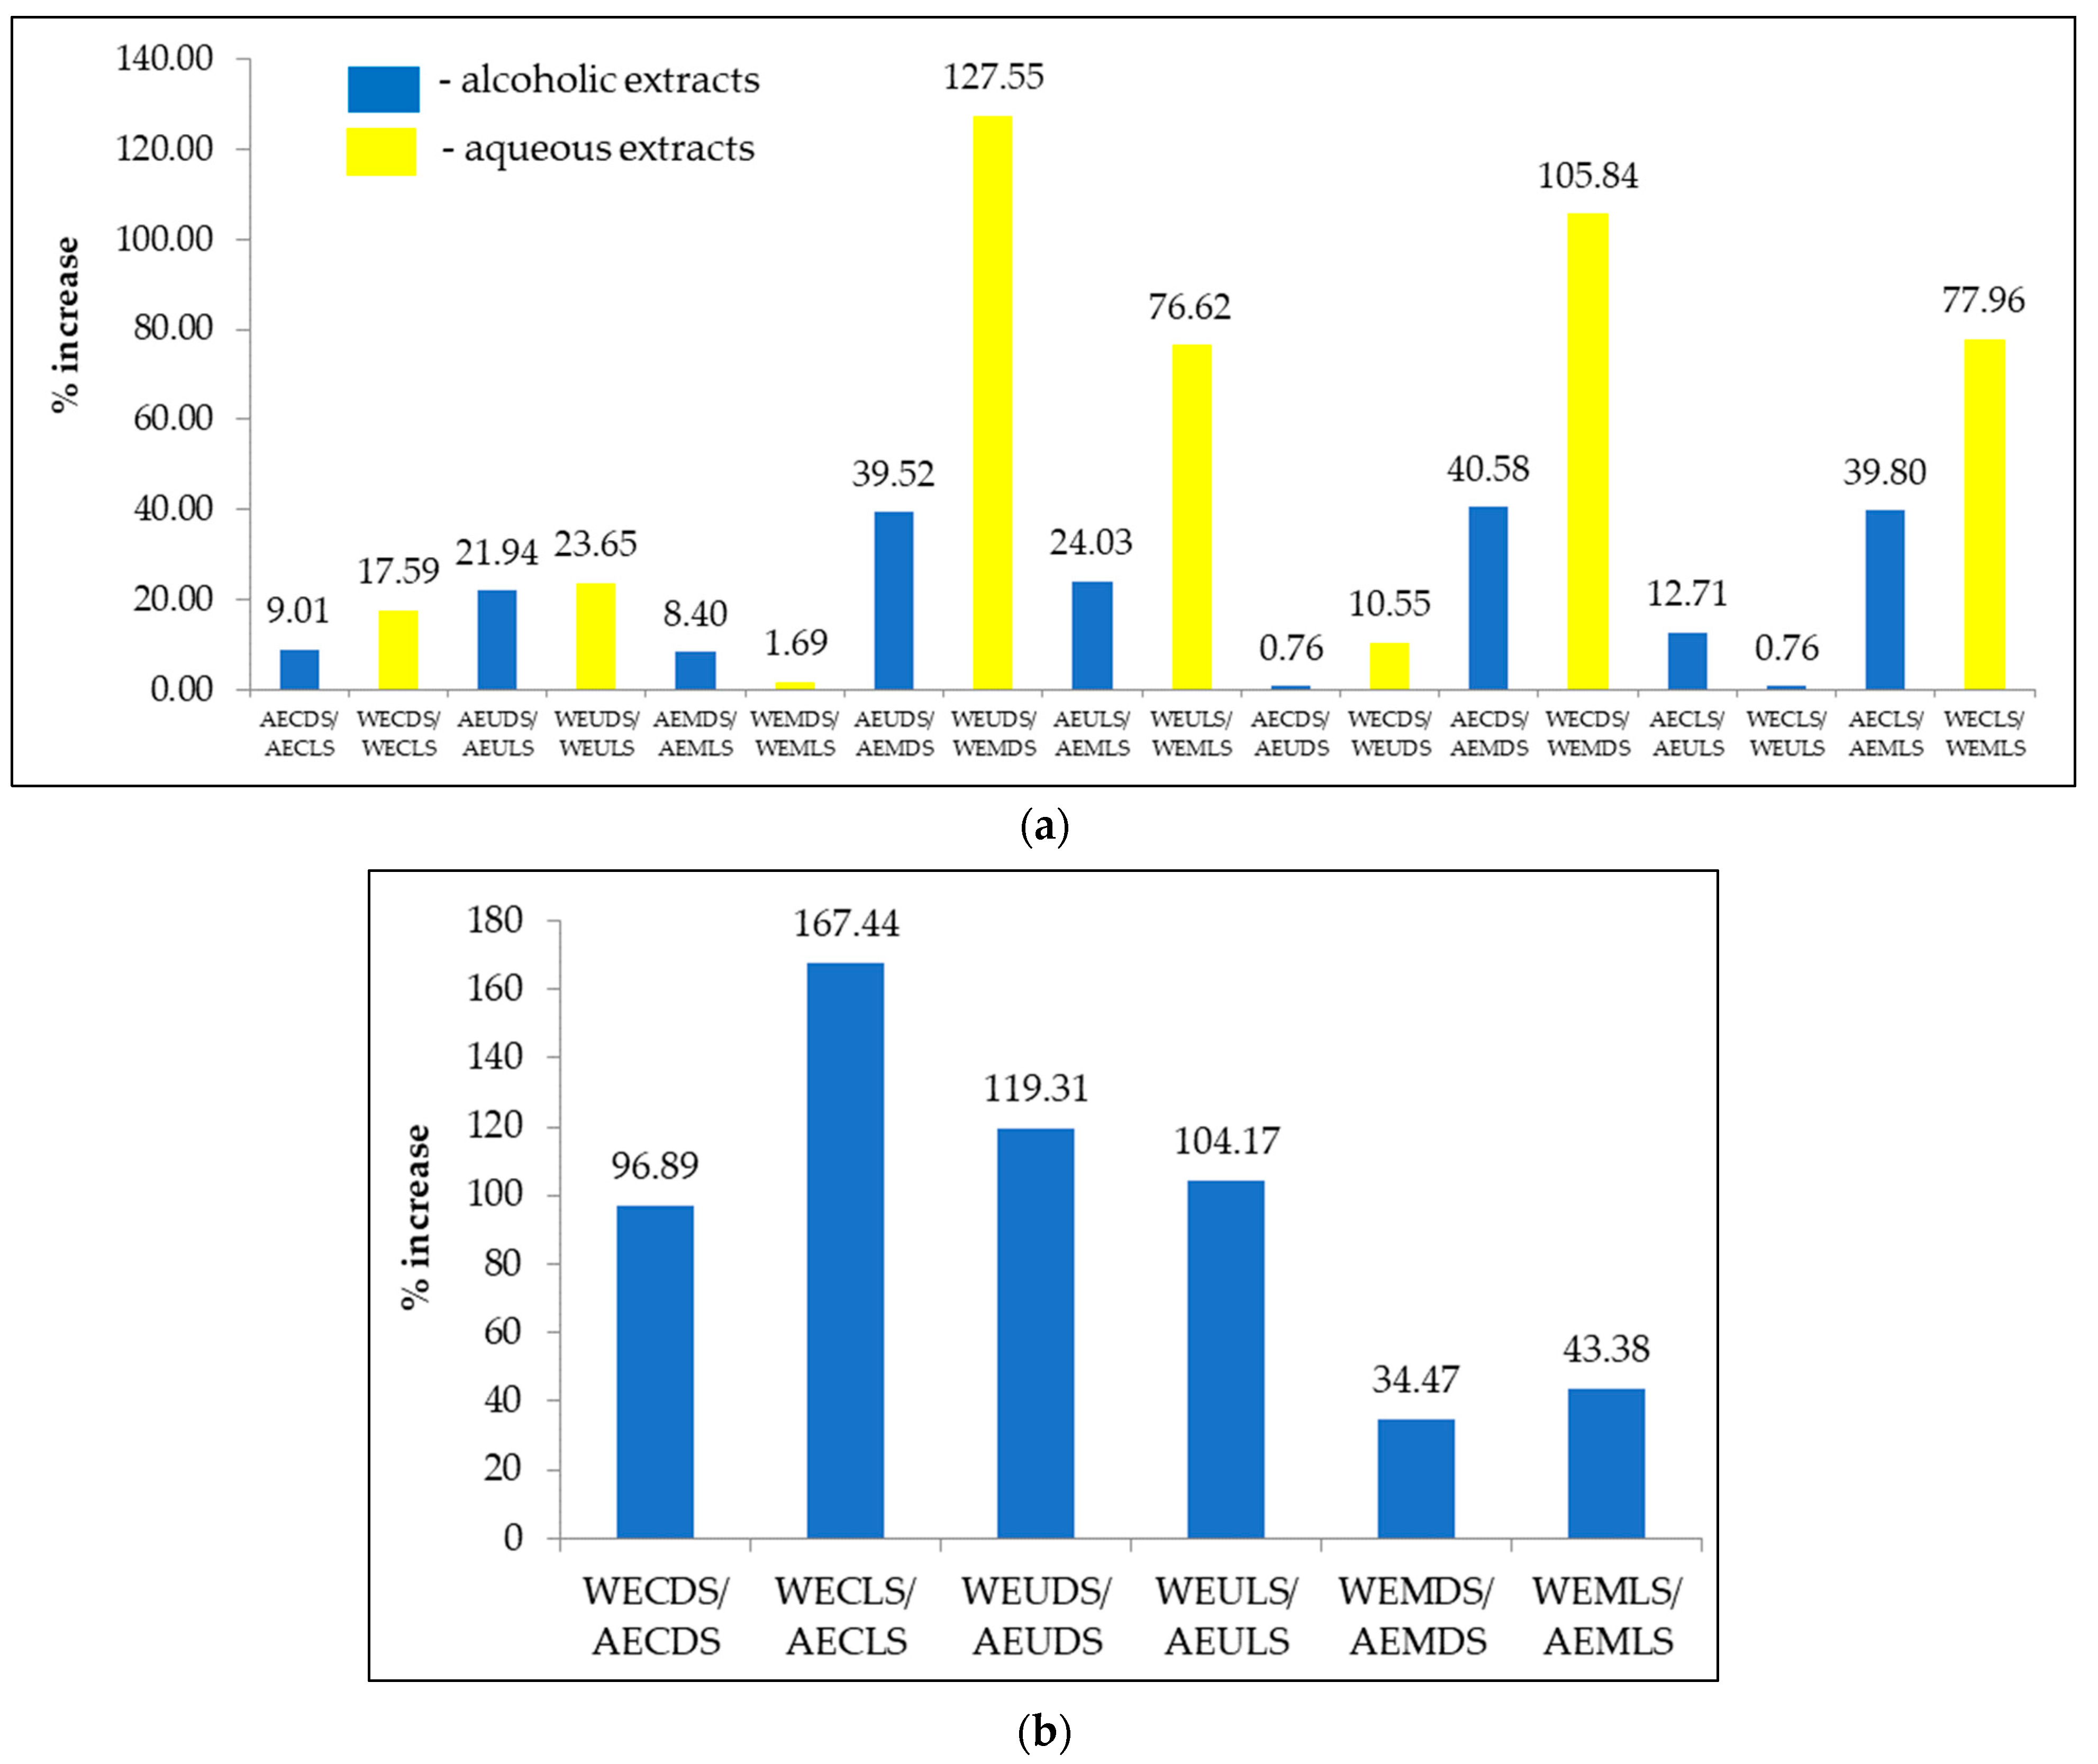
3.3.2. Determination of Total Flavonoids Content (TFC)

Figure 6 shows the flavonoid content of the Sambucus nigra L. extracts analyzed expressed as mg QUE/g dry weight (d.w.) using different drying methods, different solvents and different extraction methods.
Flavonoids include flavones, flavanols, and condensed tannins, compounds found in plants as secondary metabolites with antioxidant activity dependent on the presence of free OH groups, particularly 3-OH, and have antioxidant activity both in vitro and in vivo [17].
TFC levels ranged from 7,921.07 to 26,273.58 mg QUE/g d.w. for samples extracted from Sambucus nigra L., with maximum flavonoid content being recorded for the AEMLS sample (26,273.58 mg QUE/g d.w.) and the minimum for WEUDS (7,921.07 mg QUE/kg d.w.). By analyzing the drying method used, it can be seen that higher values were recorded for the lyophilization samples (10,296.72–26,273.58 mg QUE/kg) compared to the samples dried at room temperature (7921.07–2437.32 mg QUE/kg) (Figure 6). Regarding the solvent used for extraction, significantly higher values were recorded for alcoholic extracts (17,240.91–26,273.58 mg QUE/kg) than for aqueous extracts (7921.07–18,324.31 mg QUE/kg). The method of extraction also had a significant influence, with the highest values obtained for extracts prepared by microwave (18,024.09–26,273.58 mg QUE/g d.w.) followed by extracts obtained by ultrasound (10,375.04–21,182.92 mg QUE/kg) and the lowest values obtained by classical extraction (8756.46–18,794.22 mg QUE/kg). Significant differences (p < 0.05) were also found for TFC, except for AECDS/AEUDS, WECLS/WEUDS and WEMDS/WEMLS.
Analyzing the influence of the drying method on the TFC content of the alcoholic extracts (Figure 7), an almost insignificant increase can be observed between AECDS/AEUDS (0.76%) and a significantly higher increase between AECDS/AEMDS (40.58%). In the case of aqueous extracts (Figure 7), a small increase was recorded between WEMDS/WEMLS (1.69%) compared to WEUDS/WEMDS, between which the largest increase was recorded (127.55%). The influence of extraction solvent (Figure 7) is minimal between WEMDS/AEMDS (34.47%) and maximal between WECLS/AECLS (167.44%).
Similar TFC values have been reported by other researchers in the scientific literature. Gentscheva et al. [27] reported a total flavonoid content between 6.4 and 18.6 mg QE/g d.w. In another study, Tabaszewska et al. [25] also reported values similar to those recorded in our study, as follows: for the fresh plant, a content of 511.58 mg Catechin was recorded; for the frozen plant, 81.40 mg catechin; for the air-dried plant, 767.56 mg catechin; and for the lyophilization plant, a content of 575.16 mg catechin/g dry extract was reported. In another study, Dawidowicz et al. [34] reported for Sambucus nigra L. flowers a total flavonoid content of 139.342 g/100 g for an extract obtained at 20 °C and 214.250 g/100 g for an extract obtained at 100 °C.

3.3.3. Antioxidant Capacity by 1,1-Diphenyl-2-picrylhydrazyl (DPPH) Assay

The DPPH radical scavenging activity of the 12 Sambucus nigra L. extracts was determined using five different concentrations for each extract (Table 3). In parallel, the antioxidant activity of five ascorbic acid solutions in different concentrations (0.06–0.16 µg/mL) was evaluated as a positive control, resulting in 94.54% inhibition for the highest concentration tested (0.16 mg/mL). Subsequently, the concentration of each extract causing 50% DPPH inhibition (IC50) was calculated and expressed in µg/mL (Table 4).
As can be seen from the values presented in Table 4, the maximum radical scavenging activity was recorded at the highest concentration (1.67 µg/mL) for all samples. It can also be seen that the trend recorded for TPC, FRAP, and TFC is also maintained for the antioxidant capacity by DPPH evaluation. Thus, regarding the solvent used for extraction, a higher percentage of inhibition was recorded for alcoholic extracts (29.40–74.79%) compared to aqueous extracts (12.56–68.61%). The drying method used also had a significant influence, with lyophilization samples showing higher values (13.47–74.79%) compared to samples dried at room temperature (12.56–69.23%). Regarding the extraction method, the highest values were recorded for samples obtained by microwave extraction (34.79–74.79%), followed by samples obtained by ultrasonic extraction (15.02–67.49%) and the lowest values for samples obtained by conventional extraction (12.56–66.29%). Statistically significant differences (p < 0.05) were found between the majority of room temperature dried (D) and lyophilization (L) samples and between the majority of samples obtained by different extraction methods (C, L, and M) for all concentrations analyzed. The solvent used for extraction significantly (p < 0.05) influenced the results obtained between samples at all concentrations analyzed lyophilization. Table 4 shows the values obtained for IC50 compared to the value obtained for the control sample, ascorbic acid.
IC50 values (Table 5) ranged from 2.12 µg/mL for the AEMLS sample (highest antioxidant capacity) to 10.57 µg/mL (lowest antioxidant capacity) for the WECDS sample. It can be seen that a lower IC50 value was obtained for the AEMLS sample than for the ascorbic acid control sample, which means that it may provide greater protection against oxidation.
From the statistical analysis, it can be seen that between ascorbic acid and AEULS, AEMDS, and AEMDS, there were no statistically significant differences (p < 0.05), which means that these samples may have a similar antioxidant effect as ascorbic acid. Among the other samples, statistically significant differences (p < 0.05) were observed for most of them.
Similar values were reported by other authors for Sambucus nigra L. extracts. Dawidowicz et al. [34] reported an inhibition of 91.95% for extracts obtained with a 1:20 dilution at 20 °C and 94.15% for the extract obtained at 100 °C. Socaci et al. [35], in their study on the antioxidant activity of fresh and dried inflorescence samples, obtained an inhibition percentage of 28.4% for dried inflorescences and 52.54% for fresh inflorescences. Zawiślak et al. [36] reported inhibition percentages between 35 and 85% for elderberry flowers. Regarding IC50 values, Loizzo et al. [37], in their study on antioxidant and hypoglycemic properties of Sambucus nigra L. flowers, reported an IC50 value of 1.4 µg/mL. And Szymanski and Szymanski [23], obtained IC50 values for an aqueous (1:20) extract of Sambucus nigra L. flowers: a value of 0.69.

3.3.4. Individual Polyphenols Content Detected by LC-MS

Table 6 shows the chromatographic profile of individual polyphenols separated by LC-MS from the 12 extracts of Sambucus nigra L. In all 12 extracts, the major compound identified was rutin (5.12–9.15 mg/g d.w.), followed by quercitin (2.24–5.46 mg/g d.w.), resveratrol (0.25–0.87 mg/g d.w.), rosmarinic acid (0.37–1.38 mg/g d.w.), gallic acid (0.17–0.62 mg/g d.w.), epicatechin (0.14–0.42 mg/g d.w.), ferulic acid (0.10–0.47 mg/g d.w,), and coumaric acid (0.08–0.51 mg/g d.w.).
Statistically significant differences (p < 0.05) were recorded between samples obtained by different extraction methods (C, U, and M) but also between samples for which different extraction solvents were used (AE and WE). In the case of individual polyphenols, the drying method influenced the recorded values to a lesser extent.
From the analysis of the obtained results, it can be observed that, in this case also, the content of polyphenolic compounds was influenced by the drying method, the solvent used for extraction, and the extraction method used.
In terms of individual polyphenol content, the values recorded for the 12 extracts were in agreement with the values reported in the literature. Thus, Ferreira-Santos et al. [38] reported a quercitin content in Sambucus nigra L. flowers ranging from 181.2 to 577.1 µg/g. Other authors reported similar rutin contents, i.e., between 2.51– and 3.7 g/kg, ferulic acid of 2.51 g/kg, and quercitin of 0.79 g/kg [39]. Rojas-Ocampo et al. [40] reported for Sambucus nigra L. flowers a content of 0.98414 mg/g f.w. epicatechin, 0.04450 mg/g f.w. caffeic acid, and 0.05813 µg/g f.w. coumaric acid. Ferreira-Santos et al. [41] reported in their study a rosmarinic acid content ranging between 411 and 1563.5 mg/L, and Kucekova et al. [42] reported a caffeic acid content of 0.91319 mg/g d.w. In another study, Ferreira et al. [43] reported for gallic acid, values ranging between 0.53– and 2.00 mg/g d.w.; for caffeic acid, between 0.21 and 1.5 mg/g d.w.; for coumaric acid, between 0.17 and 0.45 mg/g d.w.; for ferulic acid, between 0.22 and 0.49 mg/g dw; and for quercitin, between 0.027 and 9.48 mg/g d.w. Viapiana and Wesolowski [28] reported a quercitin content in Sambucus nigra L. flowers between 2.07 and 9.48 mg/g d.w. and Demasi et al. [44] reported epicatechin contents between 0.018 and 0.118 mg/g d.w. and for quercetin 23.4 mg/100 g.

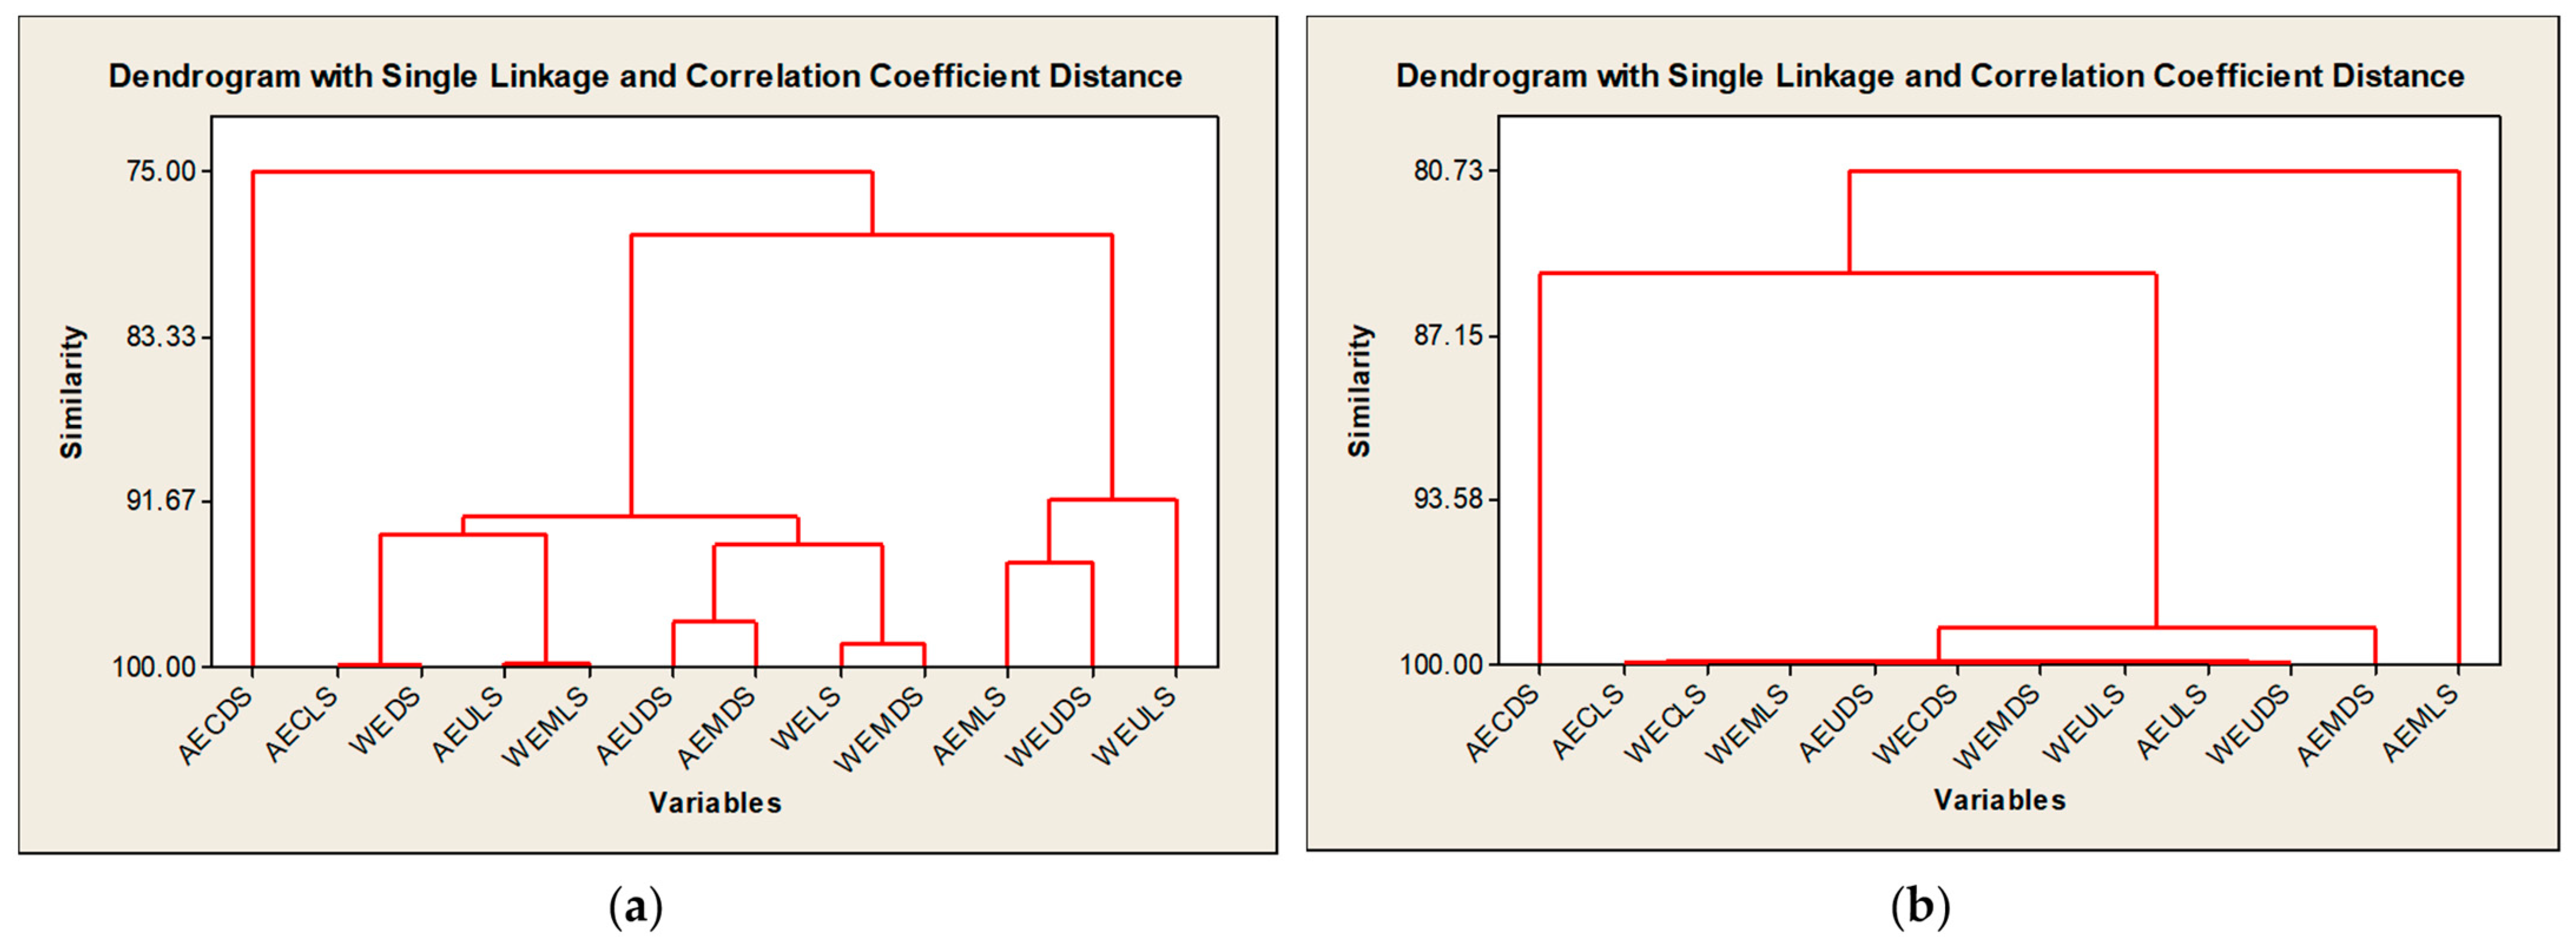
3.4. Cluster Analysis of Variables

Figure 8 shows Multivariate Cluster Variables for the TPC (a) and FRAP (b) values of the analyzed samples.

4. Conclusions

The experimental results obtained in this work revealed that the type and level of active principles in the 12 extracts analyzed differed depending on the drying method, the solvent used for extraction, and the extraction method used. Between the two drying methods used, freeze-drying resulted in the preservation of a higher number of bioactive compounds. Also, between the two solvents (70% ethyl alcohol and water) used to obtain the extracts, the alcohol resulted in the extraction of a higher number of bioactive compounds. Comparative analysis of the three extraction methods, conventional extraction, ultrasound-assisted extraction, and microwave extraction, led to the conclusion that the optimal extraction method for extracting active principles from Sambucus nigra L. flowers is the microwave method, followed by ultrasound extraction and conventional extraction. This paper had an innovative and applied character, which aimed to establish the optimal conditions for the extraction of bioactive compounds in order to ensure that the maximum content of compounds with strain-specific antioxidant or antimicrobial activity is obtained, depending on the intended use.

Author Contributions

Conceptualization, D.F., I.R., I.C. and E.A.; methodology, D.F., D.O., A.B., I.C., E.A., M.-A.P. and M.N.; software, I.C. and M.V.B.; validation, I.R. and E.A.; formal analysis, D.F., D.O., A.B., I.C., E.A., M.-A.P. and M.N.; investigation, D.F. and D.O.; resources, I.R.; data curation, D.F.; writing—original draft preparation, D.F., I.C. and M.-A.P.; writing—review and editing, D.F., D.O., A.B., I.C., E.A., M.-A.P. and M.N.; visualization, D.F., D.O., A.B., I.R., I.C., E.A., M.-A.P., M.N., and M.V.B.; supervision, I.R. and E.A.; project administration, I.R.; funding acquisition, I.R. All authors have read and agreed to the published version of the manuscript.

Funding

Support for the work was provided via the Horizon Europe (HORIZON) project 101071300—Sustainable Horizons—European Universities Designing Sustainability Horizons (SHEs).

Data Availability Statement

The analysis reports corresponding to the samples analyzed and presented in the paper can be provided by the Interdisciplinary Research Platform (PCI) at the University of Life Sciences “King Michael I”, Timisoara.

Acknowledgments

The authors of this research express their gratitude for the support provided by the Interdisciplinary Research Platform at the University of Life Sciences “King Michael I”, Timisoara, where the analyses were carried out.

Conflicts of Interest

The authors declare no conflict of interest.

References

  1. Charlebois, D.; Byers, P.L.; Finn, C.E.; Thomas, A.L. Elderberry: Botany, horticulture, potential. Hortic. Rev. 2010, 37, 213–280. [Google Scholar]
  2. Atkinson, M.D.; Atkinson, E. Sambucus nigra L. J. Ecol. 2002, 90, 895–923. [Google Scholar] [CrossRef]
  3. Tundis, R.; Ursino, C.; Bonesi, M.; Loizzo, M.R.; Sicari, V.; Pellicanò, T.; Manfredi, I.L.; Figoli, A.; Cassano, A. Flower and leaf extracts of Sambucus nigra L.: Application of membrane processes to obtain fractions with antioxidant and antityrosinase properties. Membranes 2019, 9, 127. [Google Scholar] [CrossRef] [PubMed]
  4. Młynarczyk, K.; Walkowiak-Tomczak, D.; Staniek, H.; Kidoń, M.; Łysiak, G.P. The content of selected minerals, bioactive compounds, and the antioxidant properties of the flowers and fruit of selected cultivars and wildly growing plants of Sambucus nigra L. Molecules 2020, 25, 876. [Google Scholar] [CrossRef] [PubMed]
  5. Młynarczyk, K.; Walkowiak-Tomczak, D.; Łysiak, G.P. Bioactive properties of Sambucus nigra L. as a functional ingredient for food and pharmaceutical industry. J. Funct. Foods 2018, 40, 377–390. [Google Scholar] [CrossRef] [PubMed]
  6. Hubert, C.; Tsiaparas, S.; Kahlert, L.; Luhmer, K.; Moll, M.D.; Passon, M.; Wüst, M.; Schieber, A.; Pude, R. Effect of Different Postharvest Methods on Essential Oil Content and Composition of Three Mentha Genotypes. Horticulturae 2023, 9, 960. [Google Scholar] [CrossRef]
  7. Christensen, K.; Olsen, L.; Kotowska, D.; Bhattacharya, S.; Fretté, X.; Færgeman, N.; Kristiansen, K.; Oksbjerg, N.; Christensen, L. Elderflowers (Sambucus nigra L.) have a significant impact on cellular mechanisms related to lipid storage and insulin resistance. Planta Medica 2010, 76, P633. [Google Scholar] [CrossRef]
  8. Pascariu, O.-E.; Israel-Roming, F. Bioactive compounds from Elderberry: Extraction, health benefits, and food applications. Processes 2022, 10, 2288. [Google Scholar] [CrossRef]
  9. Hearst, C.; McCollum, G.; Nelson, D.; Ballard, L.M.; Millar, B.C.; Goldsmith, C.E.; Rooney, P.J.; Loughrey, A.; Moore, J.E.; Rao, J.R. Antibacterial activity of elder (Sambucus nigra L.) flower or berry against hospital pathogens. J. Med. Plants Res. 2010, 4, 1805–1809. [Google Scholar]
  10. Harnett, J.; Oakes, K.; Carè, J.; Leach, M.; Brown, D.; Cramer, H.; Pinder, T.-A.; Steel, A.; Anheyer, D. The effects of Sambucus nigra berry on acute respiratory viral infections: A rapid review of clinical studies. Adv. Integr. Med. 2020, 7, 240–246. [Google Scholar] [CrossRef]
  11. Villalva, M.; Santoyo, S.; Salas-Pérez, L.; Siles-Sánchez, M.d.l.N.; Rodríguez García-Risco, M.; Fornari, T.; Reglero, G.; Jaime, L. Sustainable extraction techniques for obtaining antioxidant and anti-inflammatory compounds from the Lamiaceae and Asteraceae species. Foods 2021, 10, 2067. [Google Scholar] [CrossRef] [PubMed]
  12. Domínguez, R.; Zhang, L.; Rocchetti, G.; Lucini, L.; Pateiro, M.; Munekata, P.E.; Lorenzo, J.M. Elderberry (Sambucus nigra L.) as potential source of antioxidants. Characterization, optimization of extraction parameters and bioactive properties. Food Chem. 2020, 330, 127266. [Google Scholar] [CrossRef] [PubMed]
  13. Vatai, T.; Škerget, M.; Knez, Ž. Extraction of phenolic compounds from elder berry and different grape marc varieties using organic solvents and/or supercritical carbon dioxide. J. Food Eng. 2009, 90, 246–254. [Google Scholar] [CrossRef]
  14. Gullon, B.; Lú-Chau, T.A.; Moreira, M.T.; Lema, J.M.; Eibes, G. Rutin: A review on extraction, identification and purification methods, biological activities and approaches to enhance its bioavailability. Trends Food Sci. Technol. 2017, 67, 220–235. [Google Scholar] [CrossRef]
  15. Vilkhu, K.; Mawson, R.; Simons, L.; Bates, D. Applications and opportunities for ultrasound assisted extraction in the food industry—A review. Innov. Food Sci. Emerg. Technol. 2008, 9, 161–169. [Google Scholar] [CrossRef]
  16. Oniszczuk, A.; Olech, M.; Oniszczuk, T.; Wojtunik-Kulesza, K.; Wójtowicz, A. Extraction methods, LC-ESI-MS/MS analysis of phenolic compounds and antiradical properties of functional food enriched with elderberry flowers or fruits. Arab. J. Chem. 2019, 12, 4719–4730. [Google Scholar] [CrossRef]
  17. Horablaga, N.M.; Cozma, A.; Alexa, E.; Obistioiu, D.; Cocan, I.; Poiana, M.-A.; Lalescu, D.; Pop, G.; Imbrea, I.M.; Buzna, C. Influence of Sample Preparation/Extraction Method on the Phytochemical Profile and Antimicrobial Activities of 12 Commonly Consumed Medicinal Plants in Romania. Appl. Sci. 2023, 13, 2530. [Google Scholar] [CrossRef]
  18. Plustea, L.; Negrea, M.; Cocan, I.; Radulov, I.; Tulcan, C.; Berbecea, A.; Popescu, I.; Obistioiu, D.; Hotea, I.; Suster, G. Lupin (Lupinus spp.)-fortified bread: A sustainable, nutritionally, functionally, and technologically valuable solution for bakery. Foods 2022, 11, 2067. [Google Scholar] [CrossRef]
  19. Hulea, A.; Obiștioiu, D.; Cocan, I.; Alexa, E.; Negrea, M.; Neacșu, A.-G.; Hulea, C.; Pascu, C.; Costinar, L.; Iancu, I. Diversity of Monofloral Honey Based on the Antimicrobial and Antioxidant Potential. Antibiotics 2022, 11, 595. [Google Scholar] [CrossRef]
  20. Metzner Ungureanu, C.-R.; Poiana, M.-A.; Cocan, I.; Lupitu, A.I.; Alexa, E.; Moigradean, D. Strategies to improve the thermo-oxidative stability of sunflower oil by exploiting the antioxidant potential of blueberries processing byproducts. Molecules 2020, 25, 5688. [Google Scholar] [CrossRef]
  21. Benzie, I.F.; Strain, J.J. The ferric reducing ability of plasma (FRAP) as a measure of “antioxidant power”: The FRAP assay. Anal. Biochem. 1996, 239, 70–76. [Google Scholar] [CrossRef] [PubMed]
  22. Cadariu, A.I.; Cocan, I.; Negrea, M.; Alexa, E.; Obistioiu, D.; Hotea, I.; Radulov, I.; Poiana, M.-A. Exploring the Potential of Tomato Processing Byproduct as a Natural Antioxidant in Reformulated Nitrite-Free Sausages. Sustainability 2022, 14, 11802. [Google Scholar] [CrossRef]
  23. Szymanski, M.; Szymanski, A. Study on relationships between the content of chemical elements and polyphenols and antioxidant activity in Sambucus nigra. J. Elem. 2022, 27, 739–753. [Google Scholar] [CrossRef]
  24. Divis, P.; Porizka, J.; Vespalcová, M.; Matejicek, A.; Kaplan, J. Elemental composition of fruits from different black elder (Sambucus nigra L.) cultivars grown in the Czech Republic. J. Elem. 2015, 20, 549–557. [Google Scholar]
  25. Tabaszewska, M.; Sikora, E. The Effect of the Plant Stabilisation Method on the Composition and Antioxidant Properties of Elderflower (Sambucus nigra L.) Extract. Molecules 2023, 28, 2365. [Google Scholar] [CrossRef] [PubMed]
  26. Mikulic-Petkovsek, M.; Ivancic, A.; Schmitzer, V.; Veberic, R.; Stampar, F. Comparison of major taste compounds and antioxidative properties of fruits and flowers of different Sambucus species and interspecific hybrids. Food Chem. 2016, 200, 134–140. [Google Scholar] [CrossRef]
  27. Gentscheva, G.; Milkova-Tomova, I.; Nikolova, K.; Buhalova, D.; Andonova, V.; Gugleva, V.; Petkova, N.; Yotkovska, I.; Ivanova, N. Antioxidant activity and chemical characteristics of Sambucus nigra L. blossom from different regions in Bulgaria. Horticulturae 2022, 8, 309. [Google Scholar] [CrossRef]
  28. Viapiana, A.; Wesolowski, M. The phenolic contents and antioxidant activities of infusions of Sambucus nigra L. Plant Foods Hum. Nutr. 2017, 72, 82–87. [Google Scholar] [CrossRef]
  29. Milena, V.; Tatjana, M.; Gökhan, Z.; Ivana, B.; Aleksandra, C.; Mohammad, M.F.; Marija, R. Advantages of contemporary extraction techniques for the extraction of bioactive constituents from black elderberry (Sambucus nigra L.) flowers. Ind. Crops Prod. 2019, 136, 93–101. [Google Scholar] [CrossRef]
  30. Lemos, D.; Sonego, J.; Boschiero, M.; Araujo, E.; Cruz, A.; Badino, A. Selection and application of nontoxic solvents in extractive ethanol fermentation. Biochem. Eng. J. 2017, 127, 128–135. [Google Scholar] [CrossRef]
  31. Haș, I.M.; Teleky, B.-E.; Szabo, K.; Simon, E.; Ranga, F.; Diaconeasa, Z.M.; Purza, A.L.; Vodnar, D.-C.; Tit, D.M.; Nițescu, M. Bioactive Potential of Elderberry (Sambucus nigra L.): Antioxidant, Antimicrobial Activity, Bioaccessibility and Prebiotic Potential. Molecules 2023, 28, 3099. [Google Scholar] [CrossRef]
  32. Putnik, P.; Barba, F.J.; Lucini, L.; Rocchetti, G.; Montesano, D. Conventional, non-conventional extraction techniques and new strategies for the recovery of bioactive compounds from plant material for human nutrition. Food Res. Int. 2019, 123, 516–517. [Google Scholar] [CrossRef] [PubMed]
  33. Belwal, T.; Bhatt, I.D.; Rawal, R.S.; Pande, V. Microwave-assisted extraction (MAE) conditions using polynomial design for improving antioxidant phytochemicals in Berberis asiatica Roxb. ex DC. leaves. Ind. Crops Prod. 2017, 95, 393–403. [Google Scholar] [CrossRef]
  34. Dawidowicz, A.L.; Wianowska, D.; Baraniak, B. The antioxidant properties of alcoholic extracts from Sambucus nigra L.(antioxidant properties of extracts). LWT-Food Sci. Technol. 2006, 39, 308–315. [Google Scholar] [CrossRef]
  35. Socaci, S.A.; FĂRCAŞ, A.C.; TOFANĂ, M.; Pop, C.; Jimborean, M.; Nagy, M. Evaluation of Bioactive Compounds from Flowers and Fruits of Black Elder (Sambucus nigra L.). Bull. UASVM Food Sci. Technol. 2015, 72, 2. [Google Scholar] [CrossRef] [PubMed]
  36. Zawiślak, A.; Francik, R.; Francik, S.; Knapczyk, A. Impact of drying conditions on antioxidant activity of red clover (Trifolium pratense), sweet violet (Viola odorata) and elderberry flowers (Sambucus nigra). Materials 2022, 15, 3317. [Google Scholar] [CrossRef] [PubMed]
  37. Loizzo, M.R.; Pugliese, A.; Bonesi, M.; Tenuta, M.C.; Menichini, F.; Xiao, J.; Tundis, R. Edible flowers: A rich source of phytochemicals with antioxidant and hypoglycemic properties. J. Agric. Food Chem. 2016, 64, 2467–2474. [Google Scholar] [CrossRef] [PubMed]
  38. Ferreira-Santos, P.; Badim, H.; Salvador, Â.C.; Silvestre, A.J.; Santos, S.A.; Rocha, S.M.; Sousa, A.M.; Pereira, M.O.; Wilson, C.P.; Rocha, C.M. Chemical characterization of Sambucus nigra L. flowers aqueous extract and its biological implications. Biomolecules 2021, 11, 1222. [Google Scholar] [CrossRef]
  39. Neves, C.; Pinto, A.; Gonçalves, F.; Wessel, D.F. Changes in elderberry (Sambucus nigra L.) juice concentrate polyphenols during storage. Appl. Sci. 2021, 11, 6941. [Google Scholar] [CrossRef]
  40. Rojas-Ocampo, E.; Torrejón-Valqui, L.; Muñóz-Astecker, L.D.; Medina-Mendoza, M.; Mori-Mestanza, D.; Castro-Alayo, E.M. Antioxidant capacity, total phenolic content and phenolic compounds of pulp and bagasse of four Peruvian berries. Heliyon 2021, 7, e07787. [Google Scholar] [CrossRef]
  41. Ferreira-Santos, P.; Nogueira, A.; Rocha, C.M.; Wilson, C.P.; Teixeira, J.A.; Botelho, C. Sambucus nigra flower and berry extracts for food and therapeutic applications: Effect of gastrointestinal digestion on in vitro and in vivo bioactivity and toxicity. Food Funct. 2022, 13, 6762–6776. [Google Scholar] [CrossRef] [PubMed]
  42. Kucekova, Z.; Mlcek, J.; Humpolicek, P.; Rop, O. Edible flowers—Antioxidant activity and impact on cell viability. Open Life Sci. 2013, 8, 1023–1031. [Google Scholar] [CrossRef]
  43. Ferreira, S.S.; Silva, A.M.; Nunes, F.M. Sambucus nigra L. fruits and flowers: Chemical composition and related bioactivities. Food Rev. Int. 2022, 38, 1237–1265. [Google Scholar] [CrossRef]
  44. Demasi, S.; Caser, M.; Donno, D.; Enri, S.R.; Lonati, M.; Scariot, V. Exploring wild edible flowers as a source of bioactive compounds: New perspectives in horticulture. Folia Hortic. 2021, 33, 27–48. [Google Scholar] [CrossRef]
Figure 1. Flow chart for obtaining Sambucus nigra L. extracts (S).
Agronomy 13 03061 g001
Figure 2. TPC content for alcoholic and aqueous samples extracted. Results are expressed as the three-determination mean ± standard deviation (SD) indicated in the columns by error bars. Different lowercase letters (a–k) indicate statistically significant differences (p < 0.05) according to the t-test.
Agronomy 13 03061 g002
Figure 3. Changes in TPC values of Sambucus nigra L. extracts in response to drying conditions and extraction solvent (a) and extraction method (b).
Agronomy 13 03061 g003
Figure 4. FRAP values of ethanolic and aqueous extracts of Sambucus nigra L., both dried at room temperature and lyophilized. Results are expressed as the three-determination mean ± standard deviation (SD) indicated in the columns by error bars. Different lowercase letters (a–j) indicate statistically significant differences (p < 0.05) according to the t-test.
Agronomy 13 03061 g004
Figure 5. Changes in FRAP values of Sambucus nigra L. extracts in response to drying conditions and extraction solvent (a) and extraction method (b).
Agronomy 13 03061 g005
Figure 6. TFC content for alcoholic and aqueous samples extracted. Results are expressed as the three-determination mean ± standard deviation (SD) indicated in the columns by error bars. Different lowercase letters (a–i) indicate statistically significant differences (p < 0.05) according to the t-test.
Agronomy 13 03061 g006
Figure 7. Changes in TFC values of Sambucus nigra L. extracts in response to drying conditions and extraction solvent (a) and extraction method (b).
Agronomy 13 03061 g007
Figure 8. Hierarchical cluster analysis of the samples: (a) for TPC values and (b) for FRAP values.
Agronomy 13 03061 g008
Table 1. Equations used to calculate increments influenced by drying methods, extraction methods, and extraction solvent.
The Samples between the Increases Were CalculatedEquation
Increases influenced by drying methodsAECDS/AECLS I n c r e a s i n g   T P C D L % = T P C L T P C D   T P C D × 100   1.1 .
I n c r e a s i n g   T F C D L % = T F C L T F C D   T F C D × 100   1.2 .
I n c r e a s i n g   F R A P D L % = F R A P L F R A P D   F R A P D × 100   1.3 .
AEUDS/AEULS
AEMDS/AEMLS
WECDS/WECLS
WEUDS/WEULS
WEMDS/WEMLS
Increases influenced by extraction methodAECDS/AEUDS I n c r e a s i n g   T P C C U % = T P C U T P C C   T P C C × 100   2.1 .
I n c r e a s i n g   T F C C U % = T F C U T F C C   T F C C × 100   2.2 .
I n c r e a s i n g   F R A P C U % = F R A P U F R A P C   F R A P C × 100   2.3 .
AECLS/AEULS
WECDS/WEUDS
WECLS/WEULS
AECDS/AEMDS I n c r e a s i n g   T P C C M % = T P C M T P C C   T P C C × 100   3.1 .
I n c r e a s i n g   T F C C M % = T F C M T F C C   T F C C × 100   3.2 .
I n c r e a s i n g   F R A P C M % = F R A P M F R A P C   F R A P C × 100   3.3 .
AECLS/AEMLS
WECDS/WEMDS
WECLS/WEMLS
AEUDS/AEMDS I n c r e a s i n g   T P C U M % = T P C M T P C U   T P C U × 100   4.1 .
I n c r e a s i n g   T F C U M % = T F C M T F C U   T F C U × 100   4.2 .
I n c r e a s i n g   F R A P U M % = F R A P M F R A P U   F R A P U × 100   4.3 .
AEULS/AEMLS
WEUDS/WEMDS
WEULS/WEMLS
Increases influenced by solvent used in extractionWECDS/AECDS I n c r e a s i n g   T P C W E A E % = T P C A E T P C W E   T P C W E × 100   5.1 .
I n c r e a s i n g   T F C W E A E % = T F C A E T F C W E   T F C W E × 100   5.2 .
I n c r e a s i n g   F R A P W E A E % = F R A P A E F R A P W E   F R A P W E × 100   5.3
WECLS/AECLS
WEUDS/AEUDS
WEULS/AEULS
WEMDS/AEMDS
WEMLS/AEMLS
Table 2. Calibration curves and R2 for the 12 samples.
Compounds Calibration CurvesR2
Gallic acidy = 17.973x − 29.6540.993
Epicatechiny = 19.631x − 144.6660.996
Caffeic acidy = 22.018x − 38.2220.997
β-rezolcilicy = 29.581x − 39.4940.999
Cumaric acidy = 9.235x + 38.1960.998
Rutiny = 43.551x − 34.5110.997
Ferulic acidy = 2.087x − 25.9060.996
Rosmarinic acidy = 15.671x − 106.3090.997
Resveratroly = 181.457x − 1.6680.989
Quercitiney = 41.846x − 65.0500.999
Table 3. Macro and microelement content of Sambucus nigra L. (S).
SampleCu (ppm)Zn (ppm)Fe (ppm)Mn (ppm)Ca (ppm)Mg (ppm)K (ppm)
Sambucus nigra L. 11.28 ± 0.39 39.48 ± 1.3456.78 ± 2.1266.11 ± 2.243296.52 ± 98.893979.75 ± 107.452018.81± 60.55
Table 4. The DPPH radical scavenging activity (% inhibition) of ethanolic extracts vs. ascorbic acid.
Concentration (µg/mL)Ascorbic AcidConcentration (µg/mL)AECDSAECLSAEUDSAEULSAEMDSAEMLSConcentration (µg/mL)WECDSWECLSWEUDSWEULSWEMDSWEMLS
Inhibition (%)Inhibition (%)Inhibition (%)
0.0625.22 ± 0.75 f0.7129.40 ± 0.81 g29.69 ± 0.82 g31.79 ± 0.86 h 37.20 ± 0.83 e39.85 ± 0.93 i41.99 ± 0.97 j1.0012.56 ± 0.36 a13.47 ± 0.38 a15.02 ± 0.49 b17.28 ± 0.52 c34.79 ± 0.68 d37.11 ± 0.83 e
0.0845.58 ± 1.28 g,h0.8329.70 ± 0.83 d37.11 ± 0.81 e45.86 ± 1.29 g,h45.84 ± 1.29 g,h45.10 ± 1.1 g46.49 ± 1.19 h1.2514.89 ± 0.44 a15.38 ± 0.51 a16.65 ± 0.55 b21.14 ± 0.62 c36.48 ±0.79 e39.87 ± 0.87 f
0.1065.24 ± 1.89 j1.0038.12 ± 0.85 d44.07 ± 1.16 e50.87 ± 1.39 g53.55 ± 1.46 h53.82 ± 1.48 h60.52 ± 1.70 i1.6718.64 ± 0.54 a19.50 ± 0.58 a21.57 ± 0.61 b25.66 ± 0.74 c43.40 ± 1.07 e46.27 ± 1.27 f
0.1482.32 ± 2.42 k1.2546.25 ± 1.29 e53.53 ± 1.44 f58.63 ± 1.61 h66.92 ± 1.79 j58.92 ± 1.65 h61.84 ± 1.76 i2.5023.68 ± 0.67 a25.86 ± 0.72 b27.24 ± 0.74 c38.98 ± 0.89 d55.12 ± 1.46 g58.14 ± 1.57 h
0.1694.54 ± 2.78 j1.6760.53 ± 1.72 d66.29 ± 1.77 f,g67.35 ± 1.79 f,g67.49 ± 1.82 f,g69.23 ± 1.88 h74.79 ± 1.94 i5.0028.23 ± 0.83 a37.64 ± 0.85 b38.86 ± 0.87 c55.95 ± 1.54 c64.91 ± 1.58 e68.61 ± 1.85 g,h
Results are expressed as the mean of three determinations ± standard deviation (SD). Different lowercase letters (a–k) indicate statistically significant differences between samples in a row (p < 0.05) according to the t-test.
Table 5. The IC50 value of sample extracts vs. ascorbic acid.
SamplesIC50 (µg/mL)
Ascorbic acid2.28 ± 0.06 a
AECDS4.16 ± 0.12 e
AECLS3.43 ± 0.10 d
AEUDS2.89 ± 0.07 b,c
AEULS2.48 ± 0.06 a,b
AEMDS2.53 ± 0.07 a,b
AEMLS2.12 ± 0.05 a
WECDS10.57 ± 0.29 h
WECLS7.69 ± 0.23 g
WEUDS7.48 ± 0.21 g
WEULS4.91 ± 0.14 f
WEMDS3.38 ± 0.09 d
WEMLS3.00 ± 0.08 c,d
Results are expressed as the mean of three determinations ± standard deviation (SD). Different lowercase letters (a–h) indicate statistically significant differences between samples on the column (p < 0.05) according to the t-test.
Table 6. Individual polyphenols (mg/g) detected using LC/MS from Sambucus nigra L. extracts.
Gallic Acid (mg/gd.w.)Epicatechin
(mg/g d.w.)
Caffeic Acid (mg/g d.w.)β-Rezolcilic
(mg/g d.w.)
Cumaric Acid (mg/gd.w.)Rutin
(mg/gd.w.)
Ferulic Acid (mg/g d.w.)Rosmarinic Acid (mg/g d.w.)Resveratrol (mg/g d.w.)Quercitine
(mg/g d.w.)
AECDS0.30 ± 0.01 c0.27 ± 0.01 c0.15 ± 0.01 bnd *0.13 ± 0.01 b6.57 ± 0.30 b0.28 ± 0.01 c,d0.41 ± 0.02 a0.49 ± 0.02 c2.24 ± 0.09 a
AECLS0.33 ± 0.01 c,d0.29 ± 0.01 c0.26 ± 0.01 cnd0.15 ± 0.01 b7.19 ± 0.35 c0.25 ± 0.01 c0.54 ± 0.02 b0.51 ± 0.02 c,d2.61 ± 0.10 b
AEUDS0.35 ± 0.01 c,d0.31 ± 0.01 c,d0.32 ± 0.01 dnd0.17 ± 0.01 b7.22 ± 0.35 c0.26 ± 0.01 c0.58 ± 0.02 b0.56 ± 0.02 d,e2.65 ± 0.11 c
AEULS0.37 ± 0.01 d0.32 ± 0.01 c,d0.35 ± 0.01 d0.02 ± 0.00 a0.41 ± 0.02 c7.96 ± 0.37 d0.13 ± 0.01 a,b0.68 ± 0.03 c0.61 ± 0.03 e2.57 ± 0.10 b,c
AEMDS0.58 ± 0.02 e,f0.39 ± 0.01 e,f1.37 ± 0.05 f0.03 ± 0.00 a0.45 ± 0.02 c7.96 ± 0.41 d0.32 ± 0.01 d1.24 ± 0.04 d0.87 ± 0.03 f4.57 ± 0.21 e
AEMLS0.62 ± 0.02 f0.42 ± 0.02 f1.42 ± 0.06 f0.05 ± 0.00 a0.51 ± 0.02 d9.15 ± 0.45 e0.47 ± 0.02 e1.38 ± 0.05 d0.89 ± 0.03 f5.46 ± 0.25 f
WECDS0.18 ± 0.01 a0.15 ± 0.01 a,b0.07 ± 0.01 a0.01 ± 0.00 a0.41 ± 0.02 c7.93 ± 0.36 d0.12 ± 0.01 a0.38 ± 0.01 a0.28 ± 0.01 a2.57 ± 0.11 b
WECLS0.20 ± 0.01 a,b0.18 ± 0.01 a,b0.10 ± 0.01 a,b0.02 ± 0.00 a0.41 ± 0.02 c7.95 ± 0.36 d0.13 ± 0.01 a,b0.42 ± 0.02 a0.27 ± 0.01 a2.56 ± 0.10 b,c
WEUDS0.17 ± 0.01 a0.14 ± 0.01 a0.06 ± 0.01 and0.08 ± 0.01 a5.12 ± 0.25 a0.10 ± 0.01 a0.40 ± 0.02 a0.25 ± 0.01 a2.52 ± 0.09 b
WEULS0.24 ± 0.01 b0.20 ± 0.01 b0.28 ± 0.01 c0.02 ± 0.00 a0.42 ± 0.05 c7.91 ± 0.34 d0.13 ± 0.01 a,b0.37 ± 0.01 a0.35 ± 0.01 b3.56 ± 0.18 d
WEMDS0.38 ± 0.01 d0.33 ± 0.01 c,d0.35 ± 0.01 dnd0.41 ± 0.02 c7.93 ± 0.35 d0.16 ± 0.01 b0.71 ± 0.03 c0.69 ± 0.02 e4.59 ± 0.22 e
WEMLS0.55 ± 0.02 e0.35 ± 0.01 d,e1.18 ± 0.04 e0.03 ± 0.00 a0.40 ± 0.02 c7.95 ± 0.36 d0.25 ± 0.01 c0.68 ± 0.03 c0.71 ± 0.02 e4.56 ± 0.20 e
Results are expressed as the three-determination mean ± standard deviation (SD). Different lowercase letters (a–f) indicate statistically significant differences between samples (p < 0.05) according to the t-test. * nd—not detectable.
Disclaimer/Publisher’s Note: The statements, opinions and data contained in all publications are solely those of the individual author(s) and contributor(s) and not of MDPI and/or the editor(s). MDPI and/or the editor(s) disclaim responsibility for any injury to people or property resulting from any ideas, methods, instructions or products referred to in the content.

