Article

Only Hematopoietic Stem and Progenitor Cells from Cord Blood Are Susceptible to Malignant Transformation by MLL-AF4 Translocations

1
Department of Hematology, Oncology, Clinical Immunology and Rheumatology, University Hospital Tuebingen, 72076 Tuebingen, Germany
2
Synthego Corporation, Menlo Park, CA 94025, USA
3
Institute of Medical Genetics and Applied Genomics, University of Tuebingen, 72076 Tuebingen, Germany
4
Institute of Pathology and Neuropathology, University of Tuebingen, 72076 Tuebingen, Germany
*
Author to whom correspondence should be addressed.
These authors contributed equally to this work.
Cancers 2020, 12(6), 1487; https://doi.org/10.3390/cancers12061487
Submission received: 15 April 2020 / Revised: 1 June 2020 / Accepted: 5 June 2020 / Published: 7 June 2020

Abstract

:
Mixed lineage leukemia (MLL) (KMT2A) rearrangements (KMT2Ar) play a crucial role in leukemogenesis. Dependent on age, major differences exist regarding disease frequency, main fusion partners and prognosis. In infants, up to 80% of acute lymphoid leukemia (ALL) bear a MLL translocation and half of them are t(4;11), resulting in a poor prognosis. In contrast, in adults only 10% of acute myeloid leukemia (AML) bear t(9;11) with an intermediate prognosis. The reasons for these differences are poorly understood. Recently, we established an efficient CRISPR/Cas9-based KMT2Ar model in hematopoietic stem and progenitor cells (HSPCs) derived from human cord blood (huCB) and faithfully mimicked the underlying biology of the disease. Here, we applied this model to HSPCs from adult bone marrow (huBM) to investigate the impact of the cell of origin and fusion partner on disease development. Both genome-edited infant and adult KMT2Ar cells showed monoclonal outgrowth with an immature morphology, myelomonocytic phenotype and elevated KMT2Ar target gene expression comparable to patient cells. Strikingly, all KMT2Ar cells presented with indefinite growth potential except for MLL-AF4 huBM cells ceasing proliferation after 80 days. We uncovered FFAR2, an epigenetic tumor suppressor, as potentially responsible for the inability of MLL-AF4 to immortalize adult cells under myeloid conditions.

1. Introduction

The chromosomal translocations of the mixed lineage leukemia (MLL, KMT2A) gene are found in both acute myeloid leukemia (AML) and acute lymphoid leukemia (ALL) [1]. However, the frequency and the prognosis of KMT2A rearranged (KMT2Ar) leukemia differ with age and the reasons for that are only partially understood. In infants, KMT2Ar leukemia accounts for up to 80% of ALL with AF4 as the main fusion partner and is associated with a particularly poor prognosis [2]. The responsible genetic alterations occur in utero in a cell of fetal origin [3]. Whereas in adults, the majority of KMT2Ar leukemia is AML with AF9 as the main fusion partner being associated with an intermediate prognosis. The translocation occurs most likely in hematopoietic stem or progenitor cells (HSPCs) derived from human bone marrow (huBM) possessing an inherent self-renewal capacity [1]. This is supported by the observation, that KMT2Ar leukemias often co-express myeloid and lymphoid markers suggesting that the cell of origin has to be a HSPC qualified to express both lineage markers [4]. Further evidence is supplied by the clinical observation that KMT2Ar ALL following CD19-targeted therapy can represent as AML in relapse [5]. Similarly, only HSPCs live long enough that additional genetic alterations, that may be required for KMT2Ar leukemogenesis, can accumulate in this cell type and its progeny. Whereas adult KMT2Ar leukemia often occurs in pretreated patients as secondary acute leukemia and additional cooperating mutations are mostly required for full leukemia transformation, infant KMT2Ar leukemias develop as de novo leukemia bearing only very few additional mutations [6,7,8]. Thus, the consequences of genetic changes in HSPCs derived from infant and adults leading to leukemia development are distinct in both cell types. In humanized mouse models, Horton et al. could show that human cord blood (huCB) cells were more susceptible for a retroviral MLL-AF9 immortalization, whereas retrovirally transduced huBM cells failed to immortalize in vitro and did not develop leukemia in vivo [9]. Similarly, by using mouse cells and an MLL-ENL fusion transcript Okeyo-Owuor et al. could demonstrate that the efficiency of MLL-ENL-driven AML changes with age with a peak shortly after birth [10]. In addition, the respective fusion partner has potential influence on leukemia development, as we and others could demonstrate its important role on the resultant phenotype: ENL exclusively led to ALL, whereas AF9 presented as AML, ALL or mixed phenotype in mouse xenograft models [11,12]. Moreover, the microenvironment plays a dominant role in instructing lineage fate [13]. In summary, these observations imply that crucial differences in leukemia development exist dependent on the fusion partner, the microenvironment and finally the cell of origin, in which the mutation develops. However, until now the performed studies were mainly based on artificial systems solely utilizing mouse cells or retroviral transduced oncogenes with unknown effects for the resultant human leukemias. In this study, we used CRISPR/Cas9 to introduce translocations of the MLL and AF4 or AF9 genes under physiologic promotors in both huCB and huBM cells, faithfully mimicking the patient nature of the disease.

2. Results

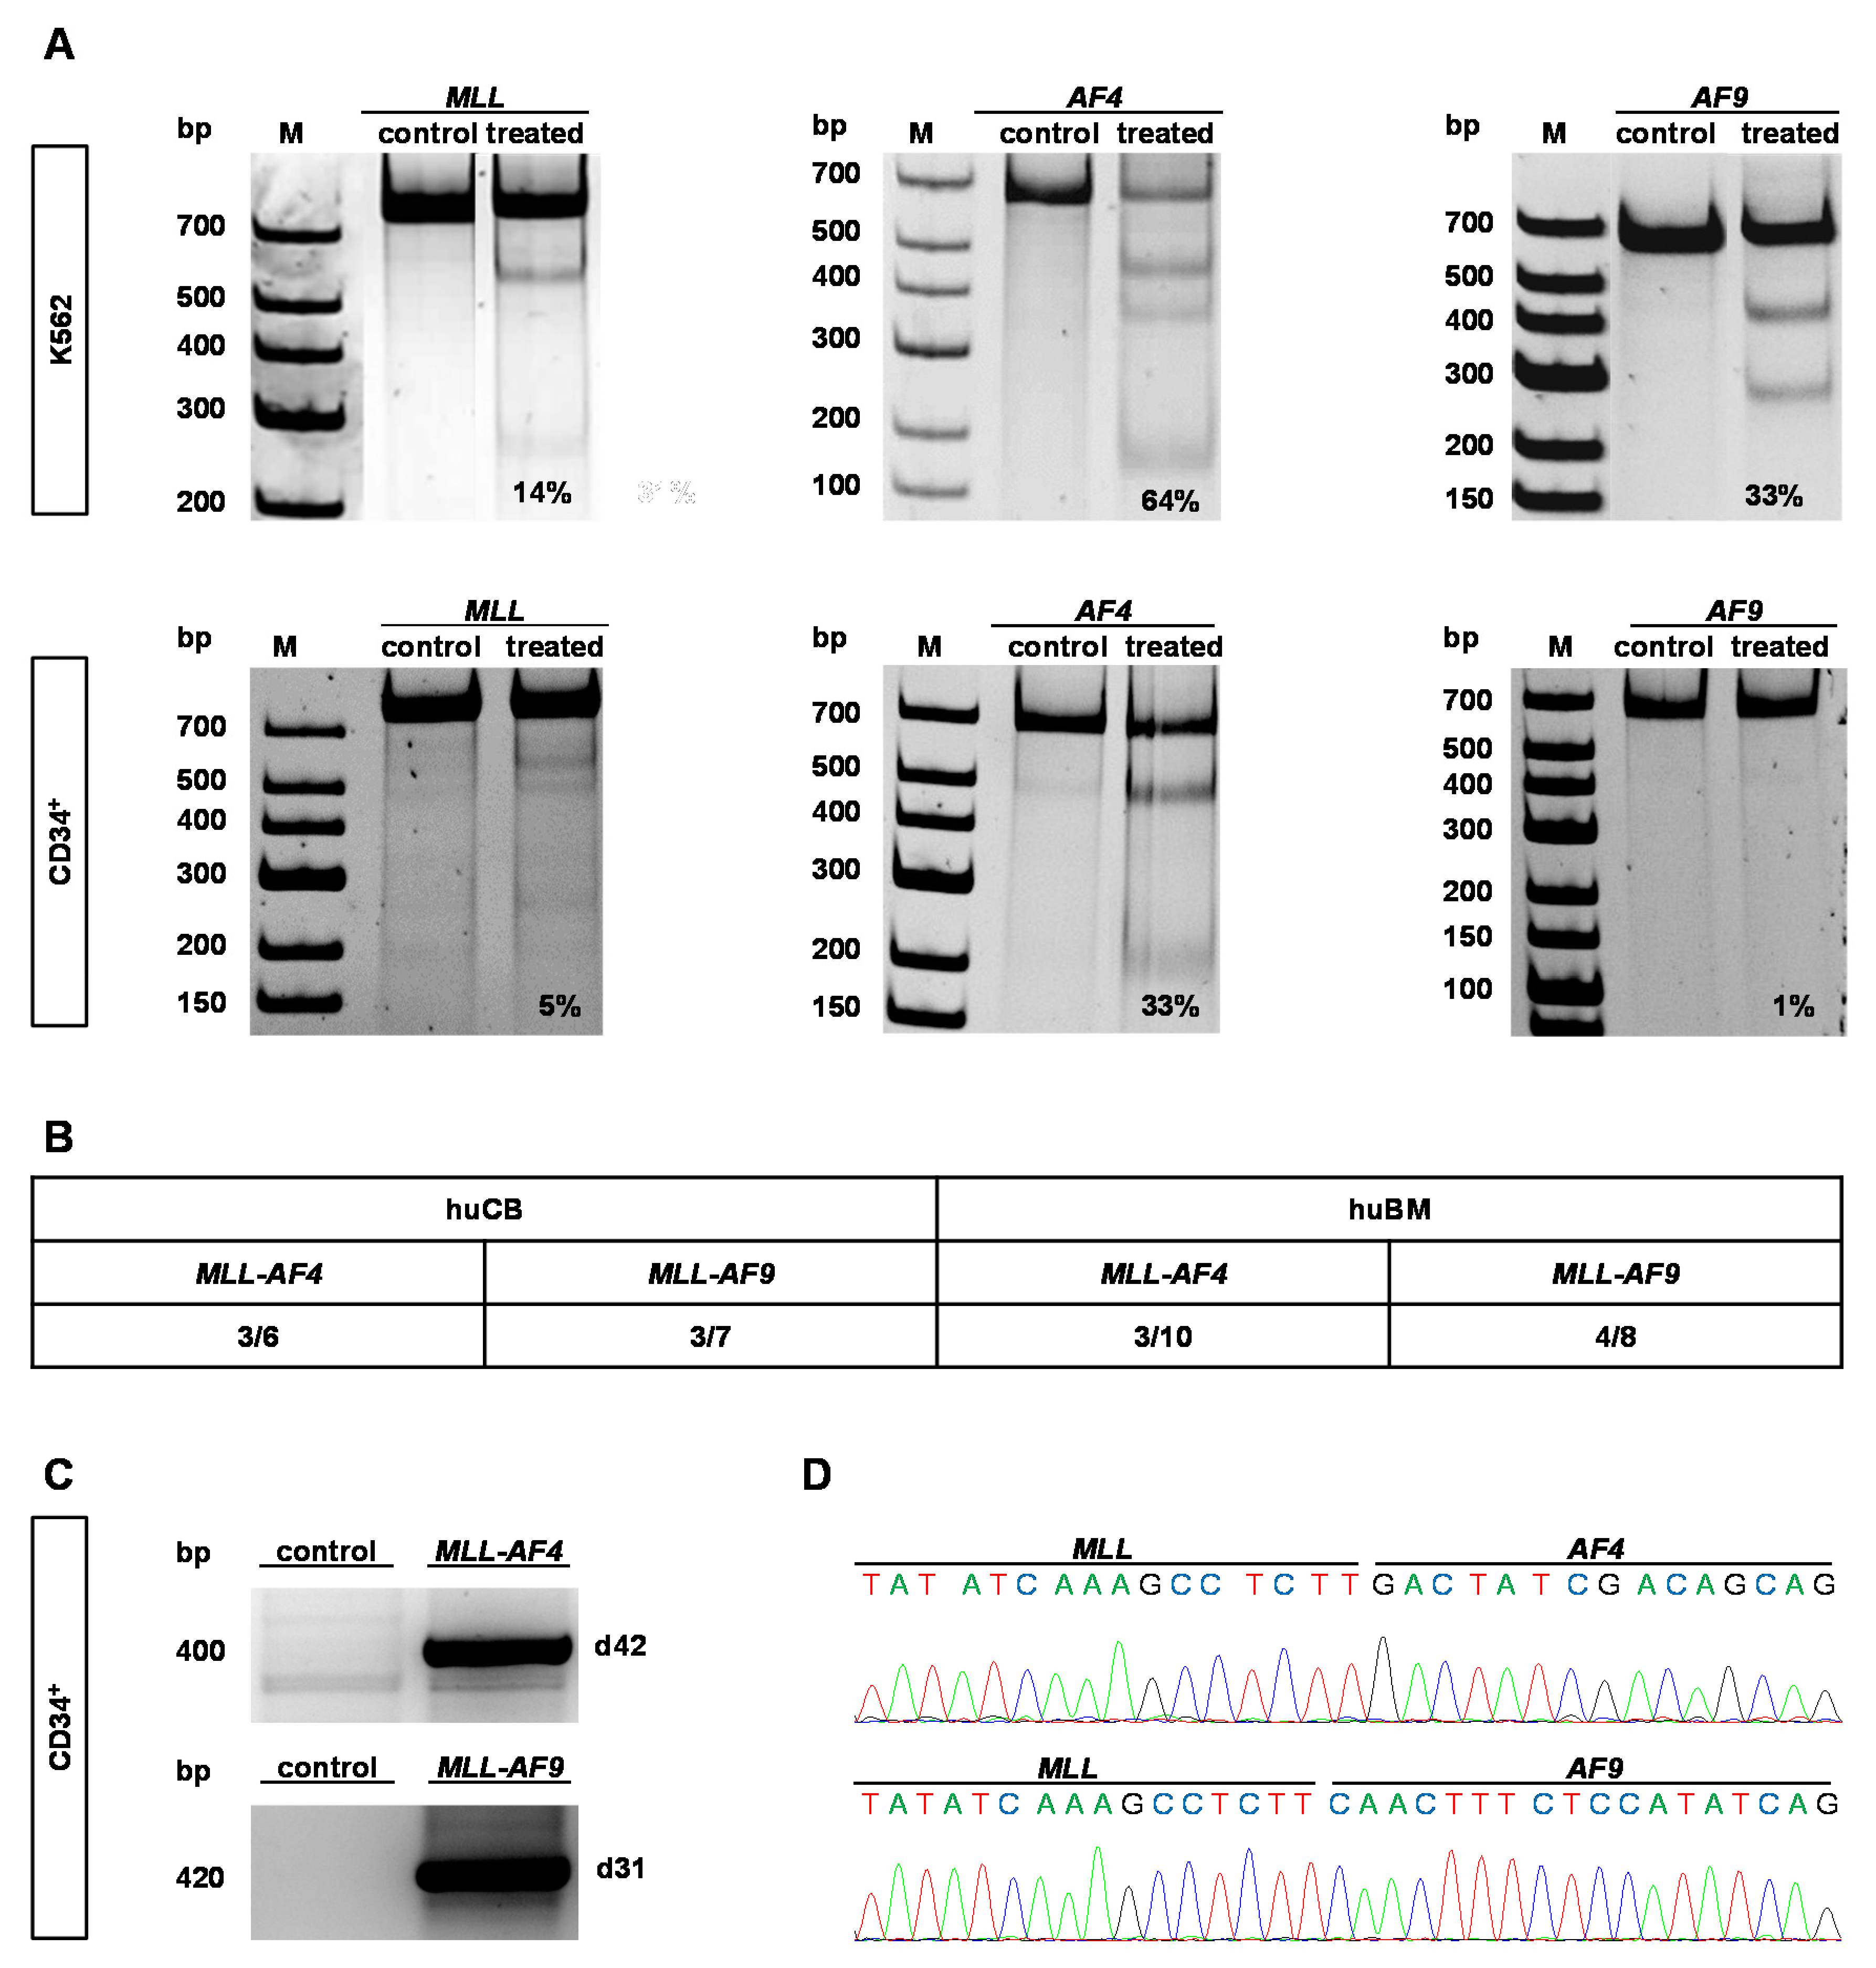
2.1. CRISPR/Cas9 Demonstrates High Cutting Efficiencies and Induces t(9;11) and t(4;11) Chromosomal Translocations in Human HSPCs Derived from huBM

Previously, we were able to introduce MLL-AF4 and -AF9 chromosomal translocations based on patient sequences in HSPCs (CD34+) derived from huCB in high frequency [1,14]. To translate our results in an adult system, we used HSPCs derived from huBM in comparison to huCB to evaluate whether the cell of origin and/or the fusion partner influence leukemia initiation. By nucleofecting plasmid- and virus-free single guide (sg) RNAs for the genes MLL, AF4 or AF9 with Cas9 protein in K562 cell line as proof-of-principle and in HSPCs derived from huBM, respectively, we demonstrated successful cutting efficiencies in both cell types (Figure 1A). To induce t(9;11) and t(4;11) translocations in adult HSPCs, we isolated CD34+ cells and nucleofected them using Cas9 protein and sgRNAs targeting MLL and AF4 or AF9, respectively. Cas9 alone was used as control. Following nucleofection, the cells were maintained in liquid culture supplemented with cytokines and chemokines optimized for growth of KMT2Ar cells [15]. PCR analyses of genomic DNA revealed signals of MLL-AF4 translocations in three out of 10 and MLL-AF9 translocations in four out of eight performed experiments with different donors, demonstrating an easy translation of our previously used CRSIPR/Cas9-system to adult cells (Figure 1B). Sanger sequencing revealed specific fusion sequences comparable to our huCB approach (Figure 1C,D) [14]. These results demonstrate that we were able to induce MLL translocations with high frequency in HSPCs derived from huBM by using genome engineering.

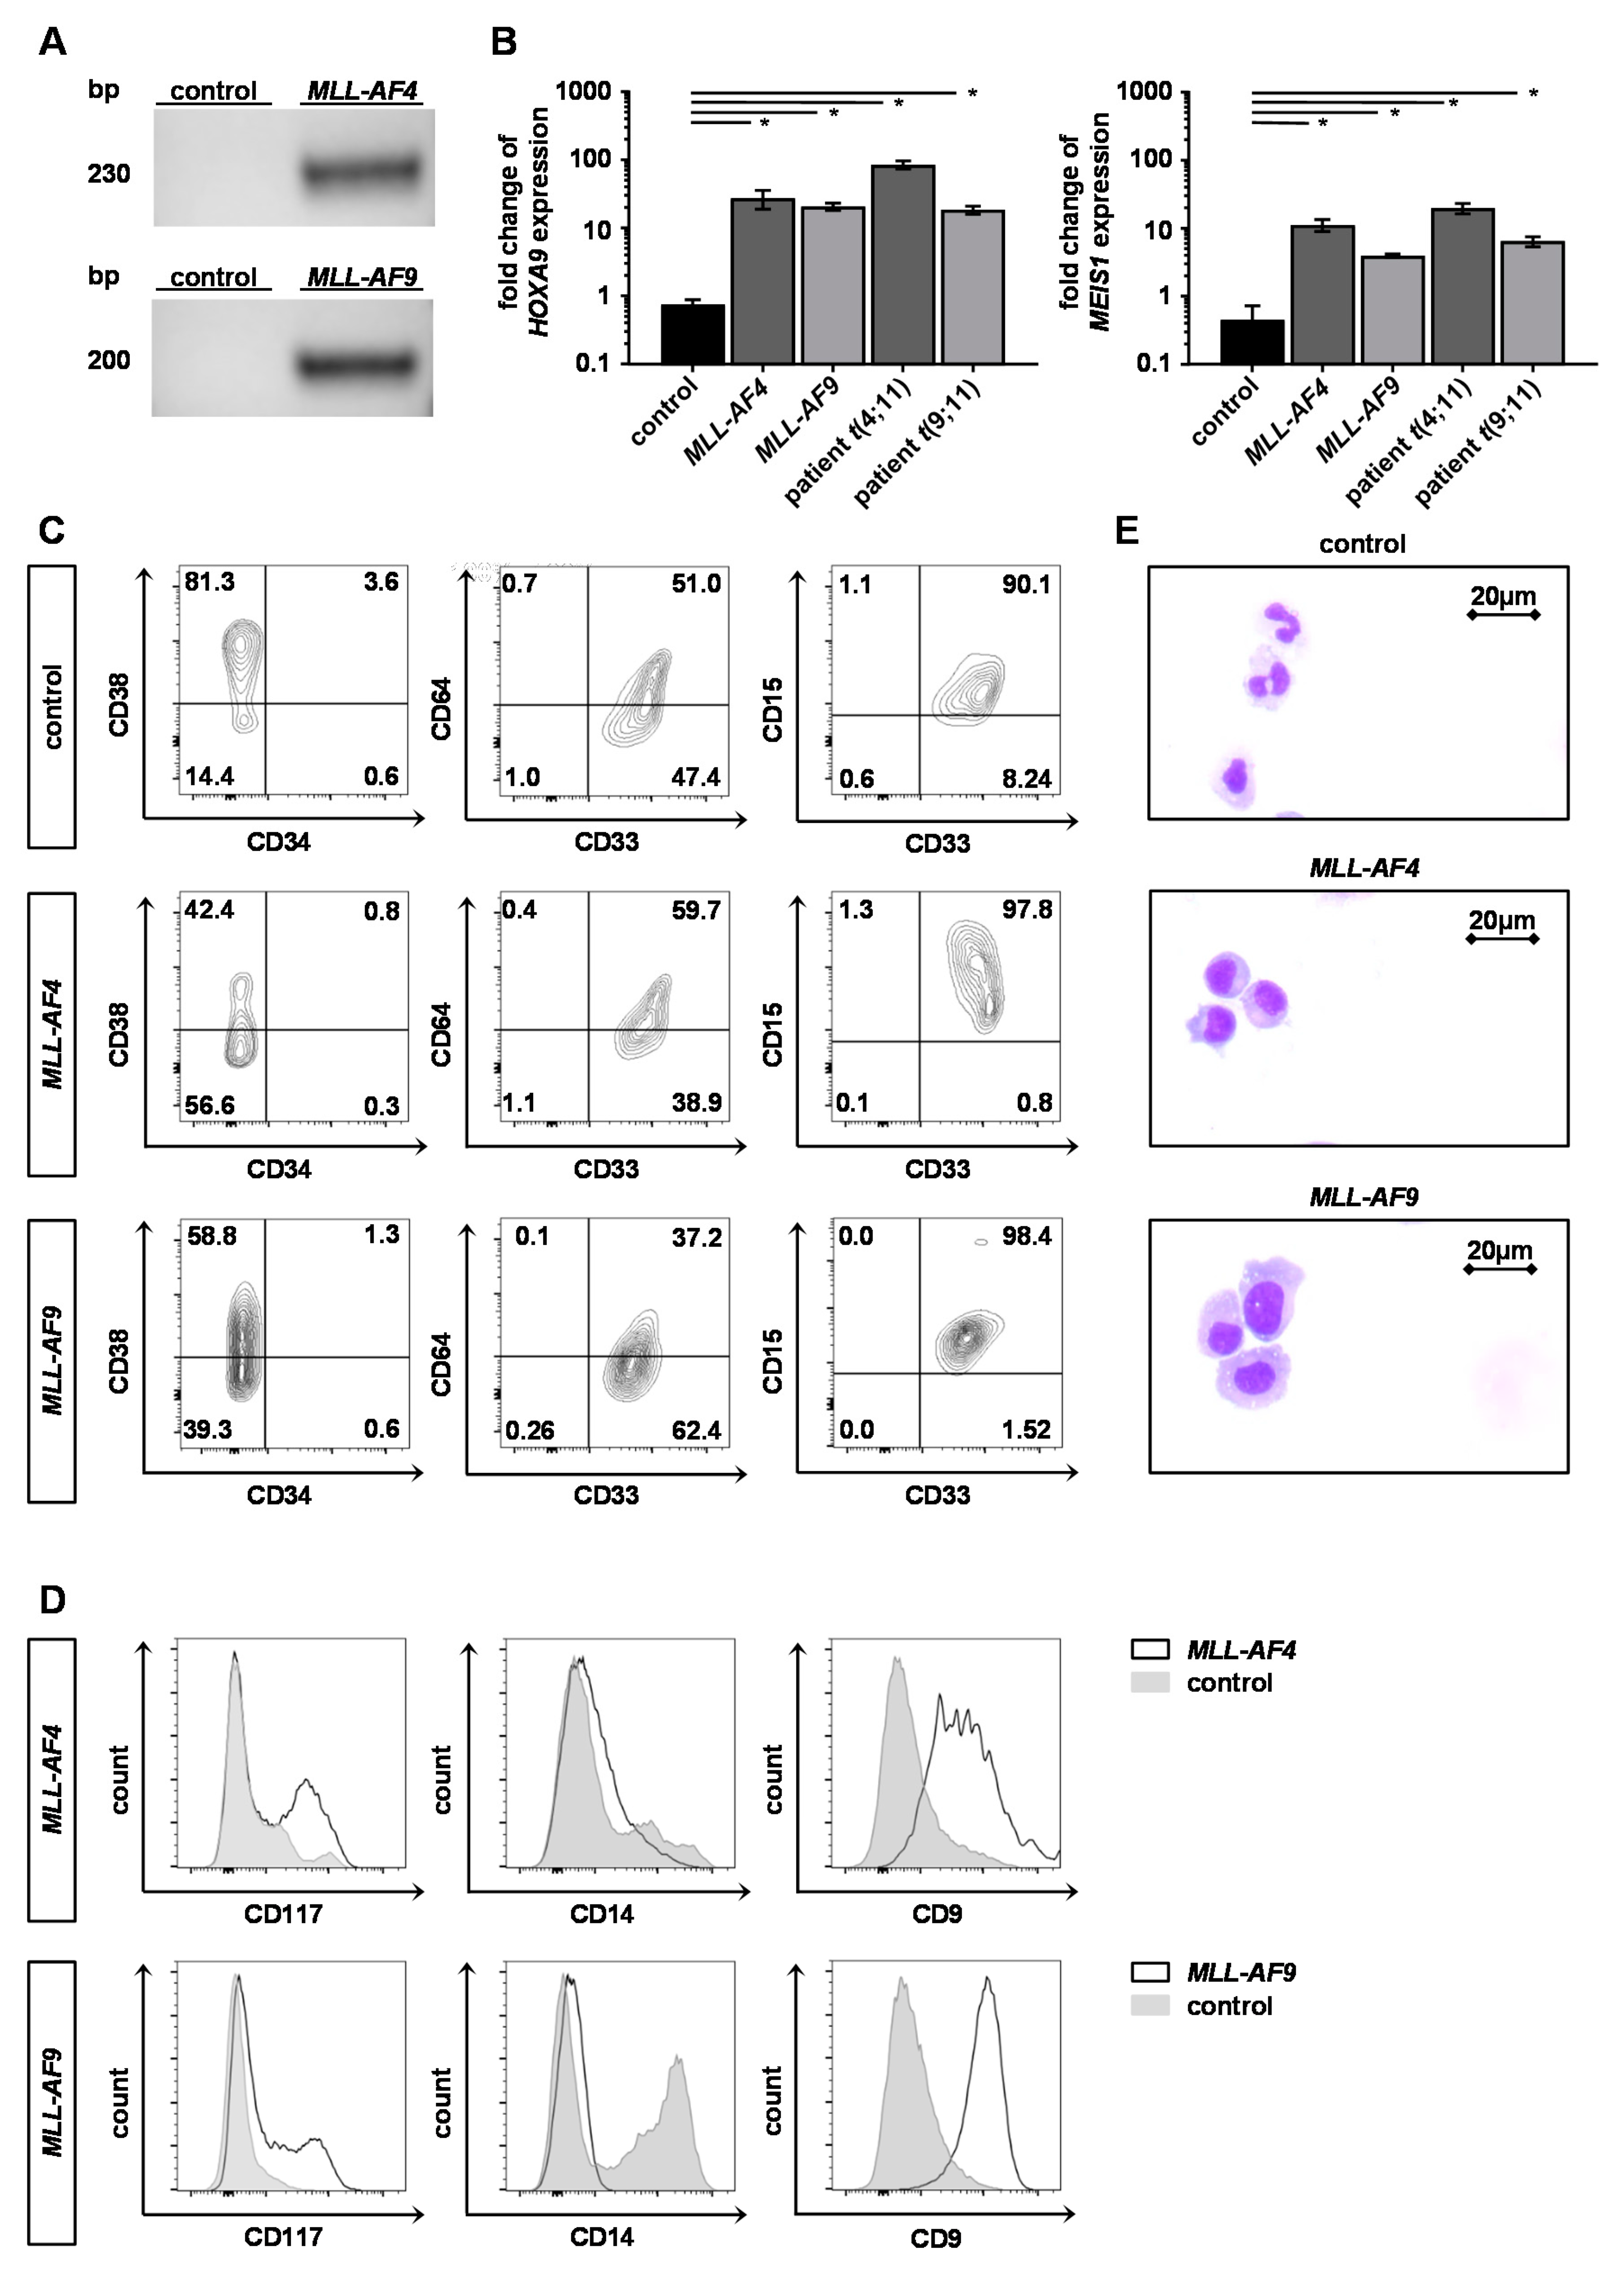
2.2. Engineered Adult KMT2Ar Cells Are Characterized by KMT2Ar-Typical Gene Expression, Phenotype and Morphology

To characterize the engineered KMT2Ar huBM cells, we performed RT-PCR to determine the functional expression on RNA level revealing both MLL-AF4 and -AF9 fusion transcripts (Figure 2A). Furthermore, we assessed the expression of common KMT2Ar-specific target genes like MEIS1 and HOXA9 in KMT2Ar huBM cells that were comparably high to the respective expression levels of patient-derived KMT2Ar cells (Figure 2B).
Blast cells from KMT2Ar leukemia patients typically display a myelomonocytic phenotype and no expression of CD34 in contrast to the most non-KMT2Ar leukemia patients [16,17]. Likewise, the genome-engineered KMT2Ar huBM cells in our model expressed myelomonocytic markers like CD64, CD33 and CD15 and lacked CD34 expression on their surface (Figure 2C). Interestingly, despite prolonged culture time of several weeks the KMT2Ar huBM cells expressed almost no CD14 as marker of differentiation, but CD117 as marker of immaturity, whereas control cells differentiated upon time in culture (Figure 2D). Importantly, as further validation of our adult KMT2Ar model, the genome engineered KMT2Ar huBM cells expressed CD9 as typical KMT2Ar leukemic surface marker (Figure 2D) [15,16].
To further characterize the KMT2Ar huBM cells, we performed cytospins followed by May–Gruenwald–Giemsa staining that revealed an immature morphology of the KMT2Ar huBM cells while the control cells presented a macrophage-like morphology and karyopyknosis indicating ongoing apoptosis (Figure 2E). These results demonstrate that using CRISPR/Cas9 to induce MLL translocations in HSPCs derived from huBM leads to expression of the fusion transcript, upregulation of KMT2Ar-specific target genes, a myelomonocytic phenotype and immature morphology hereby authentically mimicking KMT2Ar leukemia; therefore, this model can be used as a reliable patient-derived in vitro model.

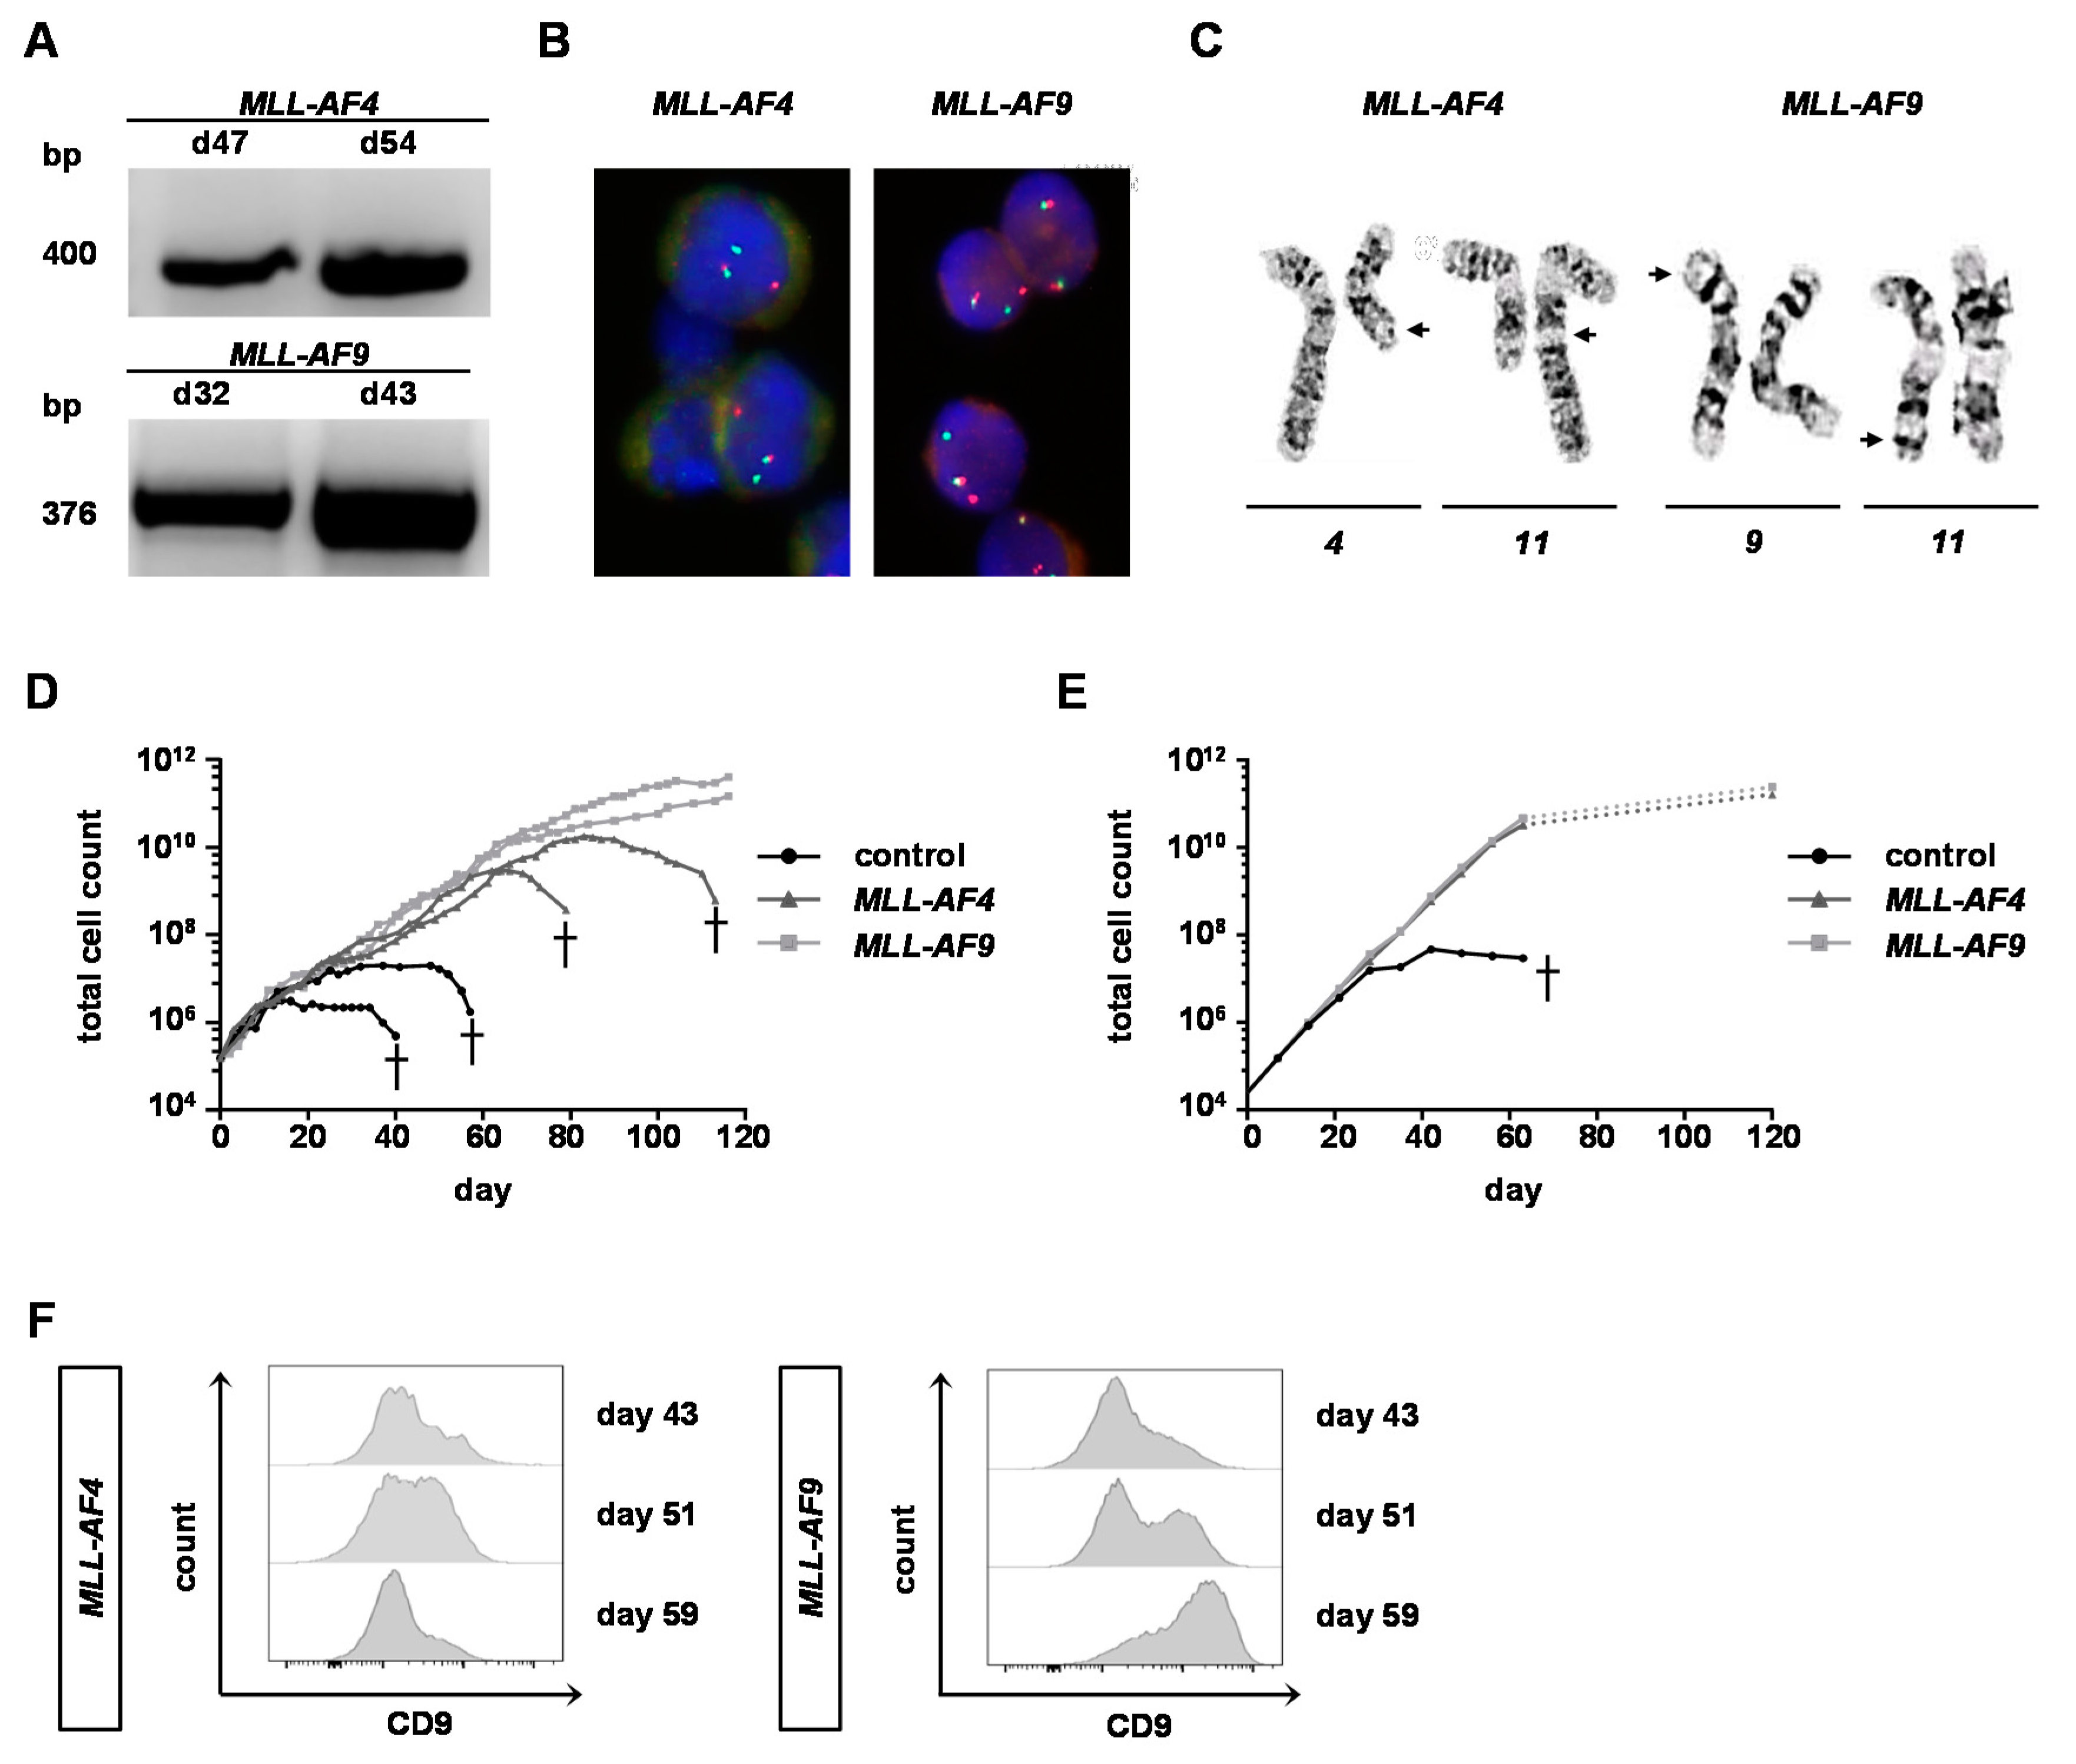
2.3. MLL-AF9 Can Immortalize Neonatal and Adult Cells, Whereas MLL-AF4 Only Immortalizes Neonatal Cells

Following nucleofection with the respective sgRNAs targeting MLL and AF4/AF9 and Cas9 protein, the huBM cells were kept in culture and monitored over time by PCR to detect the fusion gene. Both MLL-AF4 and -AF9 PCR products were detected with increasing signal intensity over time (Figure 3A). To quantify the percentage of cells with translocations, fluorescence in situ hybridization (FISH) and G-banding analyses were performed. On day 45 (MLL-AF4) and day 52 (MLL-AF9) of liquid culture, an MLL break-apart probe detected MLL translocations in 100% of huBM cells and G-banding analysis demonstrated the presence of both derivative chromosomes resulting in reciprocal t(4;11) and t(9;11) translocations (Figure 3B,C). Importantly, MLL-AF9 translocations led to unlimited in vitro growth of both the genome engineered huBM and huCB cells (Figure 3D,E). However, MLL-AF4 only immortalized huCB cells, whereas MLL-AF4 huBM cells ceased proliferation around 60–90 days and finally underwent apoptosis in all performed experiments despite a stable MLL-AF4 fusion expression (Figure 3A,D). Interestingly, some days in advance, the MLL-AF4 huBM cells already downregulated CD9 expression on their surface indicating the incomplete transformation of the cells, whereas MLL-AF9 cells demonstrated an increase of CD9 over time (Figure 3F). Collectively, these data indicate that MLL-AF9 can immortalize CD34+ cells of both neonatal as well as adult origin in vitro, whereas MLL-AF4 can solely immortalize cells of neonatal origin comparable to KMT2Ar patient leukemia, as the portion of MLL-AF4 leukemia in adults is very rare. These results indicate an important role of the cell of origin dependent on the expression of the respective fusion transcript for leukemia development.

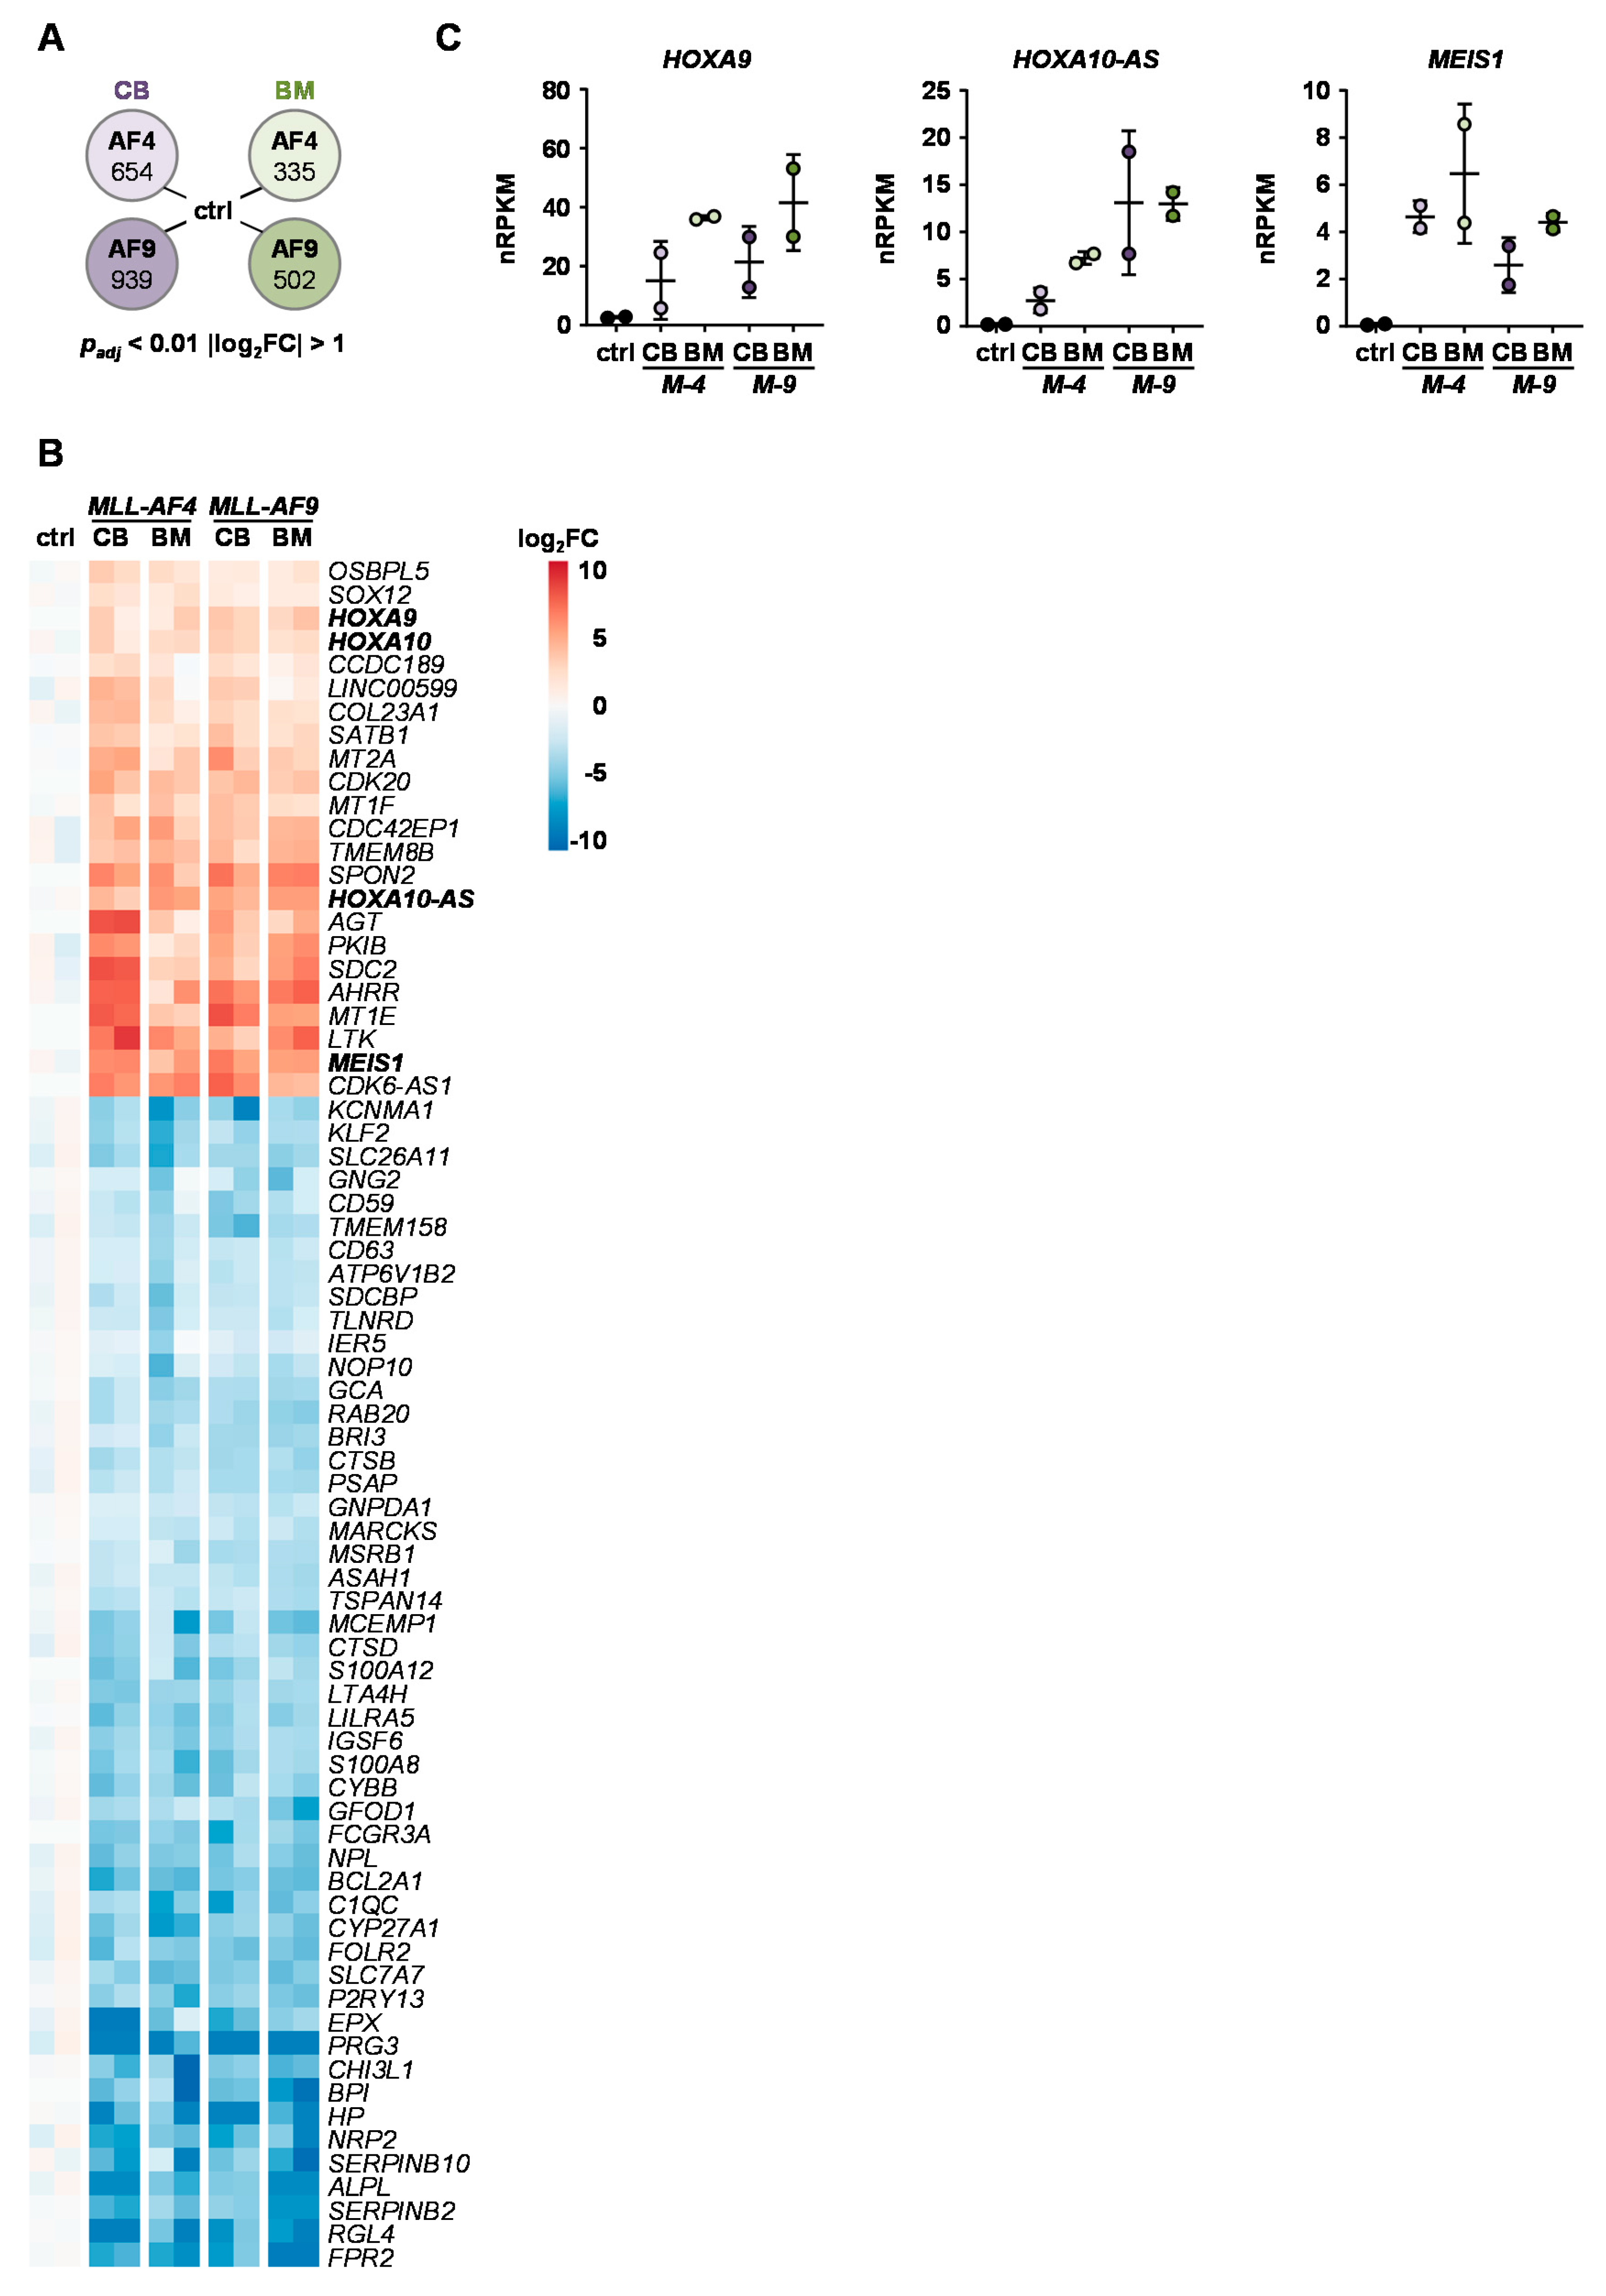
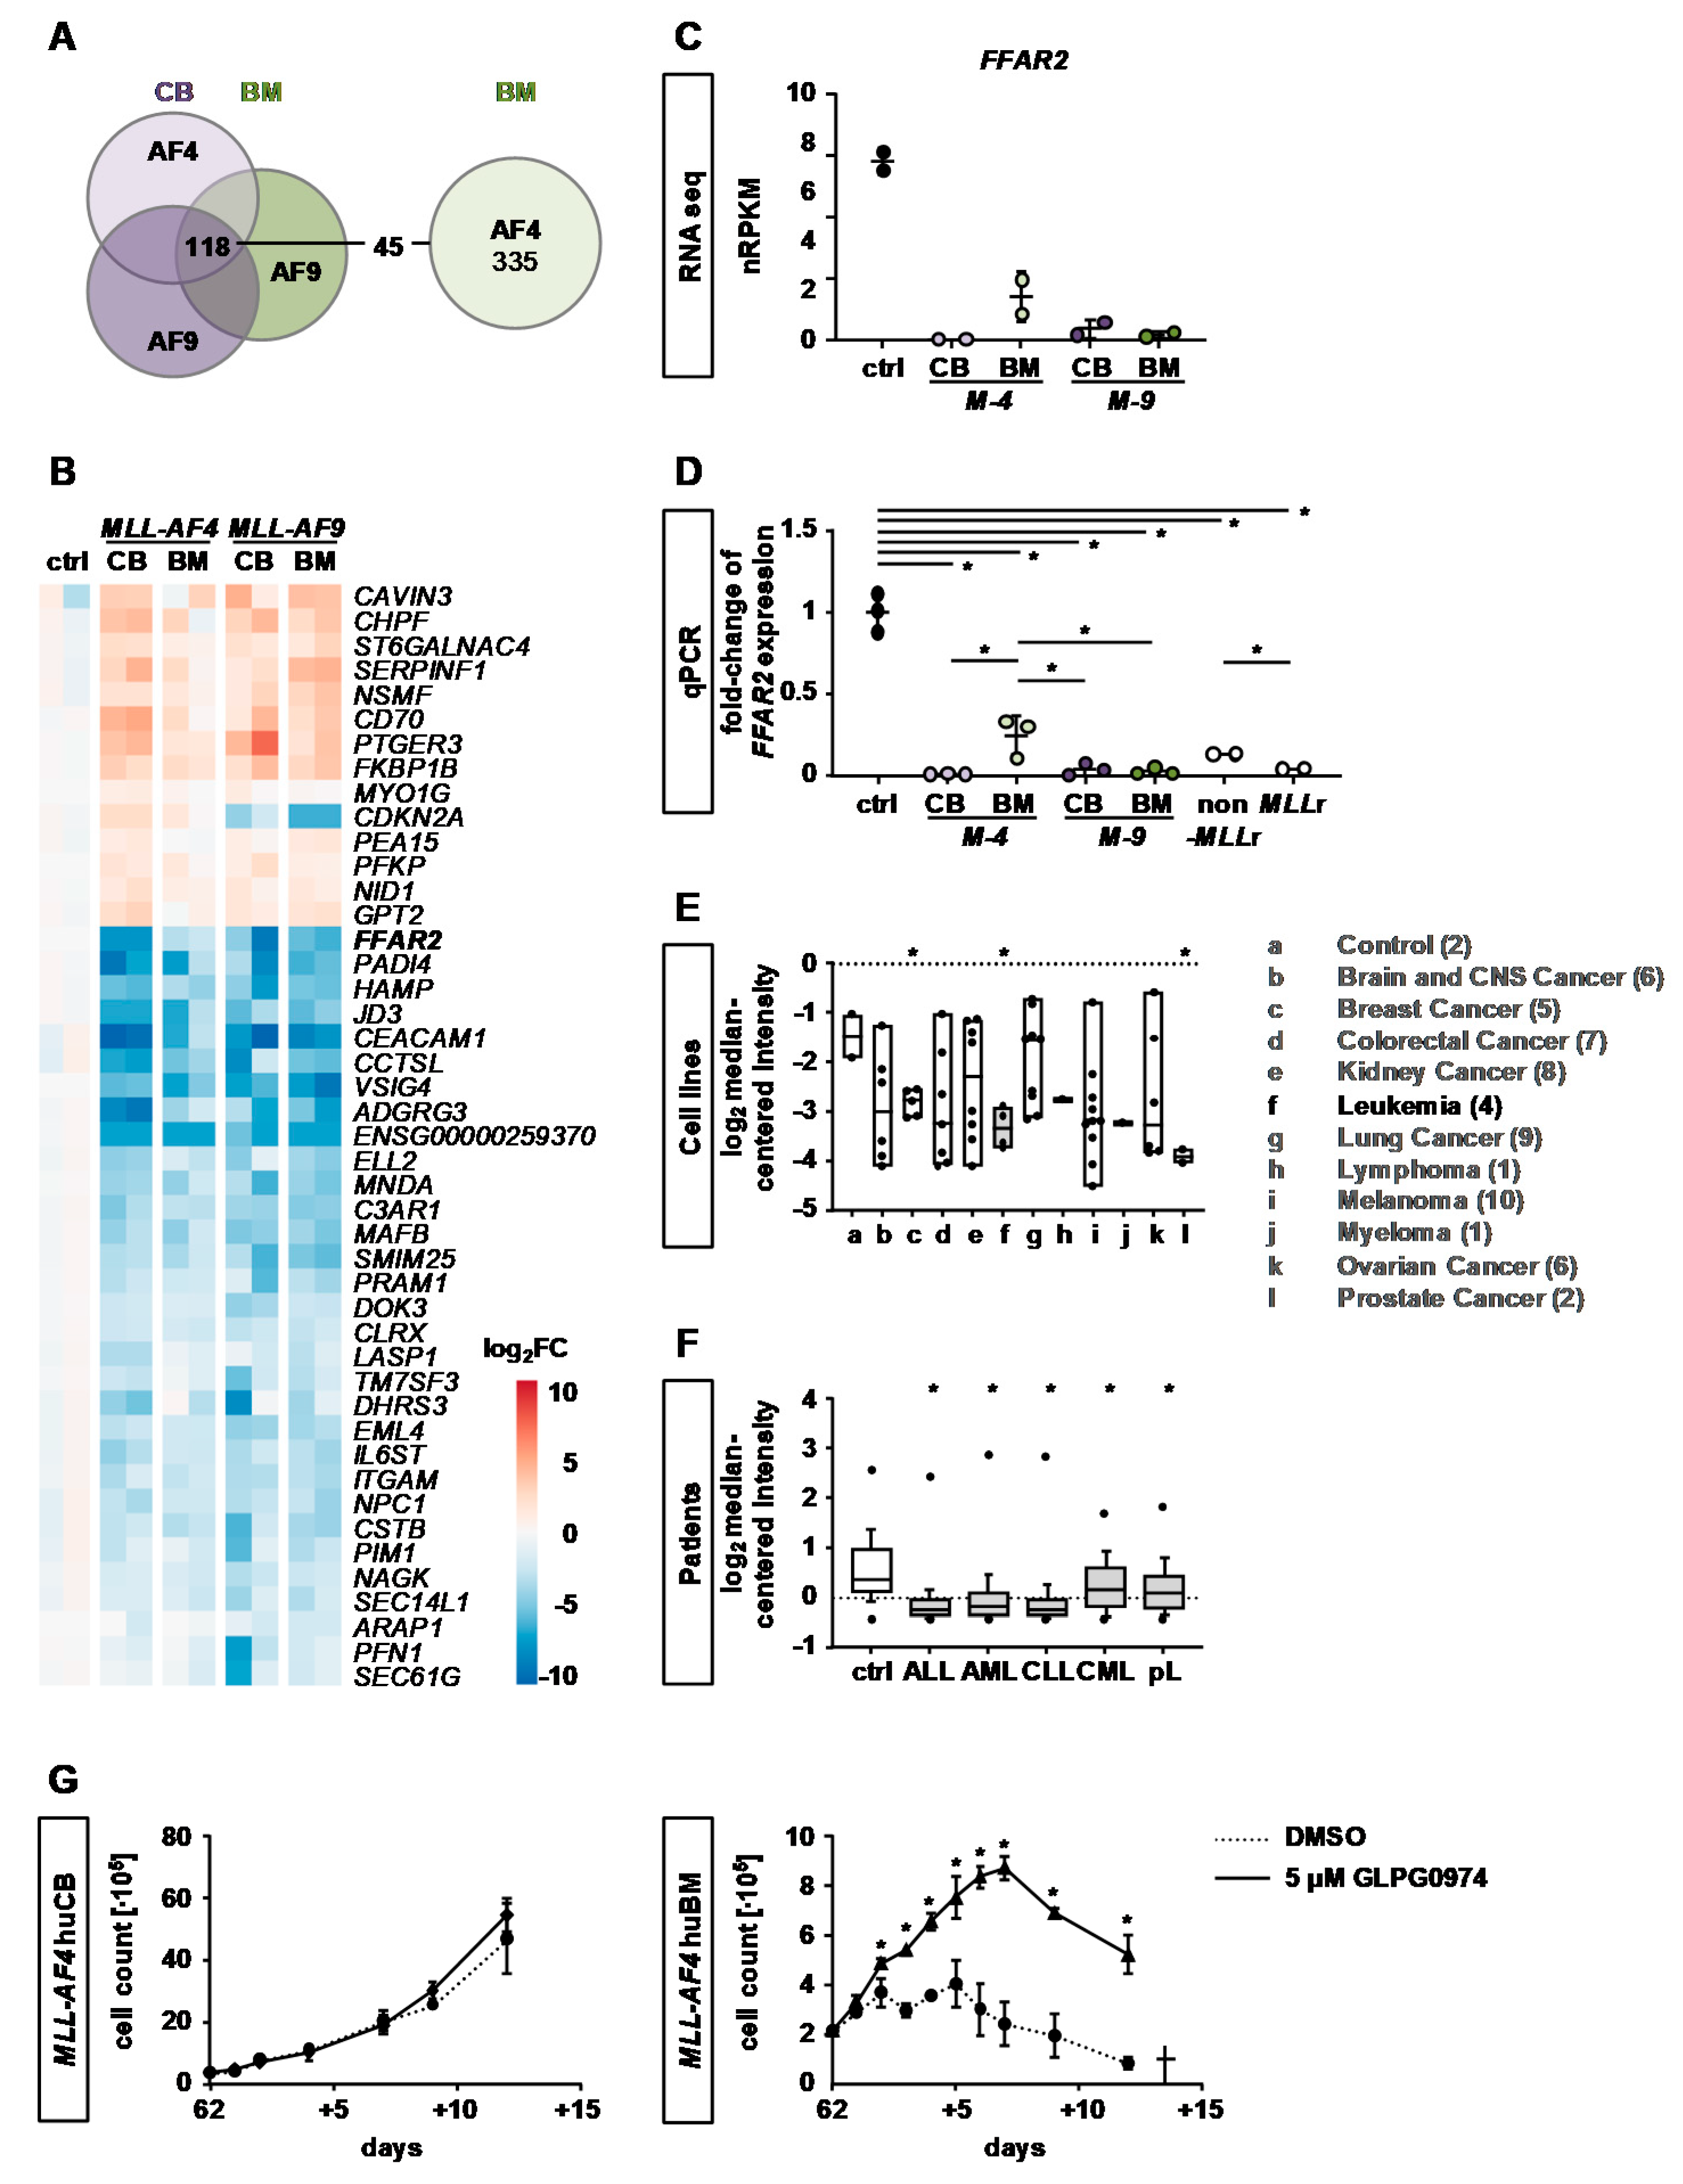
2.4. Identification of Common KMT2Ar Target Genes and Uncovering of FFAR2 as Possible Intrinsic Factor Responsible for Cell Transformation

We performed RNA sequencing (RNA-seq) of the MLL-AF4/-AF9 huCB and huBM cells and control cells to shed light on the transformation potential of MLL-AF4 and -AF9 translocations in the different cell types. Genes changed specifically in adult huBM cells upon MLL-AF4 expression. This may provide insight into the mechanisms responsible for the observed phenomenon that solely huCB cells but not huBM cells were immortalized by the expression of the MLL-AF4 fusion transcript. We identified 335 and 502 differentially expressed genes (DEGs) in huBM cells upon MLL-AF4 and MLL-AF9 expression, respectively. Regarding huCB, we detected 654 DEGs upon MLL-AF4 and 939 DEGs upon MLL-AF9 expression, respectively (Figure 4A). Of these genes, 73 were concordantly changed in all groups following MLL translocation and therefore represent a common KMT2Ar gene signature that was irrespective of tissue source (Figure 4B). Interestingly, this signature comprised the upregulation of classical KMT2Ar target genes like HOXA9, 10, 10-AS and MEIS1 (Figure 4C). These data confirm that both our CRISPR/Cas9-KMT2Ar models are physiologically relevant and that the inability of MLL-AF4 to immortalize adult cells is not explained by absence of KMT2Ar-induced expression of these common target genes.
To gain more insight into the hampered transformation potential driven by MLL-AF4 in huBM cells, we compared the expression profile from MLL-AF4 huBM cells against all others and revealed 45 differentially expressed genes (Figure 5A). Strikingly, within these 45 genes, we uncovered FFAR2, also known as GPR43 or FFA2, as the most downregulated in all other KMT2Ar cells although it was less in MLL-AF4 huBM cells indicating a possible important role in the KMT2Ar transformation potential (Figure 5B,C). To further confirm the RNA-seq results, we performed qPCR with the samples submitted to RNA-seq and further CRISPR/Cas9-KMT2Ar cells, KMT2Ar patient (UPN1) and non-KMT2Ar patient (UPN2) samples and revealed in all cases a significant downregulation of FFAR2 in contrast to healthy controls but again a specifically less downregulation in MLL-AF4 rearranged cells (Figure 5D). To elucidate the impact of FFAR2 in cancer in general, we mined the literature and compared the expression level in different cancer entities. Strikingly, we discovered the lowest levels of FFAR2 expression in breast cancer, prostate cancer and hematological diseases especially in leukemia (Figure 5E) [18]. This could be further confirmed by analyzing leukemia patient data of different entities, again showing very low levels of FFAR2 in contrast to healthy controls (Figure 5F) [19]. Notably, after 62 days of cell culture, treatment with the FFAR2 antagonist GLPG0974 resulted in increased proliferation of MLL-AF4 huBM cells whereas MLL-AF4 huCB cells were not affected (Figure 5G) demonstrating the mechanistic role of FFAR2 in transforming MLL-AF4 huBM cells [20].
Taken together, our data show that our CRISPR/Cas9-KMT2Ar models are authentic by demonstrating common KMT2Ar target gene expression that is not responsible for the immortalization. Moreover, we uncovered downregulation of FFAR2 as a potential key player in the KMT2Ar leukemogenesis.

3. Discussion

In this study we used CRISPR/Cas9 to generate t(9;11) and t(4;11) chromosomal translocations in primary human HSPCs derived from both huCB and huBM to unravel the differences on KMT2Ar leukemia based on the fusion partner and the cell of origin, in which leukemia initiation occurs. Our models are based on patient-specific sequences and share not only genetical but also morphological, phenotypical and transcriptomic attributes of KMT2Ar leukemias and hereby closely parallel the nature of the disease. Previously, we could demonstrate that by using CRISPR/Cas9 in huCB the creation of an authentic infant KMT2Ar model based on endogenous oncogene activation was possible to unravel the pathogenesis of KMT2Ar leukemogenesis in vitro [14]. In this study, we successfully transferred our genetic tool to HSPCs derived from huBM and could again demonstrate the feasibility to generate both MLL-AF4 and MLL-AF9 translocations with high efficiency in an adult system. To our knowledge, this is the first demonstration that both the induction of MLL translocation and the outgrowth of pure KMT2Ar cells in HSPCs derived from huBM is feasible. Interestingly, all generated cells except for MLL-AF4 huBM cells showed unlimited growth potential in in vitro cultures. Although MLL-AF4 huBM cells were similarly able to reach purity within 60 days and expressed KMT2Ar target genes as a hallmark of KMT2Ar leukemia, they succumbed to apoptosis in all performed experiments within around 80 days under myeloid culture conditions. This situation closely parallels human KMT2Ar patients, as the portion of MLL-AF4 myeloid leukemias in adults is negligible, whereas MLL-AF4 leukemia is the most occurring lymphoid leukemia in infants [1]. One could argue that MLL-AF4 cells become preleukemic in adults but full transformation to myeloid leukemia is not possible due to the cell of origin. Strikingly, prior to apoptosis our genome-engineered MLL-AF4 huBM cells lost their CD9 surface expression as typical KMT2Ar marker in in vitro cultures [16]. This indicates that CD9 loss is a potential early marker for detection of upcoming cell death upon targeted therapy. Further studies in KMT2Ar patients during anti-cancer treatment are necessary to confirm this phenomenon. Our RNA-seq data of the CRISPR/Cas9-KMT2Ar cells derived from huCB and huBM revealed a common KMT2Ar signature including the overexpression of known common target genes like MEIS1 and HOXA9 that was irrespective of the fusion partner or cell of origin. This confirmed that our genome-engineered models based on patient sequences are authentic and that the observed differences are independent from the KMT2Ar-typical target gene expression. Moreover, we could identify FFAR2 as the most downregulated DEG in MLL-AF9 huCB and huBM as well as MLL-AF4 huCB cells. In contrast, MLL-AF4 huBM cells failed to efficiently downregulate this gene indicating a major role for disease development. In addition, the fact that the FFAR2 antagonist GLPG0974 specifically favored the proliferation of MLL-AF4 huBM cells underpins the essential role of FFAR2 in KMT2Ar leukemogenesis [20]. Until now, the impact of FFAR2 is only poorly understood in leukemia. It has been demonstrated that downregulation of FFAR2 is necessary for leukemia survival in vitro and in vivo [21]. By re-analyzing publicly available datasets, we were able to assign FFAR2 an important role in leukemia by demonstrating a significant downregulation in leukemic patients in contrast to different other tumor entities and healthy controls [18,19]. We could confirm this observation by performing qPCRs with our CRISPR/Cas9-KMT2Ar models and patient samples. Interestingly, in colon cancer FFAR2 acts as an epigenetic tumor suppressor since loss of FFAR2 leads to high-level of H3K4me3 promoting colon carcinogenesis [22]. Importantly, leukemic stem cells (LSC) in KMT2Ar leukemia display high levels of H3K4me3 and low levels of H3K79me2 thereby playing a crucial role in determining LSC fate [23]. Recently, a FFAR2 agonist with favorable pharmacokinetic properties has been developed allowing the targeting of FFAR2 as a new therapeutic strategy in KMT2Ar leukemia [20].
In summary, our study highlights the feasibility of engineering chromosomal translocations at their endogenous loci in primary human HSPCs derived from both huCB and huBM to generate pure KMT2Ar cells in a short period of time serving as innovative and authentic human leukemia model. Further, we provide robust data that MLL-AF4 was unable to transform HSPCs derived from huBM cells under myeloid conditions indicating an important role of the fusion partner and the cell of origin. Downregulation of FFAR2 seems to be mandatory for leukemia development and therefore could serve as therapeutic target in the treatment of poor prognosis KMT2Ar leukemia.

4. Materials and Methods

4.1. Human CRISPR/Cas9-KMT2Ar Model and Patient Samples

CD34+ HSPCs were isolated (human CD34 MicroBead Kit UltraPure, Miltenyi, Bergisch Gladbach, Germany) either from fresh huCB obtained from the Department of Gynecology (IRB approval 751/2015BO2) or from huBM obtained from the Department of Hematology and Oncology of the University Hospital Tuebingen (IRB approval 309/2018BO2) and maintained in culture as previously described [14]. CRISPR/Cas9 was used to target patient-specific MLL-AF4 and -AF9 breakpoints for KMT2Ar model induction and T7 endonuclease I assay (NEB, Ipswich, MA, USA) was performed to evaluate cutting efficiencies [14]. Rearrangements were identified via PCR (AccuPrime Pfx DNA Polymerase, Thermo Fisher Scientific, Waltham, MA, USA), reverse transcriptase (RT)-PCR, Fluorescence in situ hybridization (FISH, Cytocell MLL (KMT2A) Breakapart Probe, Cambridge, UK), karyotyping and Sanger sequencing (Seqlab, Goettingen, Germany) as previously described [14]. For compound treatment the FFAR2 antagonist GLPG0974 (Tocris, Bristol, UK) was prepared in a stock solution with DMSO [24,25,26,27]. After 62 days of culture KMT2Ar huCB and huBM cells were subjected to treatment as indicated. Cells were retreated and reseeded at original density every second day. Cell counts were determined by staining with Trypan blue (Gibco, Thermo Fisher Scientific) using the Neubauer counting chamber.
Patient samples (UPN1, non-KMT2Ar and UPN2, KMT2Ar) were isolated from fresh peripheral blood obtained from the Department of Hematology and Oncology (IRB approval 137/2017BO2), frozen in RPMI 1640 medium supplemented with 20% filtered fetal bovine serum (FBS) (Merck-Millipore, Darmstadt, Germany) and 10% DMSO and thawed on demand.

4.2. Quantitative PCR (qPCR)

Total RNA was isolated (NucleoSpin RNA Kit, Macherey Nagel, Dueren, Germany), cDNA was generated (Thermo Fisher Scientific) and qPCR was performed for detection of MEIS1, HOXA9 and FFAR2 using 18S rRNA as housekeeper and employing the ddCT method as previously described [14]. The results were normalized on 18S rRNA and respective control cells were used as calibrator. Primers for FFAR2 detection were: huFFAR2 FOR 5′CCCTCACGAGTTTTGGCTTC and huFFAR2 REV 5′GGAGCCACGTGCTGCAGTA.

4.3. May–Gruenwald–Giemsa Cytospin Staining

Cytospins were performed as previously described [14]. Images were collected using a Zeiss Primovert microscope with an ×40 objective and the Axiocam 105 color camera using ZEN 3.0 blue edition software (all Carl Zeiss AG, Oberkochen, Germany) at a resolution of 2560 × 1920 pixels.

4.4. Flow Cytometry

Analyses were performed using an LSR II flow cytometer (BD Biosciences, San Jose, CA, USA) and FACS DIVA software (BD Biosciences). For analyses, the following fluorochrome-conjugated monoclonal antibodies were used: CD34-APC (clone 4H11, eBioscience, San Diego, CA, USA), CD38-PE/Cy7 (clone HIT2, eBioscience), CD64-APC/Cy7 (clone 10.1, BioLegend, San Diego, CA, USA), CD33-BV421 (clone WM53, BioLegend), CD15-BV605 (clone W6D3, BioLegend, San Diego, CA, USA), CD117-BV711 (clone 104D2, BioLegend), CD14-Alexa Fluor 700 (clone HCD14, BioLegend) and CD9-PE (clone eBioSN4/SN4 C3-3A2, eBioscience). The analyses were pre-gated on single cells using forward scatter height (FSC-H) vs. forward scatter area (FSC-A) and subsequently on living cells by staining with Fixable Viability Dye eFluor 506 (eBioscience). Data were analyzed using FlowJo (TreeStar, V10, Ashland, OR, USA).

4.5. Cell Proliferation Analysis

Increasing amount of translocation positive cells was identified on DNA level via semi-quantitative PCR (AccuPrime Pfx DNA Polymerase, Thermo Fisher Scientific) of 100 ng genomic DNA with primers as previously described [14]. Proliferation of polyclonal cultures was determined by staining with Trypan blue (Thermo Fisher Scientific) and total cell count was calculated over a period of 120 days. Cell viability was determined by flow cytometry using Fixable Viability Dye eFluor 506 (eBioscience).

4.6. RNA Sequencing and Gene Expression Analyses

RNA was isolated (NucleoSpin RNA Kit, Macherey Nagel) and quality assessment was carried out by NanoDrop (Thermo Fisher Scientific) and Bioanalyzer measurements (Agilent, Santa Clara, CA, USA).
Sequencing of the Quantseq 3′ mRNA libraries was performed on a NextSeq 500 platform (Illumina Inc., San Diego, CA, USA) at a resolution of ~6–11 mio single end reads per sample and 101 bp in length. Reads were trimmed and cleaned up from contaminating adapters, polyA read through events, and low quality tails with BBDuk of the BBMap [28] tools suite (v38.67) using the following parameters: (k=13 ktrim=r useshortkmers=t mink=5 qtrim=r trimq=10 minlength=20) as well as employing the polyA and truseq_rna k-mer resources. Quality of the cleaned fastq files was assessed using FastQC (v0.11.4) [29] before aligning reads with STAR (v2.7.0a) [30] against the Ensembl H. sapiens genome v95 using the following parameters: (--outFilterType BySJout --outFilterMultimapNmax 20 --alignSJoverhangMin 8 --alignSJDBoverhangMin 1 --outFilterMismatchNmax 999 --outFilterMismatchNoverLmax 0.6 --alignIntronMin 20 --outSAMattributes NH HI NM M). Read counts for all genes were obtained using the featureCounts function of Rsubread (v2.0.0) with (GTF.featureType=“exon” GTF.attrType=“gene_id” useMetaFeatures=TRUE strandSpecific=1) and DESeq2 (v1.26) [31]. Transcripts covered with <1 read were excluded from subsequent analyses leaving 21,978 genes for determining differential expression. Significance thresholds were set to |log2 FC| ≥ 1 and BH-adjusted p-value ≤ 0.01. Surrogate variable analysis (sva, v3.26.0) [32] was used to minimize unwanted variation between samples.

4.7. Statistical Analyses

To summarize pooled data of independent experiments the mean was calculated and standard deviation (SD) was used to describe the variability. Student’s t test was used for statistical analysis and p < 0.05 was considered statistically significant.

4.8. Data Sharing Statement

For original data, please contact [email protected]. Raw sequencing files and count data are available through Gene Expression Omnibus (GEO) under accession number GSE148714.

5. Conclusions

In this study, we used CRISPR/Cas9 to introduce translocations of the MLL (KMT2A) and AF4 or AF9 genes under physiologic promotors in both huCB and huBM cells. All genome-engineered cells faithfully mimic the genuine nature of the disease by sharing morphological, phenotypical and transcriptomic attributes of KMT2Ar leukemias therefore constituting an innovative and authentic human model of KMT2Ar leukemia. However, the oncogene MLL-AF4 only transformed cells derived from infant cells demonstrating a major role of the fusion partner and the cell of origin in leukemia development. Finally, we uncovered intrinsic properties like an absent downregulation of free fatty acid receptor 2 (FFAR2), an epigenetic regulator, possibly responsible for this phenomenon.

Author Contributions

K.-A.S., L.B. and C.S. designed and performed the research, analyzed data and wrote the manuscript. H.K., D.S., J.J., T.H., J.M.S.-H., B.M. and F.F. performed research and analyzed data. All authors edited the manuscript for content. Conceptualization, C.S.; Formal analysis, J.J., T.H. and J.M.S.-H.; Funding acquisition, C.S.; Investigation, K.-A.S., L.B., H.K., B.M., F.F. and D.S.; Methodology, K.-A.S., H.K., T.H. and J.M.S.-H.; Project administration, K.-A.S. and C.S.; Software, J.J., T.H., and J.M.S.-H.; Supervision, C.S.; Visualization, K.-A.S. and L.B.; Writing—original draft, K.-A.S., L.B. and C.S.; Writing—review and editing, H.K., J.J., T.H., J.M.S.-H., B.M., F.F. and D.S. All authors have read and agreed to the published version of the manuscript.

Funding

CS was supported by a Junior Research Group Grant of the Interdisciplinary Centre for Clinical Research (IZKF, 2383-0-0), the Wuerttembergischer Krebspreis and the Clinician Scientist Program of the Faculty of Medicine Tuebingen. D.S. was supported by a Max Eder Junior Research Group Grant from the German Cancer Aid and the Clinician Scientist Program of the Faculty of Medicine Tuebingen. J.M.S.-H. was supported by a Margarete-von-Wrangell fellowship through the Ministry of Science, Research and the Arts Baden-Wuerttemberg, a Junior Research Group Grant of the Interdisciplinary Centre for Clinical Research (IZKF, 2386-0-0) and, together with T.H., received funding from the decipherPD transnational consortium on Epigenomics of Complex Diseases (BMBF grant number 01KU1503).

Acknowledgments

We thank the Flow Cytometry Core Facility Berg of the University Hospital Tuebingen for their excellent technical support. Likewise, we would like to thank the Department of Obstetrics and Gynecology of the University Hospital Tuebingen for providing human cord blood, and the core facility c.ATG of the University Hospital Tuebingen for preparing the RNA-seq libraries and sequencing the samples.

Conflicts of Interest

J.J. is employed by Synthego Corporation and holds stock and other ownership interests. The remaining authors declare no competing financial interests.

References

  1. Meyer, C.; Burmeister, T.; Groger, D.; Tsaur, G.; Fechina, L.; Renneville, A.; Sutton, R.; Venn, N.C.; Emerenciano, M.; Pombo-de-Oliveira, M.S.; et al. The MLL recombinome of acute leukemias in 2017. Leukemia 2018, 32, 273–284. [Google Scholar] [CrossRef] [PubMed]
  2. Pui, C.H.; Gaynon, P.S.; Boyett, J.M.; Chessells, J.M.; Baruchel, A.; Kamps, W.; Silverman, L.B.; Biondi, A.; Harms, D.O.; Vilmer, E.; et al. Outcome of treatment in childhood acute lymphoblastic leukaemia with rearrangements of the 11q23 chromosomal region. Lancet 2002, 359, 1909–1915. [Google Scholar] [CrossRef]
  3. Eguchi, M.; Eguchi-Ishimae, M.; Greaves, M. The role of the MLL gene in infant leukemia. Int. J. Hematol. 2003, 78, 390–401. [Google Scholar] [CrossRef] [PubMed]
  4. Pui, C.H.; Frankel, L.S.; Carroll, A.J.; Raimondi, S.C.; Shuster, J.J.; Head, D.R.; Crist, W.M.; Land, V.J.; Pullen, D.J.; Steuber, C.P.; et al. Clinical characteristics and treatment outcome of childhood acute lymphoblastic leukemia with the t(4;11)(q21;q23): A collaborative study of 40 cases. Blood 1991, 77, 440–447. [Google Scholar] [CrossRef]
  5. Gardner, R.; Wu, D.; Cherian, S.; Fang, M.; Hanafi, L.A.; Finney, O.; Smithers, H.; Jensen, M.C.; Riddell, S.R.; Maloney, D.G.; et al. Acquisition of a CD19-negative myeloid phenotype allows immune escape of MLL-rearranged B-ALL from CD19 CAR-T-cell therapy. Blood 2016, 127, 2406–2410. [Google Scholar] [CrossRef] [Green Version]
  6. Super, H.J.; McCabe, N.R.; Thirman, M.J.; Larson, R.A.; Le Beau, M.M.; Pedersen-Bjergaard, J.; Philip, P.; Diaz, M.O.; Rowley, J.D. Rearrangements of the MLL gene in therapy-related acute myeloid leukemia in patients previously treated with agents targeting DNA-topoisomerase II. Blood 1993, 82, 3705–3711. [Google Scholar] [CrossRef] [Green Version]
  7. Andersson, A.K.; Ma, J.; Wang, J.; Chen, X.; Gedman, A.L.; Dang, J.; Nakitandwe, J.; Holmfeldt, L.; Parker, M.; Easton, J.; et al. The landscape of somatic mutations in infant MLL-rearranged acute lymphoblastic leukemias. Nat. Genet. 2015, 47, 330–337. [Google Scholar] [CrossRef]
  8. Bolouri, H.; Farrar, J.E.; Triche, T., Jr.; Ries, R.E.; Lim, E.L.; Alonzo, T.A.; Ma, Y.; Moore, R.; Mungall, A.J.; Marra, M.A.; et al. The molecular landscape of pediatric acute myeloid leukemia reveals recurrent structural alterations and age-specific mutational interactions. Nat. Med. 2018, 24, 103–112. [Google Scholar] [CrossRef] [Green Version]
  9. Horton, S.J.; Jaques, J.; Woolthuis, C.; van Dijk, J.; Mesuraca, M.; Huls, G.; Morrone, G.; Vellenga, E.; Schuringa, J.J. MLL-AF9-mediated immortalization of human hematopoietic cells along different lineages changes during ontogeny. Leukemia 2013, 27, 1116–1126. [Google Scholar] [CrossRef] [Green Version]
  10. Okeyo-Owuor, T.; Li, Y.; Patel, R.M.; Yang, W.; Casey, E.B.; Cluster, A.S.; Porter, S.N.; Bryder, D.; Magee, J.A. The efficiency of murine MLL-ENL-driven leukemia initiation changes with age and peaks during neonatal development. Blood Adv. 2019, 3, 2388–2399. [Google Scholar] [CrossRef]
  11. Barabe, F.; Kennedy, J.A.; Hope, K.J.; Dick, J.E. Modeling the initiation and progression of human acute leukemia in mice. Science 2007, 316, 600–604. [Google Scholar] [CrossRef] [PubMed]
  12. Buechele, C.; Breese, E.H.; Schneidawind, D.; Lin, C.H.; Jeong, J.; Duque-Afonso, J.; Wong, S.H.; Smith, K.S.; Negrin, R.S.; Porteus, M.; et al. MLL leukemia induction by genome editing of human CD34+ hematopoietic cells. Blood 2015, 126, 1683–1694. [Google Scholar] [CrossRef] [PubMed] [Green Version]
  13. Wei, J.; Wunderlich, M.; Fox, C.; Alvarez, S.; Cigudosa, J.C.; Wilhelm, J.S.; Zheng, Y.; Cancelas, J.A.; Gu, Y.; Jansen, M.; et al. Microenvironment determines lineage fate in a human model of MLL-AF9 leukemia. Cancer Cell 2008, 13, 483–495. [Google Scholar] [CrossRef] [PubMed] [Green Version]
  14. Secker, K.A.; Keppeler, H.; Duerr-Stoerzer, S.; Schmid, H.; Schneidawind, D.; Hentrich, T.; Schulze-Hentrich, J.M.; Mankel, B.; Fend, F.; Schneidawind, C. Inhibition of DOT1L and PRMT5 promote synergistic anti-tumor activity in a human MLL leukemia model induced by CRISPR/Cas9. Oncogene 2019. [Google Scholar] [CrossRef] [PubMed]
  15. Schneidawind, C.; Jeong, J.; Schneidawind, D.; Kim, I.S.; Duque-Afonso, J.; Wong, S.H.K.; Iwasaki, M.; Breese, E.H.; Zehnder, J.L.; Porteus, M.; et al. MLL leukemia induction by t(9;11) chromosomal translocation in human hematopoietic stem cells using genome editing. Blood Adv. 2018, 2, 832–845. [Google Scholar] [CrossRef] [PubMed]
  16. Aoki, Y.; Watanabe, T.; Saito, Y.; Kuroki, Y.; Hijikata, A.; Takagi, M.; Tomizawa, D.; Eguchi, M.; Eguchi-Ishimae, M.; Kaneko, A.; et al. Identification of CD34+ and CD34- leukemia-initiating cells in MLL-rearranged human acute lymphoblastic leukemia. Blood 2015, 125, 967–980. [Google Scholar] [CrossRef] [Green Version]
  17. Baer, M.R.; Stewart, C.C.; Lawrence, D.; Arthur, D.C.; Mrozek, K.; Strout, M.P.; Davey, F.R.; Schiffer, C.A.; Bloomfield, C.D. Acute myeloid leukemia with 11q23 translocations: Myelomonocytic immunophenotype by multiparameter flow cytometry. Leukemia 1998, 12, 317–325. [Google Scholar] [CrossRef] [Green Version]
  18. Shankavaram, U.T.; Reinhold, W.C.; Nishizuka, S.; Major, S.; Morita, D.; Chary, K.K.; Reimers, M.A.; Scherf, U.; Kahn, A.; Dolginow, D.; et al. Transcript and protein expression profiles of the NCI-60 cancer cell panel: An integromic microarray study. Mol. Cancer Ther. 2007, 6, 820–832. [Google Scholar] [CrossRef] [Green Version]
  19. Haferlach, T.; Kohlmann, A.; Wieczorek, L.; Basso, G.; Kronnie, G.T.; Bene, M.C.; De Vos, J.; Hernandez, J.M.; Hofmann, W.K.; Mills, K.I.; et al. Clinical utility of microarray-based gene expression profiling in the diagnosis and subclassification of leukemia: Report from the International Microarray Innovations in Leukemia Study Group. J. Clin. Oncol. 2010, 28, 2529–2537. [Google Scholar] [CrossRef] [Green Version]
  20. Hansen, A.H.; Sergeev, E.; Bolognini, D.; Sprenger, R.R.; Ekberg, J.H.; Ejsing, C.S.; McKenzie, C.J.; Rexen Ulven, E.; Milligan, G.; Ulven, T. Discovery of a Potent Thiazolidine Free Fatty Acid Receptor 2 Agonist with Favorable Pharmacokinetic Properties. J. Med. Chem. 2018, 61, 9534–9550. [Google Scholar] [CrossRef]
  21. Bindels, L.B.; Porporato, P.E.; Ducastel, S.; Sboarina, M.; Neyrinck, A.M.; Dewulf, E.M.; Feron, O.; Lestavel, S.; Cani, P.D.; Staels, B.; et al. Ffar2 expression regulates leukaemic cell growth in vivo. Br. J. Cancer 2017, 117, 1336–1340. [Google Scholar] [CrossRef] [PubMed] [Green Version]
  22. Pan, P.; Oshima, K.; Huang, Y.W.; Agle, K.A.; Drobyski, W.R.; Chen, X.; Zhang, J.; Yearsley, M.M.; Yu, J.; Wang, L.S. Loss of FFAR2 promotes colon cancer by epigenetic dysregulation of inflammation suppressors. Int. J. Cancer 2018, 143, 886–896. [Google Scholar] [CrossRef] [PubMed]
  23. Wong, S.H.; Goode, D.L.; Iwasaki, M.; Wei, M.C.; Kuo, H.P.; Zhu, L.; Schneidawind, D.; Duque-Afonso, J.; Weng, Z.; Cleary, M.L. The H3K4-Methyl Epigenome Regulates Leukemia Stem Cell Oncogenic Potential. Cancer Cell 2015, 28, 198–209. [Google Scholar] [CrossRef] [PubMed] [Green Version]
  24. Quinlan, C.L.; Kaiser, S.E.; Bolanos, B.; Nowlin, D.; Grantner, R.; Karlicek-Bryant, S.; Feng, J.L.; Jenkinson, S.; Freeman-Cook, K.; Dann, S.G.; et al. Targeting S-adenosylmethionine biosynthesis with a novel allosteric inhibitor of Mat2A. Nat. Chem. Biol. 2017, 13, 785–792. [Google Scholar] [CrossRef] [PubMed]
  25. Daigle, S.R.; Olhava, E.J.; Therkelsen, C.A.; Majer, C.R.; Sneeringer, C.J.; Song, J.; Johnston, L.D.; Scott, M.P.; Smith, J.J.; Xiao, Y.; et al. Selective killing of mixed lineage leukemia cells by a potent small-molecule DOT1L inhibitor. Cancer Cell 2011, 20, 53–65. [Google Scholar] [CrossRef] [PubMed] [Green Version]
  26. Chan-Penebre, E.; Kuplast, K.G.; Majer, C.R.; Boriack-Sjodin, P.A.; Wigle, T.J.; Johnston, L.D.; Rioux, N.; Munchhof, M.J.; Jin, L.; Jacques, S.L.; et al. A selective inhibitor of PRMT5 with in vivo and in vitro potency in MCL models. Nat. Chem. Biol. 2015, 11, 432–437. [Google Scholar] [CrossRef]
  27. Duncan, K.W.; Rioux, N.; Boriack-Sjodin, P.A.; Munchhof, M.J.; Reiter, L.A.; Majer, C.R.; Jin, L.; Johnston, L.D.; Chan-Penebre, E.; Kuplast, K.G.; et al. Structure and Property Guided Design in the Identification of PRMT5 Tool Compound EPZ015666. ACS Med. Chem. Lett. 2016, 7, 162–166. [Google Scholar] [CrossRef] [Green Version]
  28. Bushnell, B. BBMap: A Fast, Accurate, Splice-Aware Aligner. 2014. Available online: https://www.osti.gov/servlets/purl/1241166 (accessed on 24 May 2020).
  29. Andrew, S. FastQC: A Quality Control Tool for High Throughput Sequence Data. 2010. Available online: http://www.bioinformatics.babraham.ac.uk/projects/fastqc (accessed on 24 May 2020).
  30. Dobin, A.; Davis, C.A.; Schlesinger, F.; Drenkow, J.; Zaleski, C.; Jha, S.; Batut, P.; Chaisson, M.; Gingeras, T.R. STAR: Ultrafast universal RNA-seq aligner. Bioinformatics 2013, 29, 15–21. [Google Scholar] [CrossRef]
  31. Love, M.I.; Huber, W.; Anders, S. Moderated estimation of fold change and dispersion for RNA-seq data with DESeq2. Genome Biol. 2014, 15, 550. [Google Scholar] [CrossRef] [Green Version]
  32. Leek, J.T.; Johnson, W.E.; Parker, H.S.; Jaffe, A.E.; Storey, J.D. The sva package for removing batch effects and other unwanted variation in high-throughput experiments. Bioinformatics 2012, 28, 882–883. [Google Scholar] [CrossRef]
Figure 1. CRISPR/Cas9 induces specific double-strand DNA breaks within the mixed lineage leukemia (MLL), AF4 and AF9 genes and pairwise application leads to translocations in hematopoietic stem and progenitor cells (HSPCs) derived from adult bone marrow (huBM). (A) Gel images show representative results of T7 endonuclease assays performed on genomic DNA isolated from K562 cells (upper row) or HSPCs of huBM (CD34+) (lower row) nucleofected with single guide (sg)RNAs for the MLL, AF4 or AF9 gene and Cas9 protein. Cas9 alone was used as control. Digested PCR products represent the presence of strand mismatches resulting from indels that are generated by non-homologous end joining (NHEJ) repair of double-strand breaks (DSBs) and were quantified with ImageJ. Resulting cutting efficiencies are displayed. (B) Summarized data of positive translocation products of all performed experiments analyzed via PCR are shown. (C) Representative positive PCR products of genomic DNA isolated from CD34+ huBM nucleofected with MLL and AF4 or AF9 sgRNAs and Cas9 protein or Cas9 alone (control) at indicated time points are shown. (D) Sanger sequencing results of PCR products displayed in (C) are shown.
Cancers 12 01487 g001
Figure 2. KMT2Ar huBM cells reveal a patient-like gene expression profile and present with typical KMT2Ar myelomonocytic immunophenotype. (A) mRNA was isolated from MLL-AF4/-AF9 huBM cells or control cells (CD34+ huBM cells nucleofected with Cas9 alone) and fusion transcripts were identified by RT-PCR. (B) Expression of KMT2Ar-specific target genes MEIS1 and HOXA9 was measured by qPCR. MLL-AF4 and MLL-AF9 huBM cells were normalized to control cells (CD34+ huBM cells nucleofected with Cas9 alone) and compared to patient cells harboring t(4;11)(q21;q23) or t(9;11)(p22;q23), respectively. Experiment was performed in biological duplicates (n = 2) and horizontal bars represent the mean. Student’s t test was used: * p < 0.05. Error bars indicate standard deviation (SD). (C) Representative contour plots of flow cytometry analyses of KMT2Ar huBM and control cells regarding myelomonocytic markers CD15, CD33 and CD64 as well as the expression of CD34 and CD38 after reaching purity are shown. (D) KMT2Ar huBM cells (black line) present with higher expression levels of immaturity marker CD117, lower expression levels of differentiation marker CD14 and higher expression of known KMT2Ar surface marker CD9 compared to control cells (gray shading) [15,16]. (E) Representative morphologies of KMT2Ar huBM and control cells are shown to display less cell differentiation and cell death of KMT2Ar cells. Scale bars define 20 µm.
Cancers 12 01487 g002
Figure 3. MLL-AF4 translocation only immortalizes HSPCs of neonatal origin. (A) Representative semi-quantitative PCR of genomic DNA (100 ng) isolated from KMT2Ar huBM cells over time of culture is displayed showing increasing MLL-AF4/-AF9 PCR products. (B) Fluorescence in situ hybridization (FISH) analyses of KMT2Ar huBM cells were performed after reaching strong PCR products (on day ~50 of culture). Manual inspection of 100 cells demonstrates 100% purity of the KMT2Ar huBM cells. (C) Representative chromosomal translocations are displayed after G-banding analyses. Arrows indicate the reciprocal breaks. (D,E) Individual proliferation curves for the respective huBM (D) and human cord blood (huCB) (E) donor cells with or without MLL translocation are shown. (F) Representative flow cytometry analysis of CD9 expression on KMT2Ar cells over time is displayed.
Cancers 12 01487 g003
Figure 4. KMT2Ar-specific target genes are overexpressed in KMT2Ar cells derived from both huCB and huBM. RNA-seq was performed with MLL-AF4 and -AF9 cells derived from huBM and huCB and control cells (n = 2 for each group). (A) Total numbers of differentially expressed genes (DEGs) are displayed comparing KMT2Ar cells of each origin to control cells. (B) The 73 DEGs concordantly changed in all groups following MLL translocation are displayed representing a common KMT2Ar gene signature. (C) RNA-seq revealed KMT2Ar-specific target genes HOXA9, HOXA10-AS and MEIS1 to be differentially expressed in KMT2Ar cells compared to control cells. Normalized reads per kilobase million (nRPKMs) are plotted as individual data points with the mean. Error bars indicate SD.
Cancers 12 01487 g004
Figure 5. FFAR2 as potential key player in the KMT2Ar leukemogenesis. RNA-seq was performed with MLL-AF4 and -AF9 cells derived from huBM and huCB and control cells (n = 2 for each group). (A) DEGs of MLL-AF4 huBM cells were compared to DEGs of all other KMT2Ar cells and 45 genes were identified as differentially expressed. (B) Heatmap of the DEGs described in (A) is displayed. (C) RNA-seq revealed FFAR2 to be differentially expressed when comparing MLL-AF4 huBM DEGs to other KMT2Ar cells. Normalized reads per kilobase million (nRPKMs) are plotted as individual data points with the mean. Error bars indicate SD. (D) qPCR analysis of CRISPR/Cas9-KMT2Ar cells, non-KMT2Ar patient (UPN1) and KMT2Ar patient (UPN2) samples in contrast to control is shown. Each dot represents a sample. Horizontal lines represent the mean. Student’s t test was used: * p < 0.05. Error bars indicate SD. (E) Downregulated FFAR2 expression in leukemic samples compared to other cancer types (data from oncomine.org). Boxes indicate the range from the 25th to the 75th percentiles; the horizontal lines represent the median; error bars indicate the range from 10th to 90th percentiles; the dots show the maximum and minimum values. (F) FFAR2 expression in different patient leukemia entities compared to healthy controls (data from oncomine.org). Boxes indicate the range from 25th to 75th percentiles; the horizontal lines represent the median; error bars indicate the range from 10th to 90th percentiles; the dots show the maximum and minimum values. Student’s t test was used: * p < 0.05. (G) After 62 days of culture, MLL-AF4 huCB and MLL-AF4 huBM cells were treated with 5 µM of the FFAR2 antagonist GLPG0974 or vehicle (DMSO) and cell count was determined over time using Trypan blue. Student’s t test was used: * p < 0.05.
Cancers 12 01487 g005

