Temperature Dependent Micro-Structure of KAlF4 from Solid to Molten States


1
State Key Laboratory of Advanced Special Steel, Shanghai Key Laboratory of Advanced Ferrometallurgy, School of Materials Science and Engineering, Shanghai University, Shanghai 200444, China
2
CSIRO Mineral Resources, Technology Court, Pullenvale, QLD 4069, Australia
3
Anhui Key Laboratory for Photonic Devices and Materials, Anhui Institute of Optics and Fine Mechanics, Chinese Academy of Sciences, Hefei 230031, China
*
Author to whom correspondence should be addressed.
Materials 2018, 11(10), 1846; https://doi.org/10.3390/ma11101846
Submission received: 12 September 2018
/
Revised: 23 September 2018
/
Accepted: 25 September 2018
/
Published: 27 September 2018
(This article belongs to the Section Advanced Materials Characterization)
Abstract
:In situ high temperature X-ray diffraction and Raman spectroscopy were used to investigate the temperature dependent micro-structure of KAlF4. Density functional theory was applied to simulate the structure of crystalline KAlF4 while a quantum chemistry ab initio simulation was performed to explore the structure of molten KAlF4. Two crystal polymorphs demonstrated to be present in solid KAlF4. At the temperature below 673 K, it belongs to the tetragonal crystal system within the P4/mbm space group, while the high temperature phase is attributed to the monoclinic crystal system within the P21/m space group. Both polymorph KAlF4 phases are characterized by a layered structure consisting of K+ and [AlF6]3− octahedra, each of the [AlF6]3− octahedra equivalently shares four corners with other four [AlF6]3− octahedra along the layer. The layered structure became unstable at higher temperatures and crashed when the temperature exceeded the melting point. It demonstrated that the molten KAlF4 consisted of predominant [AlF4]− and a small amount of [AlF6]3−. The Raman spectrum of molten KAlF4 simulated by using a quantum chemistry ab initio method agreed well with the experimental Raman spectrum.

1. Introduction
The physicochemical properties of molten fluoroaluminates are of considerable importance for the aluminum industry. Molten KAlF4 had been employed not only as electrolyte in producing aluminum [1] but also as a basic part of the flux in the aluminum brazing technology [2]. Hence an understanding of the molten structure of KAlF4 is essential for obtaining necessary knowledge of the properties of the electrolytes for aluminum smelters and the fluxing agent for the aluminum brazing industry.
Over the years, limited work has been carried out focusing on the structure feature of molten KAlF4. The room temperature phase [3,4,5], the structure from the low temperature (4 K) to room temperature [6,7] and the molten states [8] of KAlF4 were extensively investigated. According to Chen’s work [9,10], congruent melting occurred at 575 °C when KAlF4 was heated. The KAlF4 crystal consists of six-coordinated aluminum atoms, which are linked to four bridging fluorine ions, two non-bridging fluorine ions and potassium ions [7,11,12]. The main vibrational wavenumber of molten NaAlF4 at about 630 cm−1 was detected by Robert [13] by using high temperature Raman spectroscopy. With the consideration of the results by high temperature NMR spectra, the band at Raman wavenumber of 630 cm−1 was further assigned to the symmetric stretching vibrations of the [AlF4]− tetrahedron. Akdeniz concluded that the Raman peaks observed at 621 cm−1 for NaAlF4 are related to the Al-F bond of isolated [AlF4]− clusters with a bond length of 1.69 Å [14], as was also assured by molecular simulation [15]. Due to the high corrosivity of KAlF4 melt, the structure evolution from room temperature to the molten states of KAlF4 has not been cleared.
In the present paper, temperature dependent Raman spectroscopic studies of the micro-structure of KAlF4 up to the molten state were conducted in conjunction with high temperature X-ray diffraction to explore the structure evolution of KAlF4 from room temperature to above its melting point. Raman spectra simulations based on density functional theory (DFT) and quantum chemistry ab initio methods were also applied to make the assignments of the characteristic vibration modes of Raman spectra observed at different temperatures.
2. Materials and Methods
2.1. Material Synthesis
All chemicals including AR grade K2CO3, Al(OH)3, and other reagents used in the present study, were obtained from Sinopharm Chemical Reagent Co., Ltd. K2CO3 and Al(OH)3 were first dried at 473 K for 2 h to remove the surface moisture. Stoichiometric amounts of K2CO3 and Al(OH)3 were then mixed with an excess amount of 40% hydrofluoric acid in a teflon cup to form a paste. The paste was dried at 373 K in a platinum crucible. After being ground in an agate mortar, the dried mixture was annealed in a platinum crucible at 723 K for 48 h [9]. The resultant product was ground for subsequent experiments.
2.2. Material Characterization
In situ high temperature X-ray powder diffraction studies were conducted using the Bruker D8 Advance X-ray diffractometer (40 KV, 40 mA) with Cu/Kα1 radiation (λ = 0.15406 nm). The patterns were recorded in an inert atmosphere in the 2θ range of 10 to 100° with a step size of 0.02° and a counting time of 0.33 s per step.
In situ high temperature Raman spectroscopic studies were carried out under a dry inert atmosphere using the LabRAM HR800 Raman spectrometer (Horiba Jobin Y’von, Paris, France) equipped with an ultraviolet pulse laser beam of 355 nm which was focused on the sample through a microprobe with a 4× objective lens. The average laser beam power on the sample was about 60 mW. It was equipped with a microscopic heating furnace (TS1500) (Linkam, Tadworth, UK) with a small temperature deviation of about ±1 K for investigating the microstructure of the sample at different temperatures. The platinum crucible which was applied to measure the high temperature experiment is protected by a patent [16]. A charge coupled device (CCD) detection system by an accumulated mode of 20 × 20 (20 times with 20 s each time) was used to collect Raman scattering light. The sample was held at the targeted temperature for 5 min before recording Raman spectra in order to ensure the sample reaches the targeted temperature and also avoids volatilization of the sample.
2.3. Computational Details
By using the functional set GGA [17] (WC [18]) version with optimized norm-conserving pseudopotentials [19], CASTEP (Cambridge Serial Total Energy Package [20,21]) based on DFT with the plane-wave pseudopotential method [22], was applied to calculate vibrational modes of KAlF4. The plane-wave cut-off energy was fixed at 780.0 eV. The other parameters which were set in the computation, included a grid of 3 × 2 × 2 k-points and a self-consistent field (SCF) convergence threshold of 2 × 10⁻⁶ eV/atom.
In order to examine the clusters existing in the molten KAlF4, a simulation based on a quantum chemistry ab initio method was also carried out. A series of aluminum fluoride model clusters with typical characteristic structures were proposed and optimized for geometric configuration before the simulation. The restricted Hartree-Fock (RHF) [23] calculation method with a 6-31G (d) [24] basis set was applied for geometry optimization and the calculation of the vibration frequencies of various molecules.
3. Results and Discussion
3.1. Room Temperature Characteristics of KAlF4
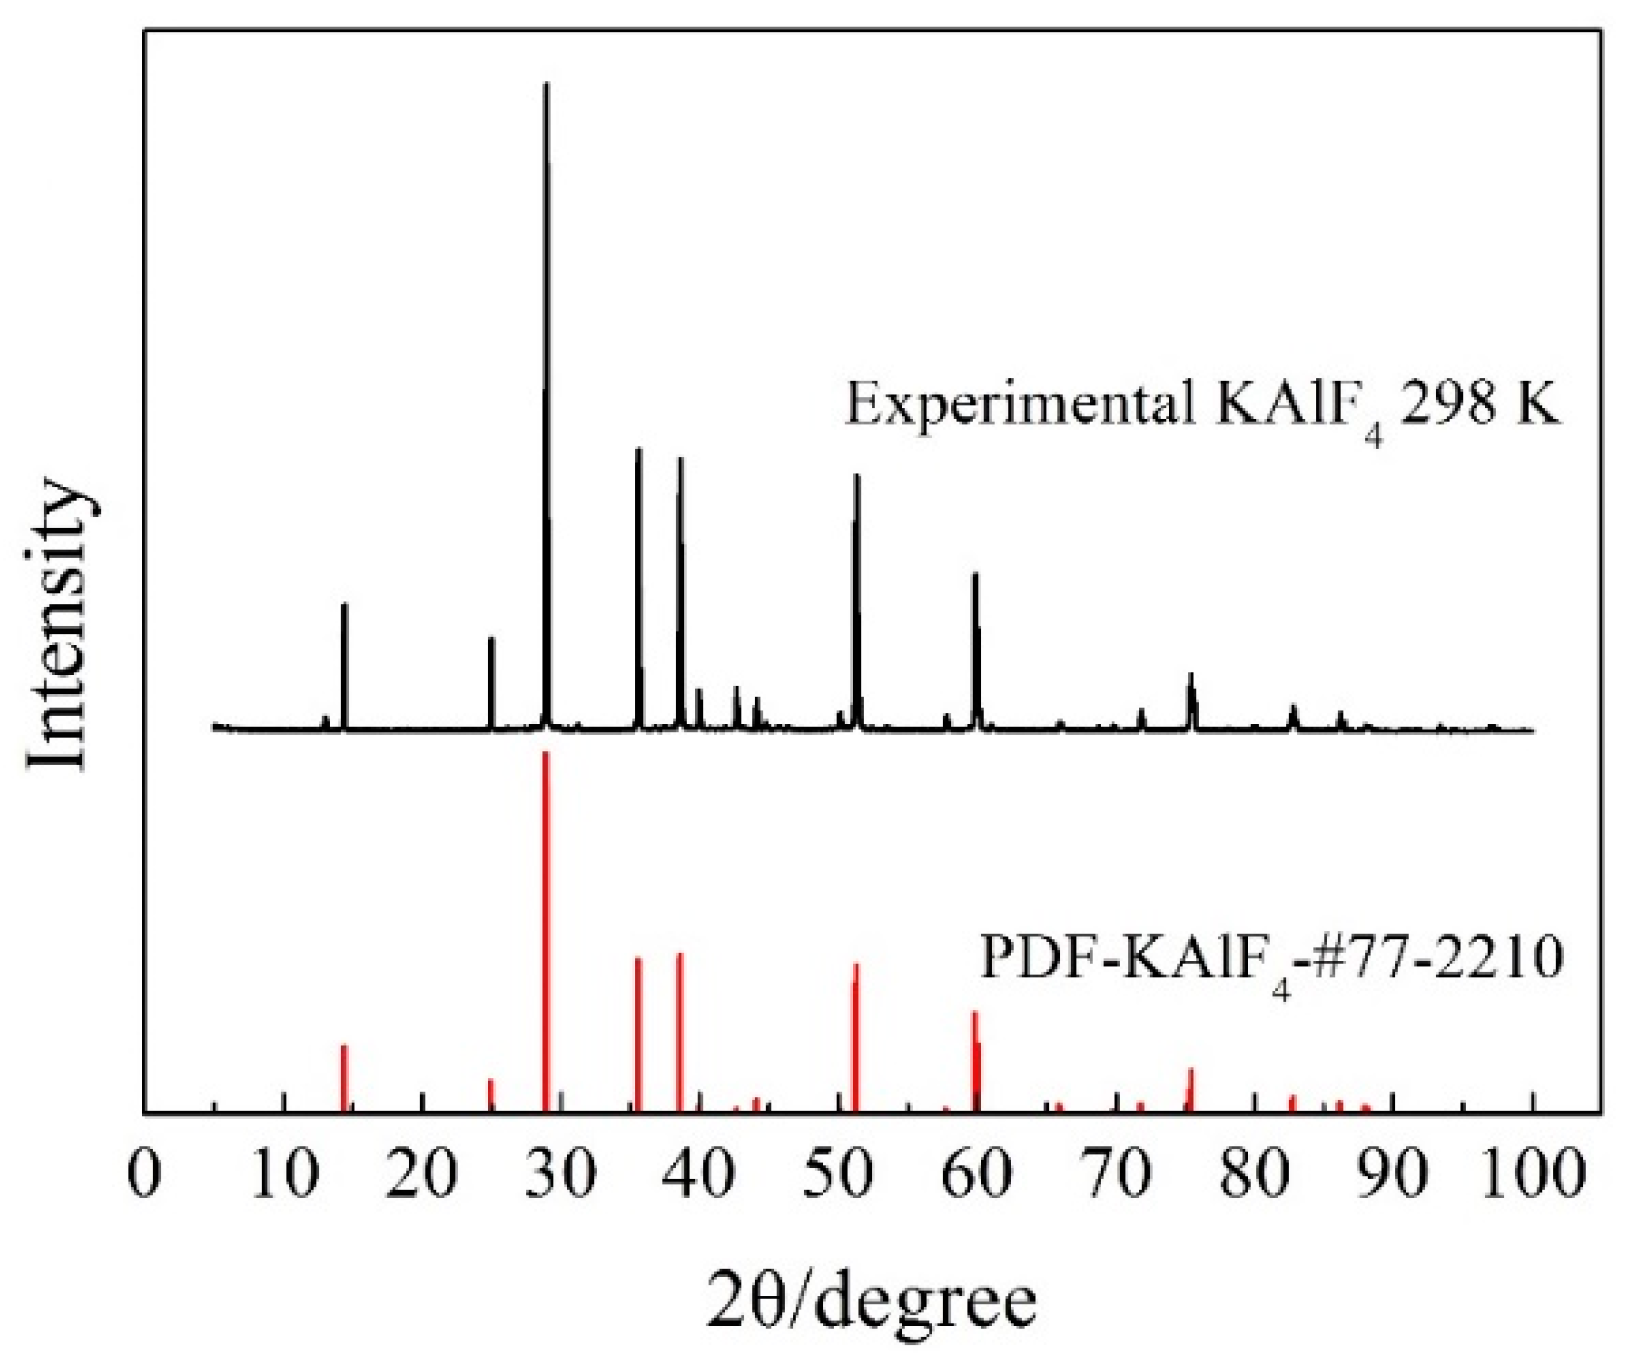
The XRD pattern of the synthesized KAlF4 compound is shown in Figure 1. Both the peak position and relative intensity of main diffraction peaks, were in good agreement with the information provided in the powder diffraction file (PDF) data base for KAlF4, confirming the dominance of the KAlF4 compound in the sample.
At the ambient temperature and pressure, the KAlF4 phase is characterized by a layered structure consisting of K+ and [AlF6]3− octahedra, each [AlF6]3− octahedron equivalently shares four corners with other four [AlF6]3− octahedra within the layer. The [AlF6]3− octahedron consists of a six-coordinated aluminum atom which is linked to six fluorine ions including four bridging fluorine ions and two non-bridging fluorine ions. Figure 2 illustrates a unit cell structure of the room temperature KAlF4 crystal, drawn by the VESTA software [25]. The room temperature KAlF4 unit cell is tetragonal with dimensions a = 5.122 Å, b = 5.122 Å, c = 6.288 Å, α = β = γ = 90°, V = 164.999 Å3, belonging to the P4/mbm space group [3].
The room temperature Raman spectrum was calculated by CASTEP for the KAlF4 crystal and is compared in Figure 3 with the experimental spectrum obtained for the synthesized KAlF4 compound. The small shift in wavenumbers between the experimental and calculated spectra is due to the precision and limitation of the theoretical simulation methods. In order to compare with the experimental spectrum, the calculated spectrum was correct by a factor k1 = 0.000426x + 0.80, where the factor k1 is a function of wavenumber x.
In Figure 3, there are two well defined peaks in the calculated spectrum, which locates at 227.6 and 547.4 cm−1. The calculation results show that the band at 227.6 cm−1 relates to the shearing vibrations of AlVI-Fnb (Fnb represents non-bridging fluorine) while the band at 547.4 cm−1 corresponds to the symmetric stretching vibrations of AlVI-Fnb. According to the group theory analysis, the vibrational modes are distributed among the following irreducible representations: 4A2u + 16Eu + 2B2u + 2A1g + 6Eg + 1B2g + 2A1u + 2A2g + 1B1g, where only A1g, Eg, B2g and B1g are Raman-active modes based on the selection rules. Similarly, two peaks were observed at 228 and 547 cm−1 in the wavenumber range of 200–600 cm−1 of the experimental spectrum at room temperature. Comparing with the calculated results of the room temperature KAlF4 crystal, the band at 228 cm−1 is believed to be due to the shearing vibrations of AlVI-Fnb, while the band at 547 cm−1 results from the symmetric stretching vibrations of AlVI-Fnb. Overall, the simulated results were in good agreement with the experimental spectra for the main vibration peaks. Therefore, it is feasible to apply DFT to calculate Raman spectra of fluoroaluminate systems [26,27]. The major vibration modes of the room temperature phase of KAlF4 are listed in Table 1. And all of the calculated Raman modes of the room temperature phase of KAlF4 are shown in Table S1 (in Supplementary Materials).
3.2. The Phase Transformation of KAlF4
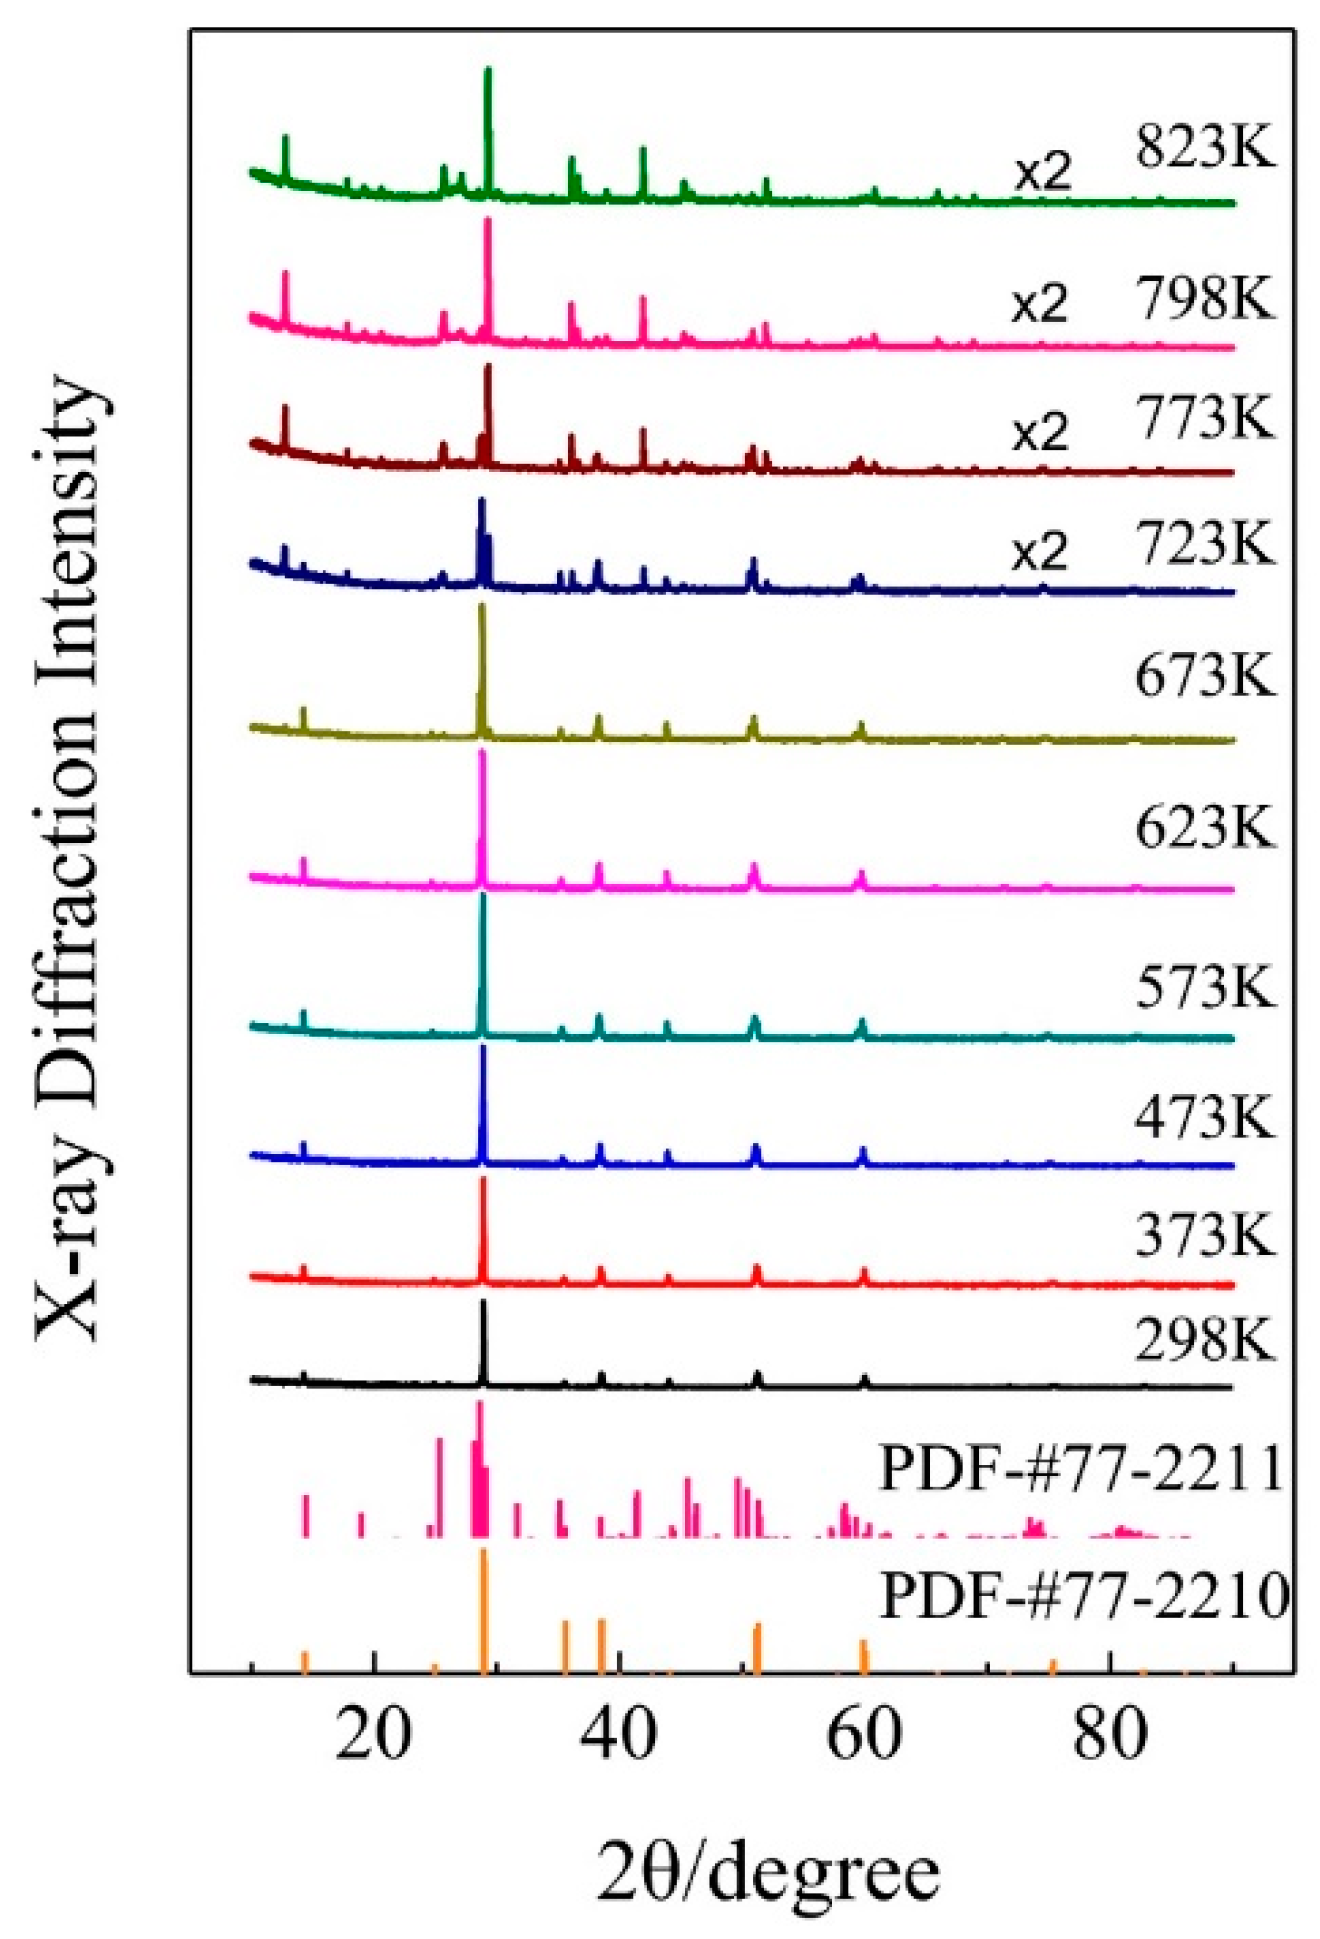
The temperature dependent X-ray diffraction spectra of the synthesized KAlF4 compound were recorded while the sample was heated from room temperature to 823 K. The sample was heated at about 10 K/min under an argon atmosphere and held at each temperature point for five minutes prior to measurement to ensure that the sample reached the designated temperature. As shown in Figure 4, the sample maintained in its room temperature tetragonal structure until 673 K and then transformed to the high temperature phase as the sample temperature was further raised from 673 to 723 K. The high temperature phase of KAlF4 is characterized by a monoclinic structure, belonging to the P21/m space group, with its unit cell dimensions a = 6.542 Å, b = 7.195 Å, c = 7.177 Å, α = 90°, β = 108.478°, γ = 90°, V = 320.415 Å3, which is similar to the structure in the literature [7].
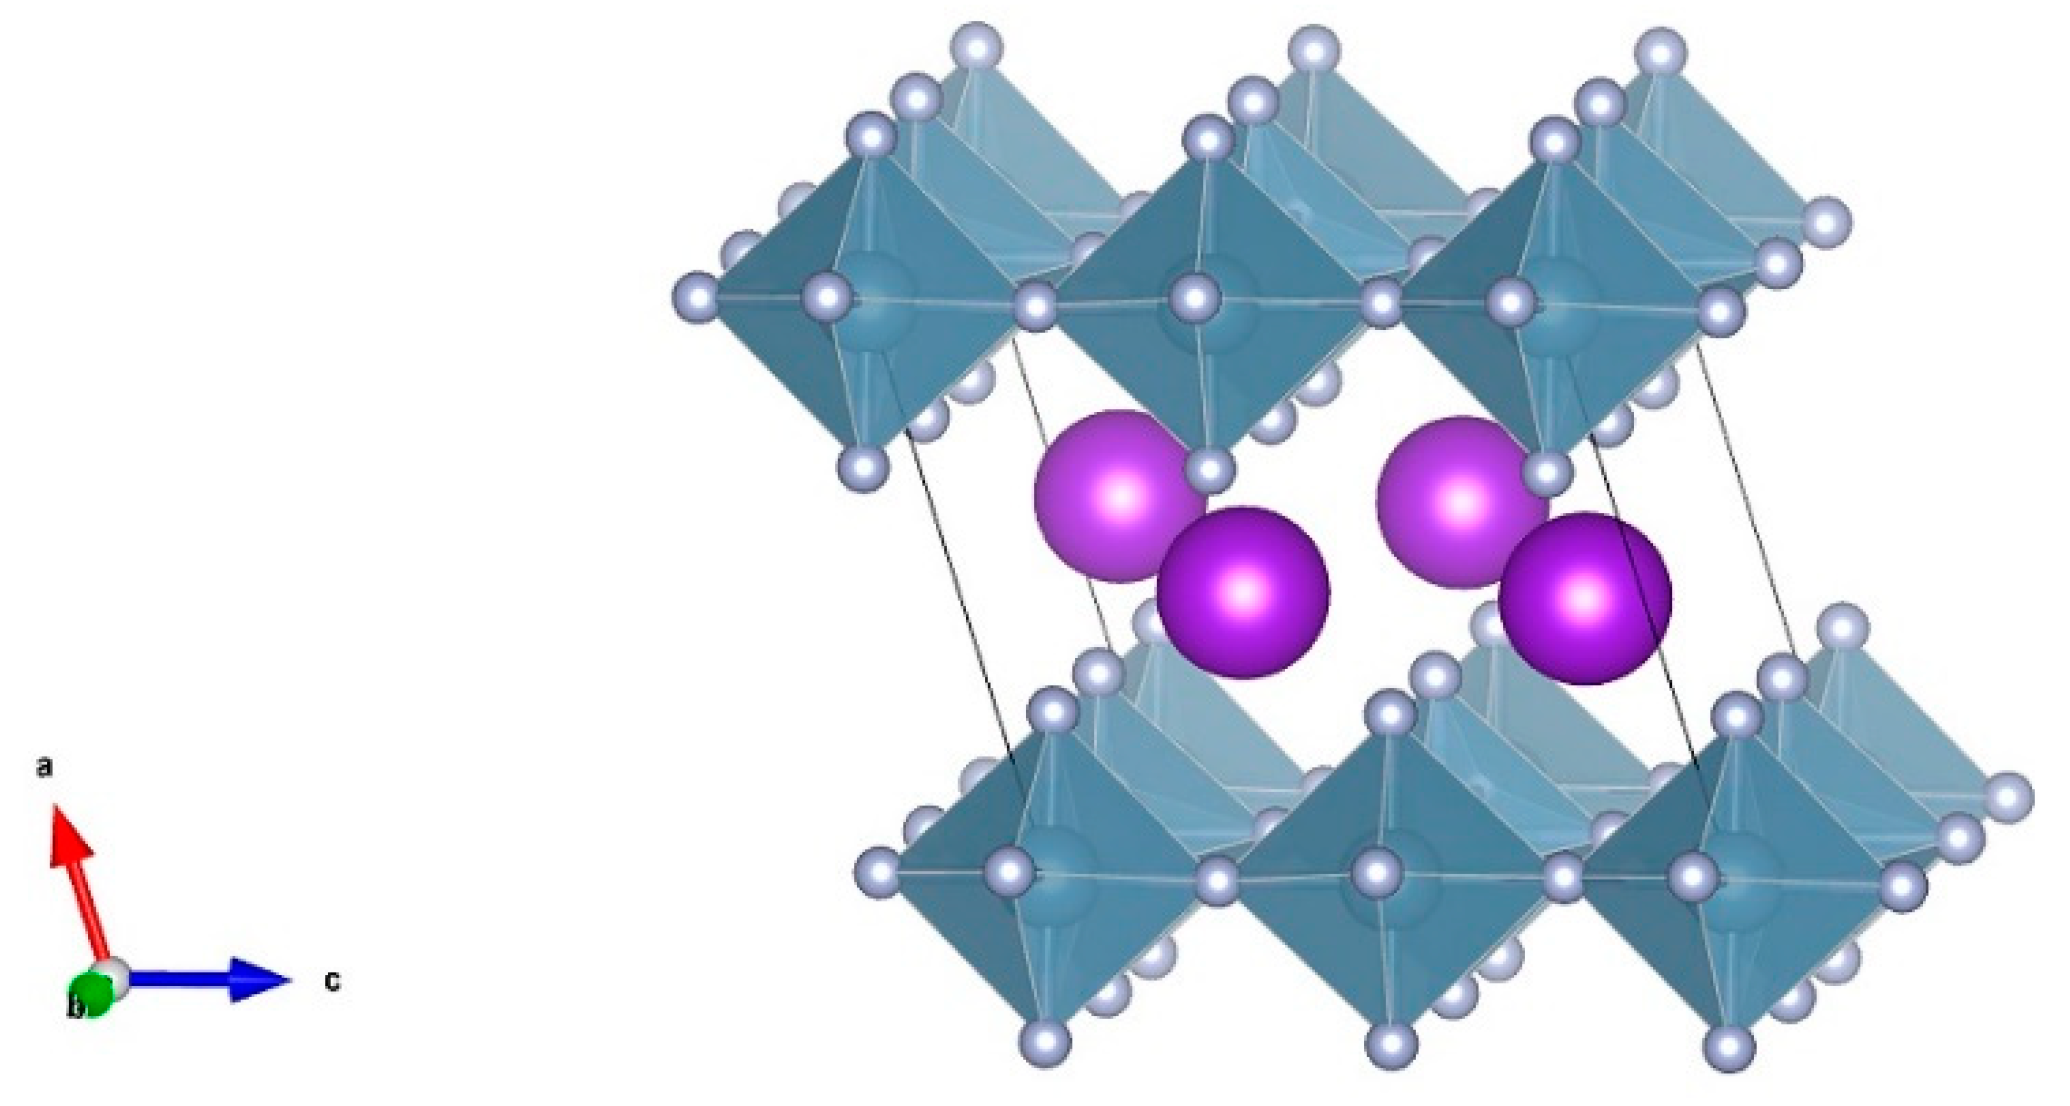
Figure 5 shows a monoclinic unit cell structure of the high temperature phase of KAlF4 which consists of potassium ions and a six-coordinated Al atom forming an octahedron. The high temperature phase was also characterized by a layered structure consisting of K+ ions and [AlF6]3− octahedra, where each [AlF6]3− octahedron shares four corners with other [AlF6]3− octahedra within the layer. The potassium ions between the [AlF6]3− octahedron layers were used to keep the charge balanced. Comparing with the room temperature phase, the structure of the high temperature phase is more distorted due to the temperature impact, resulting in a more complicated XRD spectrum, as evidenced in Figure 4.
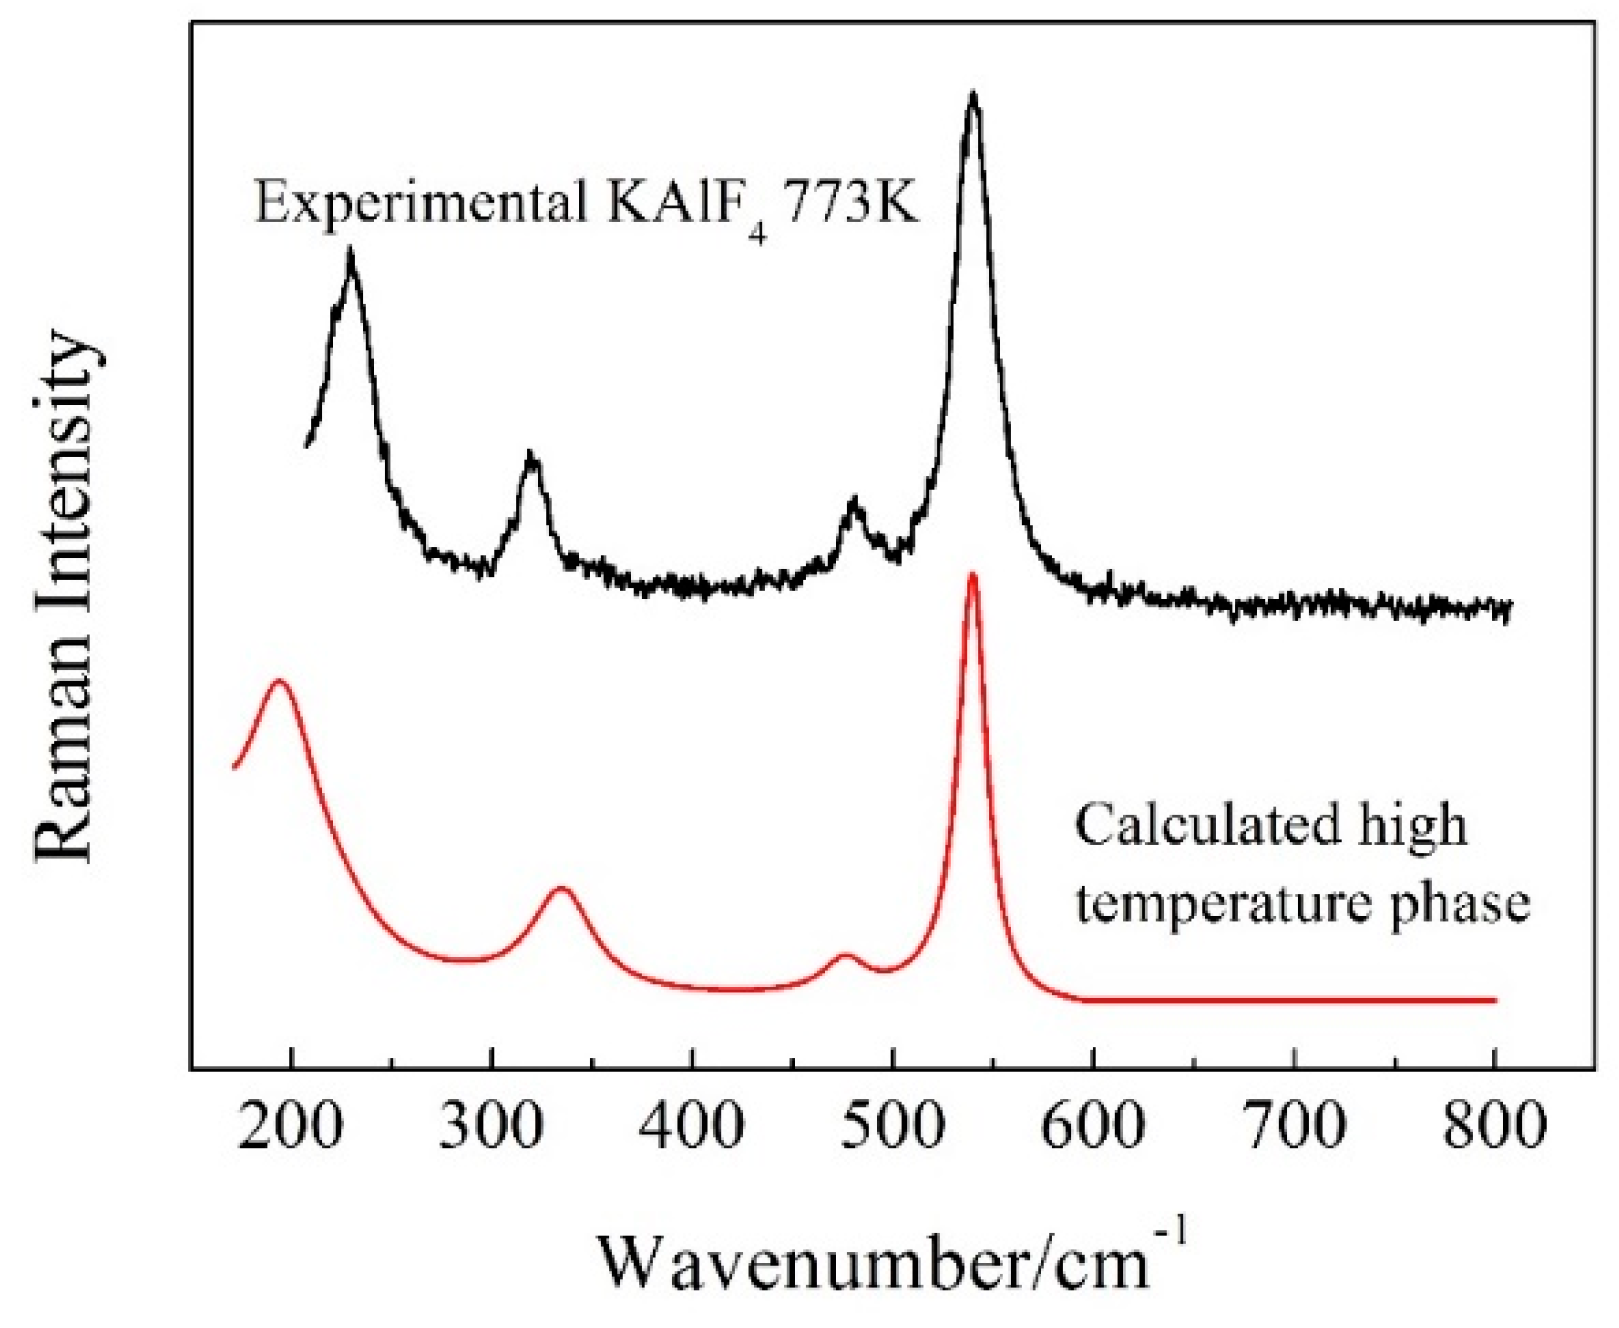
The Raman spectrum of the high temperature phase of KAlF4 was calculated (based on its cell structure in Figure 5) by CASTEP and is shown in Figure 6 together with the experimental spectrum obtained at 773 K. The calculated wavenumber values of the high temperature phase of KAlF4 were corrected with a factor k2 = −0.000835x + 1.41 to account for the shifts for comparing with the experimental spectrum. Overall, there were very little distinction between the simulated and experimental spectra for the main vibrational peaks. As shown in Figure 6, four peaks, located at 193.9, 335.9, 474.5 and 539.5 cm−1, respectively, were identified from the calculated spectrum. Based on simulation, the bands at 193.9, 335.9 and 474.5 cm−1 are assigned to the shearing vibrations of AlVI-Fnb, while the Raman band at 539.5 cm−1 is assigned to the symmetric stretching vibrations of AlVI-Fnb. According to the group theory analysis, the vibrational modes are distributed among the following irreducible representations: 13Bg + 19Au + 23Bu + 17Ag, where only Ag and Bg are Raman-active modes based on the selection rules. The major vibration modes calculated for the high temperature phase of KAlF4 are listed in Table 2. And all of the calculated Raman modes of the high temperature phase of KAlF4 are shown in Table S2 (in Supplementary Materials). Similar peaks were observed at 229, 319, 481 and 539 cm−1 in the 773 K experimental spectrum. Comparing with the calculated spectrum of the high temperature phase of KAlF4, the bands at 229, 319 and 481 cm−1 are believed to represent the shearing vibration of AlVI-Fnb and the band at 539 cm−1 is relating to the symmetric stretching vibrations of AlVI-Fnb. Two new bands which are located at 319 and 481 cm−1, were observed at 773 K, are related to the transformation of the unit cell structure from tetragonal to monoclinic.
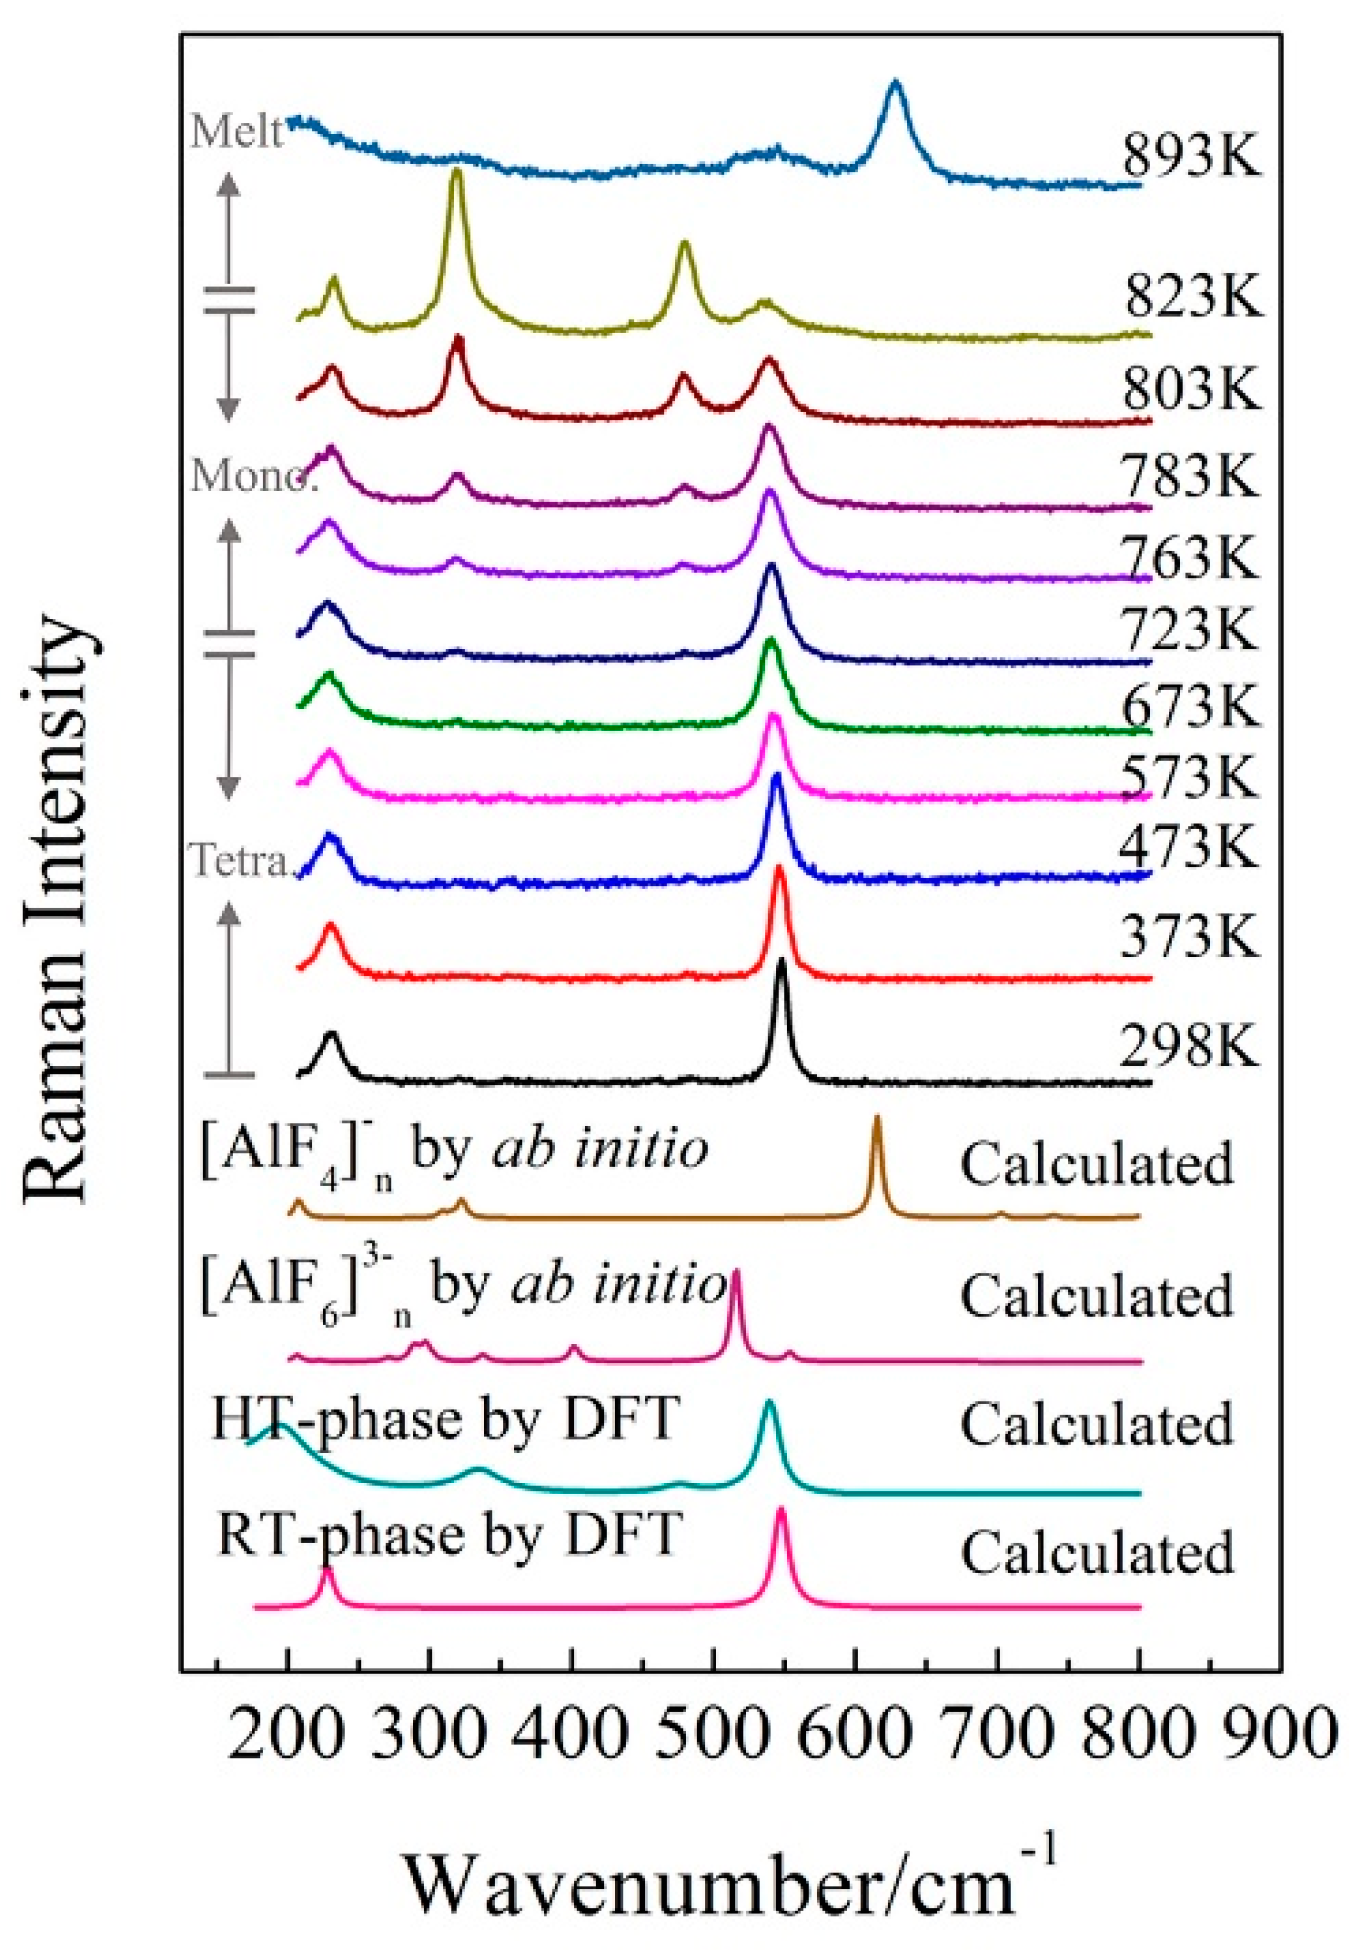
Figure 7 presents the Raman spectra of the KAlF4 crystal recorded when the sample was heated (at a heating rate of 10 K/min) from room temperature to 823 K and at a heating rate of 5 K/min afterwards. The high temperature spectra were recorded 5 min after the sample reached the target temperature. Figure 7 includes the calculated Raman spectrum of [AlF6]3−n clusters (by ab initio method) which refers to our previous work [28]. As the sample temperature increased, the Raman band at 547 cm−1 shows a clear evidence of band broadening and redshifts in wavenumber.
Two new Raman bands at 319 and 481 cm−1 started to appear at 673 K and were gradually enhanced as the sample temperature increased from 673 to 823 K. As discussed earlier, the bands at 319 and 481 cm−1 were attributed to the shearing vibrations of AlVI-Fnb of the [AlF6]3− octahedra with the high temperature phase. As clearly shown in Figure 4, the sample transformed from the tetragonal to monoclinic structure as the sample temperature was further raised from 673 to 723 K. Table 3 summarizes the structure parameters of the room and high temperature phases. Figure 8 illustrates an intermediate KAlF4 structure as it evolves from the room to high temperature structure. The room temperature and high temperature phase are drawn in a simple diagram. In Figure 8, the grey unit cell represents the room temperature phase while the chromatic unit cell constitutes the high temperature phase. As KAlF4 turns from the tetragonal to monoclinic structure approximately at 723 K, the space group changes from P4/mbm to P21/m. The cell length becomes much longer, and one of the cell angles increases from 90.000 to 108.478°. As a consequence, the distribution of the bond length and bond angle of KAlF4 becomes more complicated.
As the sample temperature increased further, the sample was fully melted at 893 K and is characterized by the molten structure as evidenced in Figure 7.
3.3. Characteristics of Molten KAlF4
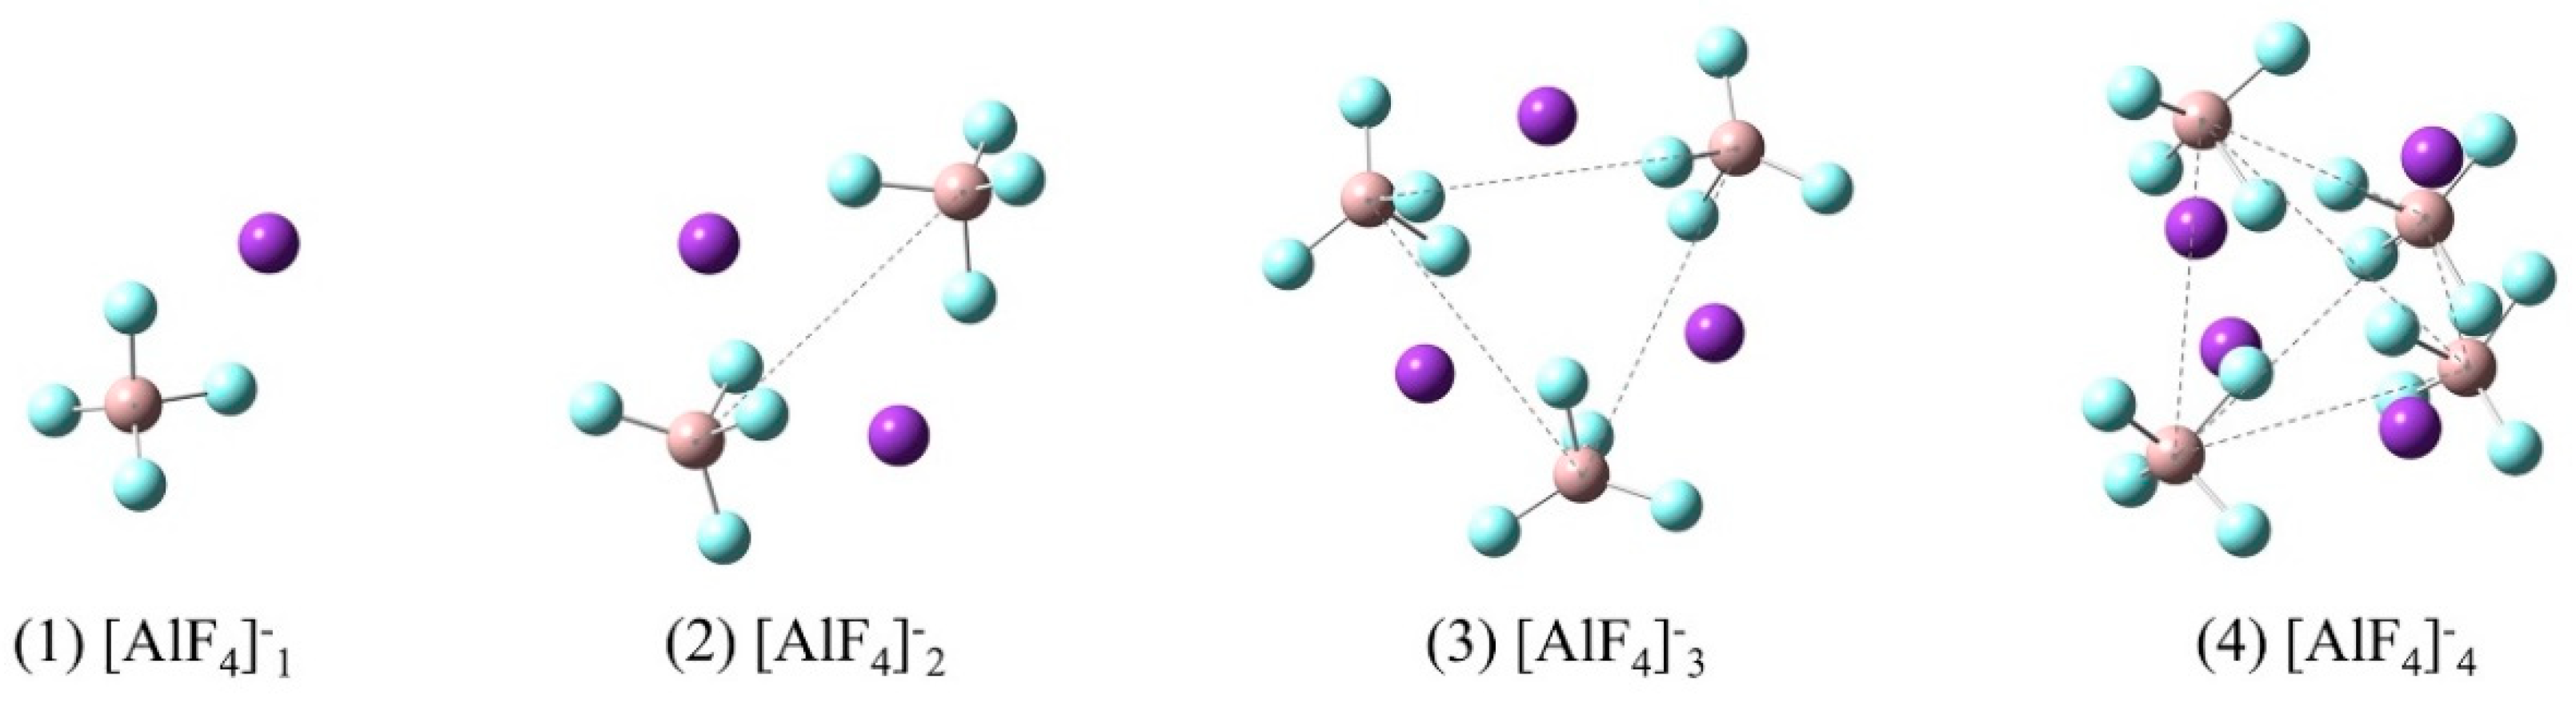
According to the literatures [29,30], [AlF4]− is the main species in molten KAlF4. Figure 9 illustrates a series of possible [AlF4]−n model clusters presented in molten KAlF4. After being optimized for geometry configuration, these model clusters were used for a quantum chemistry ab initio method to calculate the Raman spectra. The characteristic vibrational wavenumber of the Al-F symmetric stretching vibrational modes of the [AlF4]−n clusters were then estimated accordingly.
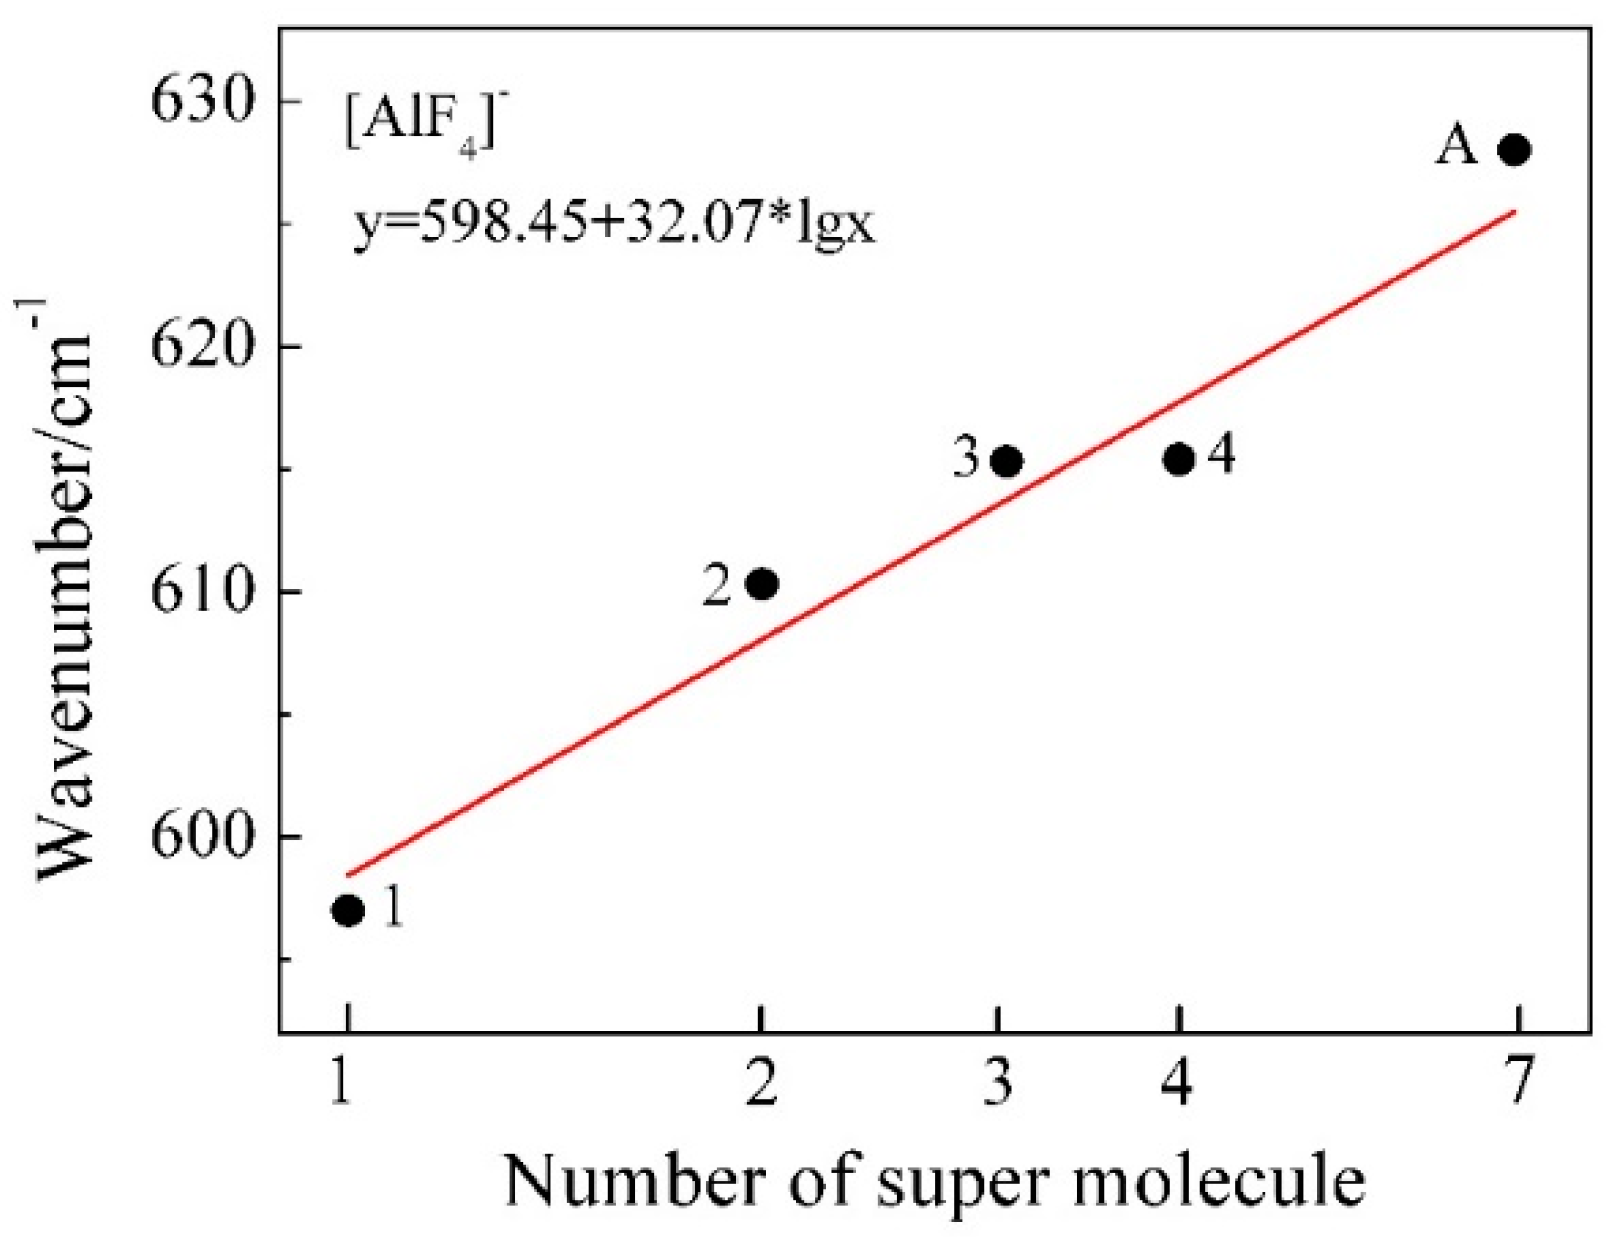
The restricted Hartree-Fock calculation method using a 6-31G (d) [31,32] basis set and was applied for geometry optimization and simulation of Raman vibrational modes of possible model clusters in the melt. When the calculated Raman spectra are compared with the experimental results, corrections are often needed for the intensity and frequency due to the effect of experimental temperature and the laser wavelength [33]. The wavenumbers of the calculated Raman spectra in Figure 10 have been corrected using a scaling factor of 0.90 [34] to better represent the experimental Raman spectrum. The characteristic wavenumber of Al-F symmetric stretching vibrational modes was further estimated from Figure 10 and compared with the experimental and reported values in Table 4. The local structure environment of a crystal is believed to have brought an impact on the structure in of the melt when it is melted. Therefore it was assumed that there are six [AlF4]− tetrahedra in the neighbor of an isolated [AlF4]− tetrahedron in the melt according to the crystal KAlF4 structure in KAlF4. In Figure 11, the characteristic wavenumber of the symmetric stretching vibrational modes of a particular model cluster was plotted in a log scale as a liner function of the number of molecules in the [AlF4]−n cluster. As the number of molecules in the clusters increased, the characteristic wavenumber of the Al-F symmetric stretching vibrational mode of [AlF4]−n appeared to increase. The symmetric stretching vibrational wavenumber of the model cluster with seven molecules of [AlF4]− was therefore estimated to be 625.6 cm−1, which was in good agreement with the values observed in the experiment and reported in the literature [15,35,36,37].
As shown in Figure 7, the Raman band of 628 cm−1, which was attributed to the symmetric stretching vibrations of AlIV-Fnb of the [AlF4]− tetrahedron, appeared at 863 K. Simultaneously, the intensity of the Raman band of 628 cm−1 increased while the intensity of the Raman band of 536 cm−1 decreased. The six-coordinated Al atom began to turn into four-coordinated. At 893 K, KAlF4 had been completely melted, revealing the symmetric stretching vibrations of AlIV-Fnb of the [AlF4]− tetrahedron and little symmetric stretching vibrations of AlVI-Fnb of the [AlF6]3− octahedron were in the melt.
4. Conclusions
The structure evolution of KAlF4 was investigated by in situ high temperature X-ray diffraction and Raman spectroscopy. The major vibrational modes of temperature dependent Raman spectra of KAlF4 were assigned based on the calculated spectra by both density functional theory and quantum chemistry ab initio methods.
Below the melting point, solid KAlF4 was found to present in two different polymorph phases at room and high temperature. Both polymorph KAlF4 phases are characterized by a layered structure consisting of K+ and [AlF6]3− octahedra, where each [AlF6]3− octahedron equivalently shares four corners with other four [AlF6]3− octahedra along the layer. While the room temperature phase is in the tetragonal cell (space group P4/mbm), the high temperature phase undergoes a monoclinic distortion (space group P21/m) together with an ordering of the K atoms.
The layer structure decomposed with increasing temperature and finally turned to [AlF4]− tetrahedra when the temperature exceeds the melting point. It was hence indicated that in molten KAlF4, there is a principal amount of [AlF4]− and a small amount of [AlF6]3−. This was further confirmed by quantum chemistry ab initio simulations.
Supplementary Materials
The following are available online at https://www.mdpi.com/1996-1944/11/10/1846/s1, Table S1: The assignment of all calculated room temperature Raman vibration modes of crystalline KAlF4, Table S2: The assignment of all calculated Raman vibration modes of high temperature phase of KAlF4.
Author Contributions
Conceptualization, N.M., J.L.Y.; Data curation, N.M.; Investigation, N.M., J.L.Y.; Writing—original draft, N.M.; Writing—review & editing, N.M., J.L.Y., L.M.L., J.W.; Software, J.L.Y., S.M.W.; Resources, J.L.Y., L.M.L., S.M.W.
Funding
This work was performed with financial support from National Natural Science Foundation of China (grant number 21773152), National 111 project (the Programme of Introducing Talents of Discipline to Universities, No. D17002), Shanghai Committee of Science and Technology Fund, China (grant number 12520709200), Open Project Program of the State Key Laboratory of Advanced Special Steel, Shanghai University, China (grant numbers SKLASS2015-01, SKLASS2017-02), Independent Research and Development Project of State Key Laboratory of Advanced Special Steel, Shanghai University (SKLASS 2016-Z01) and Special Fund Project of Shanghai Municipality for Science and Technology Development (YDZX20173100001316).
Conflicts of Interest
The authors declare no conflict of interest.
References
- Danielik, V.; Híveš, J. Low-melting electrolyte for aluminum smelting. J. Chem. Eng. Data 2004, 49, 1414–1417. [Google Scholar] [CrossRef]
- Kawase, H.; Shintani, H.; Miyamoto, M. Flux for Brazing the Aluminum Parts and Preparing Method of the Same. U.S. Patent US4579605A, 1 April 1986. [Google Scholar]
- Nouet, J.; Pannetier, J.; Fourquet, J.L. The room-temperature structure of potassium tetrafluoroaluminate. Acta Crystallogr. 1981, 37, 32–34. [Google Scholar] [CrossRef] [Green Version]
- Bail, A.L. Ab initio structure determination of nanosized θ-KAlF4 with edge-sharing AlF6 octahedra. Powder Diffr. 2009, 24, 185–190. [Google Scholar] [CrossRef]
- Gibaud, A.; Bail, A.L.; Bulou, A. A re-investigation of the room-temperature phase of KAlF4: Evidence of antiphase domains. J. Phys. C Solid State Phys. 1986, 19, 4623–4633. [Google Scholar] [CrossRef]
- Gibaud, A.; Bulou, A.; Bail, A.L.; Nouet, J.; Zeyen, C. A premartensitic phase in KAlF4: Neutron and X-ray scattering evidences. J. Phys. 1987, 48, 1521–1532. [Google Scholar] [CrossRef]
- Launay, J.M.; Bulou, A.; Hewat, A.W. Shear transformation in the layered compound KAlF4: Low temperature phase structure and transformation mechanism. J. Phys. 1985, 46, 771–782. [Google Scholar] [CrossRef]
- Robert, E.; Olsen, J.E.; Gilbert, B.; Østvold, T. Structure and thermodynamics of potassium fluoride-aluminium fluoride melts. Raman spectroscopic and vapour pressure studies. Acta Chem. Scand. 1997, 51, 379–386. [Google Scholar] [CrossRef]
- Chen, R.; Wu, G.H.; Zhang, Q.Y. Phase Diagram of the System KF-AlF3. J. Am. Ceram. Soc. 2000, 83, 3196–3198. [Google Scholar] [CrossRef]
- Chen, R.; Wu, G.H.; Zhang, Q.Y. The preparation and stability of KAlF4 and related fluorides. Chemistry (Chin.) 2000, 9, 50–52. [Google Scholar] [CrossRef]
- Schoonman, J.; Huggins, R. Electrical properties of undoped and doped potassium tetrafluoaluminate: KAlF4. J. Solid State Chem. 1976, 16, 413–422. [Google Scholar] [CrossRef]
- Brosset, C. Herstellung und kristallbau einiger alkalialuminiumfluoride vom typus TlAlF4. Anorg. Allg. Chem. 1938, 239, 301–304. [Google Scholar] [CrossRef]
- Robert, E.; Lacassagne, V.; Bessada, C.; Massiot, D.; Gillbert, B.; Coutures, J.P. Study of NaF-AlF3 melts by high-temperature 27Al NMR spectroscopy comparison with results from Raman spectroscopy. Inorg. Chem. 1999, 38, 214–217. [Google Scholar] [CrossRef]
- Akdeniz, Z.; Cicek, Z.; Pastore, G.; Tosi, M.P. Ionic clusters in aluminium-sodium fluoride melts. Mod. Phys. Lett. B 1998, 12, 995–1002. [Google Scholar] [CrossRef]
- Akdeniz, Z.; Madden, P.A. Raman spectra of ionic liquids: A simulation study of AlF3 and its mixtures with NaF. J. Phys. Chem. B 2006, 110, 6683–6691. [Google Scholar] [CrossRef] [PubMed]
- Ma, N.; You, J.L.; Xie, Y.F.; Wang, M.; Wang, J. A New Type Crucible Suitable for High Temperature Raman Spectroscopy on Volatile Molten. China Patent CN 206161531 U, 10 May 2017. Available online: http://dbpub.cnki.net/grid2008/dbpub/detail.aspx?dbcode=SCPD&dbname=SCPD2017&filename=CN206161531U&uid=WEEvREcwSlJHSldRa1FhdXNXa0hFbGhkR3creGlMU0pqcUYvbEoyS0YzUT0=$9A4hF_YAuvQ5obgVAqNKPCYcEjKensW4IQMovwHtwkF4VYPoHbKxJw!! (accessed on 10 May 2017).
- Perdew, J.P.; Burke, K.; Ernzerhof, M. Generalized gradient approximation made simple. Phys. Rev. Lett. 1996, 77, 3865–3968. [Google Scholar] [CrossRef] [PubMed]
- Wu, Z.G.; Cohen, R.E. More accurate generalized gradient approximation for solids. Phys. Rev. B 2006, 73, 235116. [Google Scholar] [CrossRef]
- Hamann, D.R.; Schlüter, M.; Chiang, C. Norm-conserving pseudopotentials. Phys. Rev. Lett. 1979, 43, 1494–1497. [Google Scholar] [CrossRef]
- Segall, M.D.; Lindan, P.J.D.; Probert, M.J.; Pickard, C.J.; Hasnip, P.J.; Clark, S.J.; Payne, M.C. First-principles simulation: Ideas, illustrations and the CASTEP code. J. Phys. Condens. Matter 2002, 14, 2717. [Google Scholar] [CrossRef]
- Clark, S.J.; Segall, M.D.; Pickard, C.J.; Hasnip, P.J.; Probert, M.J.; Refson, K.; Payne, M.C. First principles methods using CASTEP. Z. Kristallogr. 2005, 220, 567–570. [Google Scholar] [CrossRef] [Green Version]
- Troullier, N.; Martins, J.L. Efficient pseudopotentials for plane-wave calculations. Phys. Rev. B 1991, 43, 1993–2006. [Google Scholar] [CrossRef]
- Lee, T.J.; Jayatilaka, D. An open-shell restricted Hartree-Fock perturbation theory based on symmetric spin orbitals. Chem. Phys. Lett. 1993, 201, 1–10. [Google Scholar] [CrossRef]
- Nowak, M.; Rostkowska, H.; Lapinski, L.; Kwiatkowski, J.S.; Leszczynski, J. Experimental matrix isolation and theoretical ab initio HF/6-31G (d, p) studies of infrared spectra of purine, adenine and 2-chloroadenine. Spectrochim. Acta Part A Mol. Spectrosc. 1994, 50, 1081–1094. [Google Scholar] [CrossRef]
- Momma, K.; Izumi, F. VESTA 3 for three-dimensional visualization of crystal, volumetric and morphology data. J. Appl. Crystallogr. 2011, 44, 1272–1276. [Google Scholar] [CrossRef]
- Smrčok, L’.; Kucharík, M.; Tovar, M.; Žižak, I. High temperature powder diffraction and solid state DFT study of β-cryolite (Na3AlF6). Cryst. Res. Technol. 2009, 44, 834–840. [Google Scholar] [CrossRef]
- Picard, G.S.; Bouyer, F.C.; Leroy, M.; Bertaud, Y.; Bouvet, S. Structures of oxyfluoroaluminates in molten cryolite-alumina mixtures investigated by DFT-based calculations. Theochem. J. Mol. Struct. 1996, 368, 67–80. [Google Scholar] [CrossRef]
- Ma, N.; You, J.L.; Lu, L.M.; Wang, J.; Wang, M.; Wan, S.M. Micro-structure studies of the molten binary K3AlF6-Al2O3 system by in situ high temperature Raman spectroscopy and theoretical simulation. Inorg. Chem. Front. 2018, 5, 1861–1868. [Google Scholar] [CrossRef]
- Machado, K.; Zanghi, D.; Kanian, V.S.; Cadars, S.; Burbano, M.; Salanne, M.; Bessada, C. Study of NaF-AlF3 melts by coupling molecular dynamics, density functional theory and NMR measurements. J. Phys. Chem. C 2017, 121, 10289–10297. [Google Scholar] [CrossRef]
- Cikit, S.; Akdeniz, Z.; Madden, P.A. Structure and Raman spectra in cryolitic melts: Simulations with an ab initio interaction potential. J. Phys. Chem. B 2014, 118, 1064–1070. [Google Scholar] [CrossRef] [PubMed]
- Hay, P.J.; Wadt, W.R. Ab initio effective core potentials for molecular calculations. Potentials for K to Au including the outermost core orbitals. J. Chem. Phys. 1985, 82, 299–310. [Google Scholar] [CrossRef]
- Wadt, W.R.; Hay, P.J. Ab initio effective core potentials for molecular calculations. Potentials for main group elements Na to Bi. J. Chem. Phys. 1985, 82, 284–298. [Google Scholar] [CrossRef]
- You, J.L.; Jiang, G.C.; Hou, H.Y.; Chen, H.; Wu, Y.Q.; Xu, K.D. Quantum chemistry study on superstructure and Raman spectra of binary sodium silicates. J. Raman Spectrosc. 2005, 36, 237–249. [Google Scholar] [CrossRef]
- Scott, A.P.; Radom, L. Harmonic vibrational frequencies: An evaluation of Hartree-Fock, Møller-Plesset, quadratic configuration interaction, density functional theory, and semiempirical scale factors. J. Phys. Chem. 1996, 100, 16502–16513. [Google Scholar] [CrossRef]
- Robert, E.; Olsen, J.E.; Danek, V.; Tixhon, E.; Østvold, T.; Gilbert, B. Structure and thermodynamics of alkali fluoride-aluminum fluoride-alumina melts. Vapor pressure, solubility, and Raman spectroscopic studies. J. Phys. Chem. B 1997, 101, 9447–9457. [Google Scholar] [CrossRef]
- Robert, E.; Gilbert, B. Raman spectroscopy study of molten MxAlF3+x-M′xAlF3+x Systems (M, M′= Li, Na, K). Appl. Spectrosc. 2000, 54, 396–401. [Google Scholar] [CrossRef]
- Hu, X.W.; Qu, J.Y.; Gao, B.L.; Shi, Z.N.; Liu, F.G.; Wang, Z.W. Raman spectroscopy and ionic structure of Na3AlF6-Al2O3 melts. Trans. Nonferr. Met. Soc. China 2011, 21, 402–406. [Google Scholar] [CrossRef]
Figure 1.
Room temperature XRD pattern of the synthesized KAlF4 compound. The PDF card No.77-2210 was obtained from the JCPD (Joint Committee for Powder Diffraction Standards) database for synthetic KAlF4.
Figure 1.
Room temperature XRD pattern of the synthesized KAlF4 compound. The PDF card No.77-2210 was obtained from the JCPD (Joint Committee for Powder Diffraction Standards) database for synthetic KAlF4.

Figure 2.
The unit cell structure of the room temperature KAlF4 crystal. The purple balls represent the K atoms while the dark cyan octahedral structures represent the [AlF6]3− octahedra.
Figure 2.
The unit cell structure of the room temperature KAlF4 crystal. The purple balls represent the K atoms while the dark cyan octahedral structures represent the [AlF6]3− octahedra.

Figure 3.
The room temperature Raman spectrum of the KAlF4 crystal is compared with the calculated (using CASTEP) followed by a Raman shift correction with a factor of k1 = 0.000426x + 0.80 and the Lorentzian smearing is 10 cm−1.
Figure 3.
The room temperature Raman spectrum of the KAlF4 crystal is compared with the calculated (using CASTEP) followed by a Raman shift correction with a factor of k1 = 0.000426x + 0.80 and the Lorentzian smearing is 10 cm−1.

Figure 4.
Temperature dependent X-ray diffraction spectra collected from room temperature up to 823 K for the synthesized KAlF4 compound. No.77-2210 and 77-2211 were obtained from the JCPD (Joint Committee for Powder Diffraction Standards) database for the tetragonal and monoclinic KAlF4 unit cell structures, respectively.

Figure 5.
The unit cell structure of high temperature phase of KAlF4. The purple balls represent K ions, while the dark cyan octahedral structures represent [AlF6]3− octahedra.
Figure 5.
The unit cell structure of high temperature phase of KAlF4. The purple balls represent K ions, while the dark cyan octahedral structures represent [AlF6]3− octahedra.

Figure 6.
The Raman spectrum of the high temperature phase of KAlF4 calculated by CASTEP (using a Raman shift correction with a factor of k2 = −0.000835x + 1.41) and the experimental Raman spectrum of the same phase at 773K. The Lorentzian smearing is 40 cm−1.
Figure 6.
The Raman spectrum of the high temperature phase of KAlF4 calculated by CASTEP (using a Raman shift correction with a factor of k2 = −0.000835x + 1.41) and the experimental Raman spectrum of the same phase at 773K. The Lorentzian smearing is 40 cm−1.

Figure 7.
Temperature dependent Raman spectra of KAlF4 and the Raman spectra calculated by DFT and an ab initio method. The value of n is equal to 7 in the calculated [AlF4]−n by ab initio. The calculated [AlF6]3−n by ab initio is referred by our previous work [28].
Figure 7.
Temperature dependent Raman spectra of KAlF4 and the Raman spectra calculated by DFT and an ab initio method. The value of n is equal to 7 in the calculated [AlF4]−n by ab initio. The calculated [AlF6]3−n by ab initio is referred by our previous work [28].

Figure 8.
Intermediate KAlF4 structure as it evolves from the room temperature to high temperature structure.
Figure 8.
Intermediate KAlF4 structure as it evolves from the room temperature to high temperature structure.

Figure 9.
Model clusters used for quantum chemistry ab initio methods: [AlF4]− denotes an ionic molecule consisting of a four-coordinated Al atom and four F atoms while n (=1,2,3,4) stands for the number of [AlF4]− molecules in the clusters. The purple, beige and cyan balls represent K, Al and F atoms, respectively. The spatial configurations of the central atoms of [AlF4]− in the cluster are point, linear, triangular and tetrahedronal respectively from n = 1 to 4.

Figure 10.
Calculated Raman spectra of various model clusters (shown in Figure 9), corrected for frequency shift with a factor of 0.90, and experimental spectrum of molten KAlF4 (Spectrum A).
Figure 10.
Calculated Raman spectra of various model clusters (shown in Figure 9), corrected for frequency shift with a factor of 0.90, and experimental spectrum of molten KAlF4 (Spectrum A).

Figure 11.
Calculated characteristic Raman wavenumber of Al-F symmetric stretching vibrational modes as a function of log n (the number of molecules in [AlF4]−n cluster). The reference point A in the figure represents the experimental characteristic wavenumber of molten KAlF4.
Figure 11.
Calculated characteristic Raman wavenumber of Al-F symmetric stretching vibrational modes as a function of log n (the number of molecules in [AlF4]−n cluster). The reference point A in the figure represents the experimental characteristic wavenumber of molten KAlF4.


Table 1.
The assignment of major room temperature vibration modes of crystalline KAlF4.
| Wavenumber | Vibrational Modes | Type of Vibration | |
|---|---|---|---|
| υexp (cm−1) | υcal (cm−1) | ||
| 228 | 227.6 | Eg | γ (AlVI-Fnb) 1 |
| 547 | 547.4 | A1g | υs (AlVI-Fnb) 1 |
1 γ and υ represent the shearing and stretching vibrations, respectively. Subscript s represents the symmetric vibration. AlVI denotes a six-coordinated Al atom.
Table 2.
The assignment of major vibration modes of high temperature phase of KAlF4.
| Wavenumber | Vibrational Modes | Type of Vibration | |
|---|---|---|---|
| υexp (cm−1) | υcal (cm−1) | ||
| 229 | 193.9 | Bg | γ (AlVI-Fnb) 1 |
| 319 | 335.9 | Ag | γ (AlVI-Fnb) 1 |
| 481 | 474.5 | Ag | γ (AlVI-Fnb) 1 |
| 539 | 539.5 | Ag | υs (AlVI-Fnb) 1 |
1 γ and υ represent the shearing and stretching vibrations, respectively. Subscript s represents the symmetric vibration. AlVI denotes a six-coordinated Al atom.
Table 3.
Structure parameters of room and high temperature phases of KAlF4.
| Parameter | Compound | ||
|---|---|---|---|
| Room Temperature Phase | High Temperature Phase | ||
| Crystal System | tetragonal | monoclinic | |
| Space Group | P4/mbm | P21/m | |
| Cell Length/Å | a | 5.122 | 6.542 |
| b | 5.122 | 7.195 | |
| c | 6.288 | 7.177 | |
| Cell Angle/° | α | 90.000 | 90.000 |
| β | 90.000 | 108.478 | |
| γ | 90.000 | 90.000 | |
| Bond Length/Å | AlVI-Fb | 1.733 | 1.829, 1.800 |
| AlVI-Fnb | 1.674 | 1.769, 1.768 | |
| Bond Angle/° | ∠Fb-AlVI-Fb | 90.000 | 89.307, 90.693, 90.307, 89.693 |
| ∠Fb-AlVI-Fnb | 90.000 | 90.958, 91.871, 88.129, 89.042, 91.204, 92.520, 87.480, 88.796 | |
| ∠AlVI-Fb-AlVI | 167.476 | 170.788(2), 159.189, 158.912 | |
Table 4.
Calculated, experimental and reported Raman wavenumber of [AlF4]− clusters.
| Clusters | Wavenumber (cm−1) | ||||||||
|---|---|---|---|---|---|---|---|---|---|
| Number of Molecules | Exp. | Ref. 10 (Cal.) | Ref. 35 (Exp.) | ||||||
| 1 | 2 | 3 | 4 | … | n = 7 | ||||
| [AlF4]−n | 597.0 | 610.3 | 615.3 | 615.4 | … | 625.6 | 628 | 631 | 622 |
© 2018 by the authors. Licensee MDPI, Basel, Switzerland. This article is an open access article distributed under the terms and conditions of the Creative Commons Attribution (CC BY) license (http://creativecommons.org/licenses/by/4.0/).
Share and Cite
MDPI and ACS Style
Ma, N.; You, J.; Lu, L.; Wang, J.; Wan, S. Temperature Dependent Micro-Structure of KAlF4 from Solid to Molten States. Materials 2018, 11, 1846. https://doi.org/10.3390/ma11101846
AMA Style
Ma N, You J, Lu L, Wang J, Wan S. Temperature Dependent Micro-Structure of KAlF4 from Solid to Molten States. Materials. 2018; 11(10):1846. https://doi.org/10.3390/ma11101846
Chicago/Turabian StyleMa, Nan, Jinglin You, Liming Lu, Jian Wang, and Songming Wan. 2018. "Temperature Dependent Micro-Structure of KAlF4 from Solid to Molten States" Materials 11, no. 10: 1846. https://doi.org/10.3390/ma11101846
Note that from the first issue of 2016, this journal uses article numbers instead of page numbers. See further details here.