Simple Assessment of Temperate Grassland Suitability as Habitat for Three Insect Taxa
 Bertrand Dumont1*
  Nicolas Rossignol1,2
  Olivier Huguenin-Elie3
  Philippe Jeanneret4
  Jana Sabrina Jerrentrup5
  Gisela Lüscher4 Simon Taugourdeau2,3,6 Jean Villerd2 Sylvain Plantureux2
- 1Université Clermont Auvergne, INRAE, VetAgro Sup, UMR 1213 Herbivores, Saint-Genés-Champanelle, France
- 2Université de Lorraine-INRAE, UMR 1121 LAE, Vandoeuvre-Les-Nancy, France
- 3Agroscope, Forage Production and Grassland Systems, Zürich, Switzerland
- 4Agroscope, Agroecology and Environment, Zürich, Switzerland
- 5Department of Crop Sciences, Grassland Science, Georg-August-Universität Göttingen, Göttingen, Germany
- 6Université de Montpellier, INRAE Supagro, CIRAD, UMR SELMET, Montpellier, France
We propose a set of indicators to evaluate how grazing by livestock and grassland management can help preserve biodiversity in the insect communities of grassland ecosystems. These indicators can be calculated for any grassland for which management and botanical composition are known, and they do not require advanced knowledge on conservation biology and entomology. Based on the scientific literature and expert interviews, each indicator combines pressure (i.e., 16 management classes) and state variables (i.e., sward botanical composition and several of the plant functional characteristics) to assess the effects on butterfly, bumblebee, and grasshopper abundance and species richness. Each indicator was based on a multicriteria decision tree with fuzzy partitioning to account for uncertainty in the threshold values between different alternatives. The output validation of indicators was performed by comparing decision tree output with standardized measurements from 10 surveys across France, Germany, Switzerland, Wales, and Italy. The prediction of grassland suitability for butterflies was more accurate for butterfly species richness (P < 0.05) than for butterfly abundance (P = 0.10), as even under standardized transect counts, recorders will observe disproportionately more individuals when it is sunny and warm. The sensitivity of the butterfly species richness indicator was then tested using an independent dataset of 395 French grasslands. There were significant differences in predicted species richness (χ215 = 121.16; P < 0.05) among the 16 management classes, and they were ranked consistently in spite of very parsimonious assumptions in the decision tree. The prediction of grassland suitability was good for bumblebee abundance (P < 0.05) and species richness (P < 0.01). This prediction was also successful for grasshopper abundance (P < 0.05) and species richness (P = 0.05), all outliers coming from a highly diverse grassland community located on shallow soil in the Italian survey. This set of indicators can thus provide a cost-effective evaluation of temperate grassland suitability as habitat for three insect taxa. These indicators have more relevance than general insect species richness, and their application does not require any entomological skill. The indicators can help stakeholders to make adequate decisions for insect conservation in grassland ecosystems, but do not have direct applicability to higher conservation value taxa or species.
Introduction
During recent decades, a global loss of earth biodiversity has been obvious (Butchart et al., 2010; IPBES, 2019), and grassland-based landscapes, which cover 32% of the EU-wide agricultural area according to Eurostat 2010 (Dumont et al., 2019), have not escaped this trend (Brambilla et al., 2021). Insects are particularly affected in Europe (Hallmann et al., 2017; Powney et al., 2019), as illustrated by the 67% decline in arthropod biomass and the 34% decline in their species richness that was reported in German grasslands between 2008 and 2017 (Seibold et al., 2019). Permanent grasslands are valuable habitats for various forms of biodiversity, while temporary grasslands also contribute to sustaining biodiversity in crop/non-crop mosaics (Dumont et al., 2019). Grassland intensification, abandonment, and landscape homogenization are major drivers of biodiversity loss in grasslands (Gaujour et al., 2012; Gossner et al., 2016; IPBES, 2019). Herbivores play an active role, direct and indirect, in influencing sward structure and composition, so that grazing management impacts the suitability of grassland as habitat for various insect taxa. There is a need for accurate and practical tools to monitor how changes in grazing management impact flora and fauna. Biodiversity recordings are the basic assessments usually used, but they can be difficult to carry out in many programmes due to practical reasons related to cost, time, and lack of expertise. In addition, the consequences of shifts in grassland management should ideally be identified before biodiversity losses occur. Thus, predictive tools (models, indicators) are greatly needed, and their development depends on current knowledge of grassland ecology.
Due to their high sensitivity to habitat and climate conditions, butterflies are relevant indicators for assessing changes in biodiversity (Roy et al., 2015). Grassland butterflies are declining substantially across Europe as a consequence of both agricultural intensification (Van Swaay et al., 2006; Warren et al., 2021) and the effects of climate change on the altitudinal or geographical limits of species ranges (Wilson et al., 2005; Essens et al., 2017). A European Grassland Butterfly Indicator from 16 European countries shows there has been a 39% decline of grassland butterflies between 1990 and 2017 (Warren et al., 2021). As all insect taxa do not respond in the same way to grassland management (WallisDeVries et al., 2007; Marini et al., 2009; Gossner et al., 2016; Milberg et al., 2016; Ravetto Enri et al., 2017; Larkin and Stanley, 2021), it is beneficial to consider several taxa when assessing grassland suitability as habitat for insect conservation. Here, we also consider bumblebees and grasshoppers.
In 1998, the European Environment Agency proposed a strategy for integrated environmental assessment that was based on the DPSIR classification, so called for drivers, pressures, state, impact, and responses (EEA, 1998). The DPSIR framework accounts for the pressures that lead to changes in the state of biodiversity and helps guide the responses undertaken by stakeholders to improve the state of biodiversity. Various indicators have been proposed to monitor losses in biodiversity (SEBI, 2010), including in grassland-based systems. Most of them are state indicators that stress a lack of pressure indicators for grassland biodiversity assessment, despite the large body of scientific literature that addresses relationships between grassland management, plant community structure and insect diversity (Lüscher et al., 2014; Milberg et al., 2016; Bendel et al., 2018; Fumy et al., 2020). A noteworthy exception is the LUI (Land Use Intensity) index, which combines the levels of fertilization, mowing and grazing into a single continuous and standardized index and helps researchers to assess the effects of varying land use intensity on grassland biodiversity and ecosystem functioning (Blüthgen et al., 2012).
The novelty of our approach is that we (1) combine pressure (i.e., management) and state variables (i.e., sward botanical composition) into a composite indicator and (2) use a decision tree approach to design indicators as accurately as possible from the minimum number of variables that are usually available to final users, which typically are management and vegetation data. Indeed, vegetation communities with contrasting botanical composition can develop under similar management practices (Michaud et al., 2012; Dainese et al., 2015); however, management practices impact insect communities through their effect on sward structure, and this sometimes occurs independently of sward composition (Humbert et al., 2010; Bendel et al., 2018). In the first part of the paper, we described the methodology we used to build indicators. In the second part, we conducted output validation of these indicators using 10 datasets from grassland surveys across France, Germany, Switzerland, Wales, and Italy. Finally, we illustrated the sensitivity of one of the indicators (butterfly species richness) by calculating it using an independent set of 395 French grasslands. This calculation enables us to discuss the advantages and limitations of our methodology.
Materials and Methods
Sward Variables Affecting Insect Diversity
We built indicators of grassland type suitability as habitat for butterflies, bumblebees, and grasshoppers using information from the scientific literature and expert interviews. Grassland management is known to have a strong impact on insect abundance and species richness; therefore, management had an important weight in our indicators. Management was defined according to the defoliation regime (cutting, grazing, or mixed) and the intensity of defoliation, soil fertility, and timing of the defoliation regime. Soil fertility was estimated from fertilizer application, and we used a 50 kg.ha−1.year−1 threshold for mineral and organic fertilization to differentiate between low and high fertility. We proposed 16 management types (Table 1) that can be easily identified by researchers or stakeholders in most situations. The effect of each management type on butterflies, bumblebees and grasshoppers was evaluated through their effect on sward surface height and sward height variability.
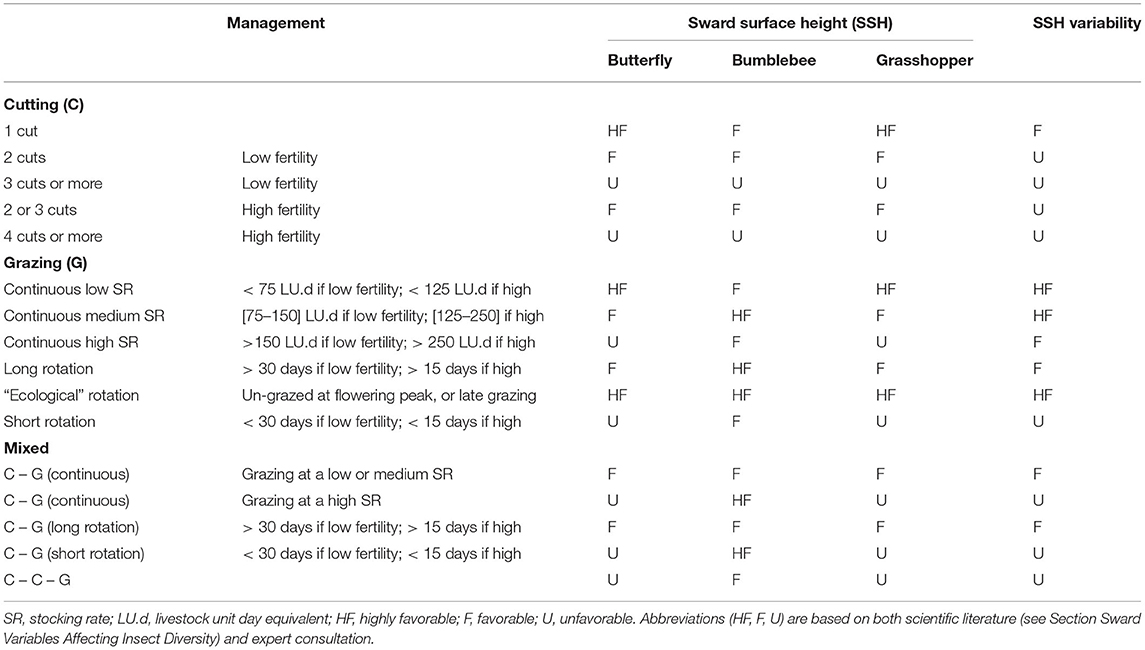
Table 1. Effect of management practices on the suitability of grassland types as habitat for butterflies, bumblebees, and grasshoppers, via the effects of management on sward structure (i.e., sward surface height and variability).
Sward surface height (SSH) is indeed crucial for butterflies and grasshoppers, as biomass accumulation provides them with more food resources, as well as suitable shelters and favorable microclimates. Butterfly abundance and species richness have been positively correlated with vegetation height (Kruess and Tscharntke, 2002; Pöyry et al., 2006; Sjödin et al., 2008; Scohier et al., 2013; Larkin and Stanley, 2021). In addition, sward height variability is likely to benefit butterfly diversity because (1) butterfly assemblages vary according to vegetation height (Pöyry et al., 2006; Sjödin et al., 2008; Jerrentrup et al., 2014; Van Halder et al., 2017), and (2) some species require short and tall vegetation at different stages of their developmental cycle (Dennis, 2004; WallisDeVries, 2004). For grasshoppers, Marini et al. (2009) concluded that sward structure was more important than food quality in managed grasslands. Grasshopper species richness has been positively correlated with sward height variability (Kruess and Tscharntke, 2002; Fumy et al., 2020), and there are some well-documented surveys of grasshopper species relying on a mosaic of short and tall patches at different stages of their developmental cycle (Cherril and Brown, 1992; Willott, 1997). Grasshopper abundance is also usually higher in tall and extensively managed swards (WallisDeVries et al., 2007; Marini et al., 2008, 2009; Dumont et al., 2009; Kati et al., 2012; Fleurance et al., 2016).
Bumblebees were assumed to respond differently to SSH since many bumblebee species have a habitat preference for open grasslands (Williams and Osborne, 2009). However, contrasting sward height preferences have been reported for different bumblebee species (Carvell, 2002; Sjödin, 2007), which suggests there is a benefit of increasing sward height variability on bumblebee species richness (Scohier et al., 2013; Ravetto Enri et al., 2017). SSH is also a driver of bumblebee abundance since keeping grass short severely affects the survival of surface nests. Members of Bombus pascorum that nest among grass more than other species preferentially used tall grasses rather than patches where grass was frequently defoliated (Fussell and Corbet, 1992). The litter must also not be too thick so that bumblebees can dig their nests (Carvell, 2002).
Beyond the effects of sward structure on insect communities, sward botanical composition is crucial for flower-visiting insects (Berg et al., 2019). Butterfly species richness has been shown to be positively correlated with plant species richness (Öckinger et al., 2006; Skórka et al., 2007; Marini et al., 2009). Grasslands with higher plant species richness indeed provide host plants for more butterfly species and offer a nectar source that is better distributed in time compared to species-poor grasslands. This is assumed to benefit a significant part of butterfly assemblages (Jeanneret et al., 2003a,b; Van Halder et al., 2017). Dry and nutrient-poor grasslands belong to the most species-rich habitats for butterflies and especially for endangered ones in Europe (Van Swaay et al., 2006) suggesting that site temperature and nutrient status influence butterfly species richness. However, some of these relationships differ across European biogeographical areas and were therefore not considered. One example is temperature, which is usually positively correlated to butterfly populations (e.g., in Britain; Turner et al., 1987), while butterfly species richness was negatively correlated with temperature in Catalonia (Stefanescu et al., 2004). Butterfly abundance has been consistently positively related to the abundance of plants providing nectar across Europe (Bergman et al., 2008; Farruggia et al., 2012; Scohier et al., 2013; Jerrentrup et al., 2014). Alison et al. (2021) recently confirmed this positive relationship, while pointing out the saturating benefit of flower cover on butterfly abundance. Habitat characteristics influencing the abundance, foraging activity and species richness of bumblebees also include the diversity and abundance of flowering plant species (Carvell, 2002; Walcher et al., 2019; Larkin and Stanley, 2021; Phelan et al., 2021). Legumes appear to be the major pollen source for most bumblebee species (Goulson et al., 2005; Williams and Osborne, 2009; Scohier et al., 2013; Marja et al., 2021); thus, legumes strongly affect bumblebee abundance. Other entomophilous plant species such as Centaurea and Cirsium spp. were also reported as a key pollen source for bumblebees (Scohier et al., 2013; Marja et al., 2021; Phelan et al., 2021).
Finally, Walcher et al. (2019) found a significant positive correlation between Orthoptera and vascular plant species richness in semi-natural grasslands of the Austrian Alps. Additionally, Kati et al. (2012) concluded that low disturbance intensity, as well as plant species richness, predict grasshopper species richness in humid Mediterranean grasslands. They even suggested the use of grasshoppers as surrogates for vascular plants and vice-versa, given their congruent species richness patterns. Tall and dense swards may lead to lower temperatures in the egg environment, which can negatively affect thermophilous species and therefore Orthoptera abundance (Van Wingerden et al., 1991; Gardiner, 2006). The Ellenberg temperature index was thus also used as variable for evaluating effects on grasshopper species richness and abundance.
This literature review, together with expert interviews, was used for assessing the relative weight of each variable used in multicriteria decision trees as described in the following section.
Indicator Setting
Our composite indicators were based on decision trees created with fuzzy inference software called FisPro (Guillaume and Charnomordic, 2011). FisPro allows for the creation of a decision tree in which each node is a fuzzy inference system (Guillaume and Charnomordic, 2012). Fuzzy partitioning makes it possible to account for uncertainty in the choice of threshold values between the different alternatives (Figure 1). In fuzzy logic, there is a continuous evolution between truth and falsity, which makes a more precise assessment possible compared to the classical logic, where propositions such as “butterfly abundance is low” or “butterfly abundance is high” are either true or false according to a threshold value. Fuzzy logic defines membership functions in order to map continuous variables into classes such as “high” and “low.” Therefore, each abundance level has a degree of membership to both the “high” and “low” classes. The membership function shape can be parametrized based on existing knowledge, and a linear relationship is usually chosen when no information is available. This method softens the transition between classes compared to classical logic. The mapping between input and output variables is encoded through a set of decision rules, which can include rules such as “if input1 is low and input2 is low, then output is low” or “if input1 is high and input2 is low, then output is high.” Since input1 belongs to both the low and high classes, and has a given degree of membership for each, both decision rules are triggered and are weighted by the input1 and input2 membership degrees. As a result, the output includes a membership degree for each output classes. A final step, called defuzzification, transforms these membership degrees into a single numerical value (Suárez and Lutsko, 1999; see Figure 1).
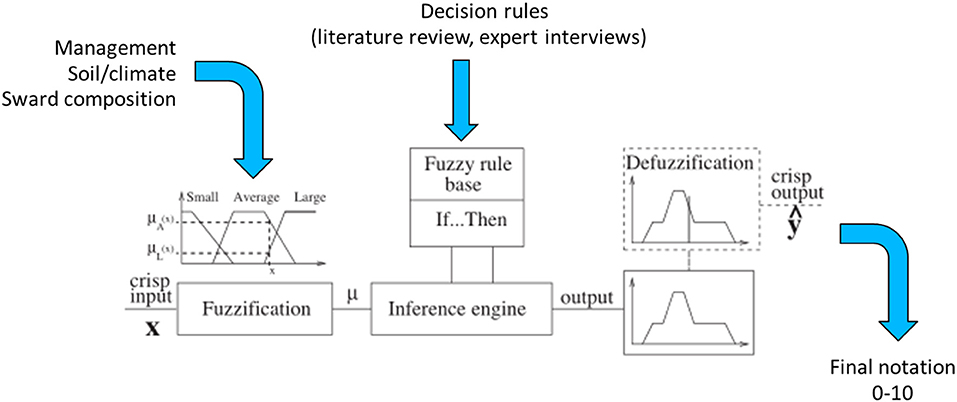
Figure 1. Components of a fuzzy inference system (adapted from Suárez and Lutsko, 1999).
Hierarchical decision trees are based on cause-effect relationships and, therefore, allow the implementation of several key components and hierarchical steps; each node corresponds to one of the key components, and each branch presents a relationship between two key components. The different nodes and hierarchical steps provide structure to implement the input, intermediate and output variables. The example reported in Table 2 details how bumblebee species richness was predicted. According to Section Sward Variables Affecting Insect Diversity, bumblebee species richness was assumed to rely equally on two criteria: species richness of entomophilous plants and variability in SSH. The result of the decision trees was a rough membership degree of the three classes, i.e., unfavorable, favorable, or highly favorable to bumblebee species richness. After the defuzzification process performed by FisPro (Figure 1), these discrete categories were transformed into a continuous value between 0 (null) and 10 (excellent habitat value for bumblebees), as shown in Figure 4.
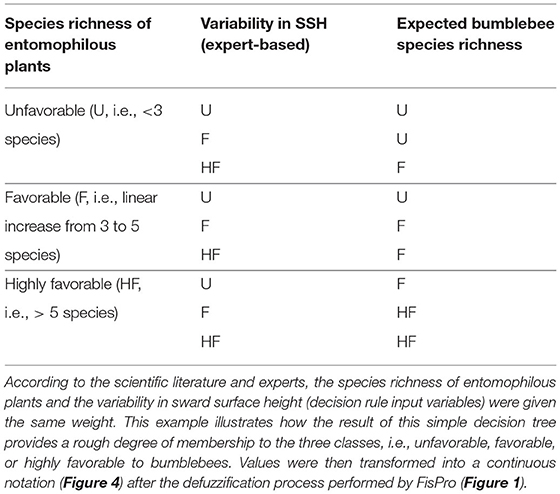
Table 2. Illustration of node calculation for bumblebee species richness (i.e., decision rule result).
Thus, the indicators are based on relatively simple decision trees that account for key variables that affect the abundance and species richness of each of the three insect taxa, as reviewed in Section Sward Variables Affecting Insect Diversity. The relative weight of each node was based on the literature review rather than on the correlative relationships between vegetation and insect assemblages that have been quantified in other articles (e.g., Jeanneret et al., 2003a; Bergman et al., 2008); such correlative relationships were considered too site-specific and can differ across sites (e.g., how temperature affects butterfly species richness: Turner et al., 1987; Stefanescu et al., 2004). The search for parsimony led us to suppress some variables from the decision trees using an iterative process; this was deemed acceptable as long as tree predictive power was not degraded. The calculation of indicators (Tables 2–5) requires three types of information: (1) information on grassland management (e.g., livestock unit per ha, number of cuts, general level of fertilization), (2) information from the floristic surveys (e.g., plant species richness, legume abundance) and (3) information calculated from the survey (e.g., abundance and species richness of entomophilous species, Ellenberg Temperature Index). Consulting the eFLORAsys database (http://www.eflorasys.univ-lorraine.fr) makes it possible to determine for each species, its Ellenberg temperature index, and whether or not it is entomophilous species. The Ellenberg index is calculated by taking the average of the values of the indices of the species present.
Parameter files and instructions (see README.txt file) for the effective computation of the indicators using FisPro are available online at https://doi.org/10.15454/A7KNLK (Dumont et al., 2022). This requires a complete list of plant species and an estimation of the weight contribution of each species at the plot level.
Indicator Validation
According to Bockstaller and Girardin (2003), there are three different ways to validate an indicator: the “design validation” is used to evaluate if an indicator is scientifically sound, the “output validation” is used to assess the soundness of the indicator outputs, and the “end-use validation” is used to ensure that the indicator can be used as a decision tool. Design validation requires the assessment of the scientific quality of indicator construction. In our case, the construction of multicriteria decision trees was based on the literature review and additional expert interviews. It required frequent feedbacks in order to identify variables that did not influence the decision-tree outputs after they were run using a set of experimental data. In this case, specific papers pointing out the effect of such variables were read again to re-evaluate any misleading interpretation and to reassess the variable weight in the decision tree.
Most of the validation process was based on the soundness of indicator output, or the so called “output validation.” The outputs from the decision trees were then compared to experimental data from the five following projects:
- EU FP5 project Forbioben, which investigated the effects of grazing intensity and livestock breed (cattle and sheep) on pasture biodiversity, including butterflies and grasshoppers, over 3 years (WallisDeVries et al., 2007; Dumont et al., 2009). We used data from the Solling uplands in Germany (dots Study 1; S1), the Pordenone foothills in northern Italy (S2) and the French Auvergne uplands (S3).
- EU FP7 project BioBio, which identified a set of biodiversity indicators over a range of low-input and organic farming systems (http://www.biobio-indicator.org/; Lüscher et al., 2014). We used butterfly data recorded from 1 year in grassland-based farms in central Switzerland (S4) and bumblebee data recorded from Switzerland (S4) and Wales (S9).
- Four years of rotational and continuous stocking was compared in Auvergne uplands in cattle-grazed plots (S5; Farruggia et al., 2012), and 2 years of data were used in sheep-grazed plots (S6; Scohier et al., 2013). Additional data came from measurements made during the EU FP7 project MultiSward (S7; Ravetto Enri et al., 2017). We used butterfly data from these three surveys and bumblebee data from the last two surveys.
- Project Biomix led by Göttingen University (Germany), which investigated the effects of livestock species (sheep vs. cattle) and the artificial removal of legumes and forbs on the diversity of mesotrophic grasslands (Jerrentrup et al., 2015). We used butterfly and grasshopper data recorded over 2 years (S8).
- Research-development project Indibio led by Idele and Lorraine University (France), which investigated the joint effects of pasture management and agroecological landscape features from 36 grassland-based farms from three regions: Normandy, Auvergne, Champagne-Ardennes and Vosges. We used bumblebee data recorded over one grazing season (S10).
Discrepancies between datasets were solved by selecting surveys that used the same protocol; all adult insects were counted using “Pollard walks” along 50-m-long transects under good weather conditions (Pollard and Yates, 1993). The overall sampling effort varied across experimental sites; there were either two or three transects per paddock, and the number of measurement days between April and September was up to 10 days per year. Standardized abundances were obtained by selecting the subset of data within the 3 months that had the highest recorded abundance (usually June-August). Minimum of counts during this period was for grasshoppers in S3 that were only recorded on two occasions (Dumont et al., 2009), but fewer counts than for butterflies were judged adequate in view of the longer life span of grasshoppers (WallisDeVries et al., 2007). Individual counts were then averaged along each transect in each paddock. Thus, standardized abundance refers to the number of individuals encountered along a 50-m-long transect. Standardized species richness was obtained by calculating Chao estimates from raw observation data (this index extrapolates total species richness by estimating the number of unseen species) using the “vegan” package for R (Oksanen et al., 2013).
Output validation was based on a graphical test that checks whether, after defuzzification, decision trees predict a range of contrasting biodiversity outputs (on the X-axis) and whether these predicted data are consistent with the standardized observed data (on the Y-axis). The observed diversity can be lower than the predicted habitat suitability potential due to unexpected limiting factors (Cade and Noon, 2003), including unfavorable climatic conditions (Turner et al., 1987; Henry et al., 2015). The opposite, i.e., high observed data in poorly rated grasslands, should not be obtained. Although the data we used for output validation came from sound experiments, we did not expect a 1:1 linear relationship between the indicator outputs and observed data. Rather, Mitchell (1997) and Girardin et al. (1999) proposed a graphical test based on a “probability area.” Here, the probability area was defined as the triangle enclosed between the X-axis and a slope line that matched the minimum observed value to an indicator value of 0 and the maximum value to 10. One index point was added to this slope line as an envelope of acceptable prediction risk (see the white area in Figures 2, 4, 5). The probability area is assumed to include at least 95% of the points. By doing this, the probability of rejecting indicator validation (p-value) is estimated from the proportion of points outside the area (Bockstaller and Girardin, 2003).
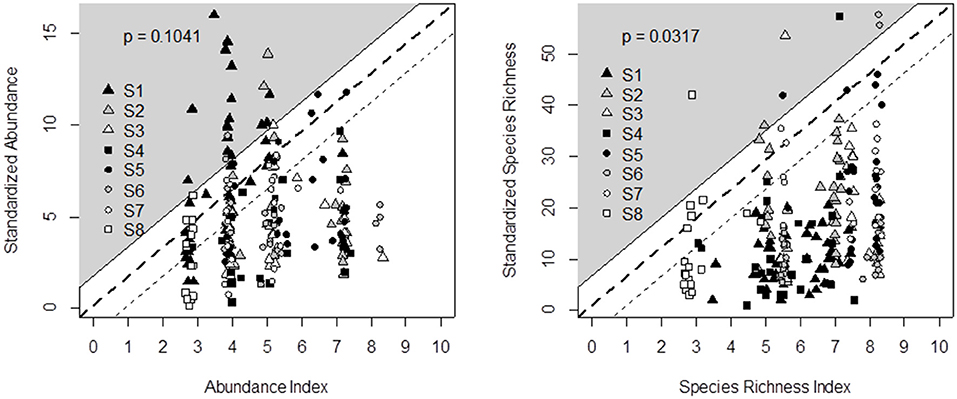
Figure 2. Comparison of decision tree outputs (X-axis) and field data recorded in eight experimental surveys (Y-axis) across Germany (S1, S8), Italy (S2), France (S3, S5, S6, S7), and Switzerland (S4) for butterfly abundance (left) and species richness (right). Percentage of points in the gray area (i.e., outside the output validation triangle) enables defining the probability of rejecting indicator validation (p-value). Since data covered a wide range of temperate grassland conditions, we defined the triangle slope by matching the minimum observed value to an indicator value of 0 and the maximum value to 10. One index point was added to this slope line as an envelope of acceptable prediction risk.
Sensitivity Test of One of the Indicators Using an Independent Dataset
The butterfly species richness indicator was then calculated using an independent dataset of 395 French grasslands; this dataset included a wide range of pedoclimatic conditions and an altitudinal gradient from Atlantic lowlands to upland pastures (see Plantureux and Thorion, 2005; Michaud et al., 2012 for plot location and observation method). This calculation was done to illustrate indicator sensitivity. In the independent dataset, plant species richness ranged from one to 69 species per plot, and grasslands were distributed across the 16 management types reported in Table 1. The differences in indicator values between management types were assessed with a Kruskal-Wallis test followed by a post-hoc test for pairwise comparison (Siegel and Castellan, 1988).
Results
Validation of Butterfly Indicators
Based on the literature review and expert interviews, we propose the decision tree in Table 3 to predict the effects of management and botanical composition on butterfly abundance and species richness. Figure 2 compares the outputs of the butterfly decision tree (i.e., an indicator value ranging from 0 = unfavorable to 10 = highly favorable grassland for butterfly species richness and abundance) after defuzzification (on the X-axis) and the standardization of recorded data from the eight experimental datasets across Germany, France, Switzerland, and Italy (Y-axis). The outputs of the butterfly decision tree fit the observed data for species richness well, since data could be plotted within the triangle-shaped probability area (P < 0.05; Figure 2). The output validation was more difficult for butterfly abundance in spite of the tendency for data to be plotted within the triangle (P = 0.10). Most of the points outside the triangle came from the same survey in Germany.
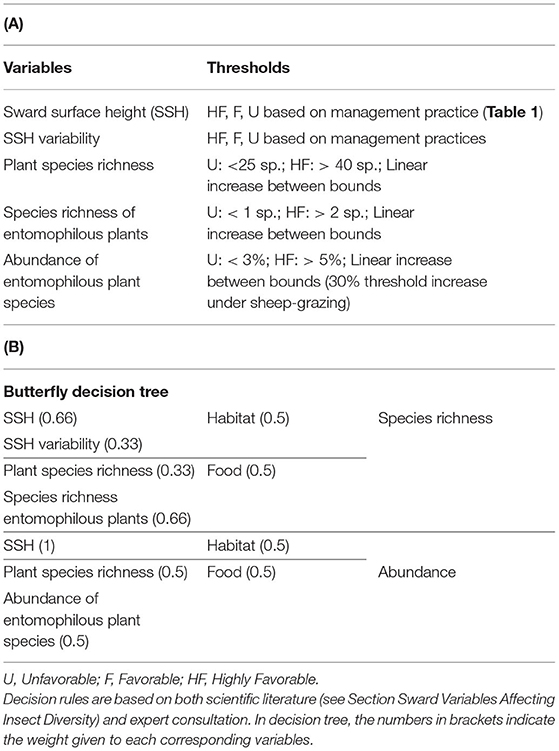
Table 3. (A) Predictive variables, threshold levels and (B) final decision tree of butterfly abundance and species richness.
Sensitivity of Butterfly Species Richness Indicator
The sensitivity test of the butterfly species richness indicator to grassland management using the independent dataset of 395 grasslands detected contrasted suitability of grasslands, with consistent and significant differences (χ215 = 121.16; P < 0.05) among the 16 management classes (Figure 3). In high-yield cut grasslands, the indicator predicts that butterflies would benefit from lowering the cutting frequency, but the median indicator values were not sensitive to the number of cuts in low-yield grasslands (i.e., only variability decreased as the number of cuts increased). Continuously grazed pastures with a lenient stocking rate appeared to be more suitable for butterflies than pastures grazed with a high stocking rate. Conversely, there was no significant effect of the rotation type on the indicator value, which was significantly lower than the effect found in continuously grazed plots with the lowest stocking rate. Additionally, having either one or two cuts before grazing did not affect the indicator value for butterfly species richness. A detrimental effect of management was, however, observed in grasslands that were cut before being rotationally grazed under short rotation, i.e., an intensive management that strongly limited sward heterogeneity.
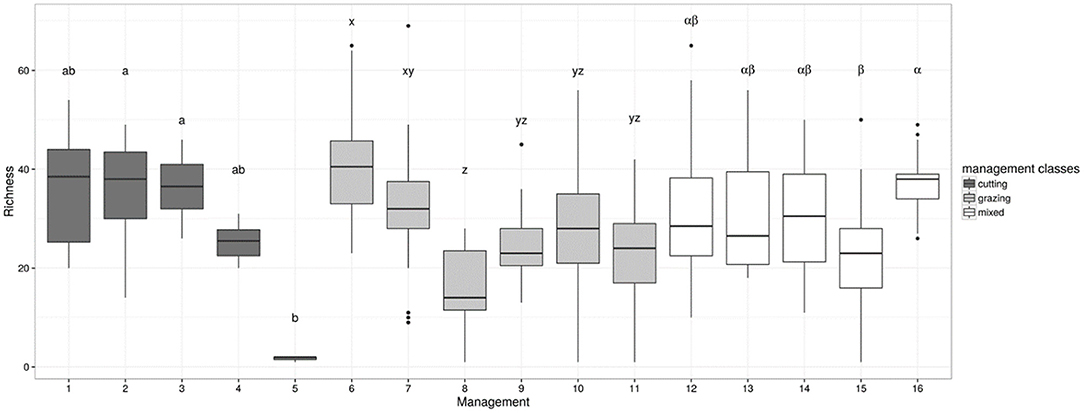
Figure 3. Indicator of grassland suitability for butterflies (species richness index = y-axis) assessed for a set of 395 French grasslands under contrasting management regimes, as described in Table 1, i.e., (1): one cut per year, (2): two cuts per year for low-yield grasslands, (3): three or more cuts per year for low-yield grasslands, (4): two or three cuts per year for high-yield grasslands, (5): four or more cuts per year for high-yield grasslands, (6): continuous grazing at a low stocking rate, (7): continuous grazing at a medium stocking rate, (8): continuous grazing at a high stocking rate, (9): rotational grazing with long rotations, (10): “ecological” rotation with some subplots ungrazed at flowering peak, or late grazing during autumn only, (11): rotational grazing with short rotations, (12): one cut followed by continuous grazing at a low or medium stocking rate, (13): one cut followed by continuous grazing at a high stocking rate, (14): one cut followed by rotational grazing with long rotations, (15): one cut followed by rotational grazing with short rotations, (16): two cuts before grazing. Within each management type, i.e., cutting vs. grazing vs. mixed, means with different letters were significantly different at P < 0.05. Background color of the boxes denotes management classes: cutting (black), grazing (gray), and mixed (white).
Validation of Bumblebee and Grasshopper Indicators
We propose the decision tree from Table 4 to predict the effects of grassland management and botanical composition on bumblebee abundance and species richness. Figure 4 compares the decision tree outputs (indicator value ranging from 0 = unfavorable to 10 = highly favorable grassland for bumblebees) after defuzzification (on the X-axis) and standardization of the data recorded from the five experimental datasets across Wales, France and Switzerland (Y-axis). The outputs of the bumblebee decision tree fit the observed data of bumblebee abundance (P < 0.05) and species richness (P < 0.01), since data could be plotted within the triangle-shaped probability area (Figure 4).
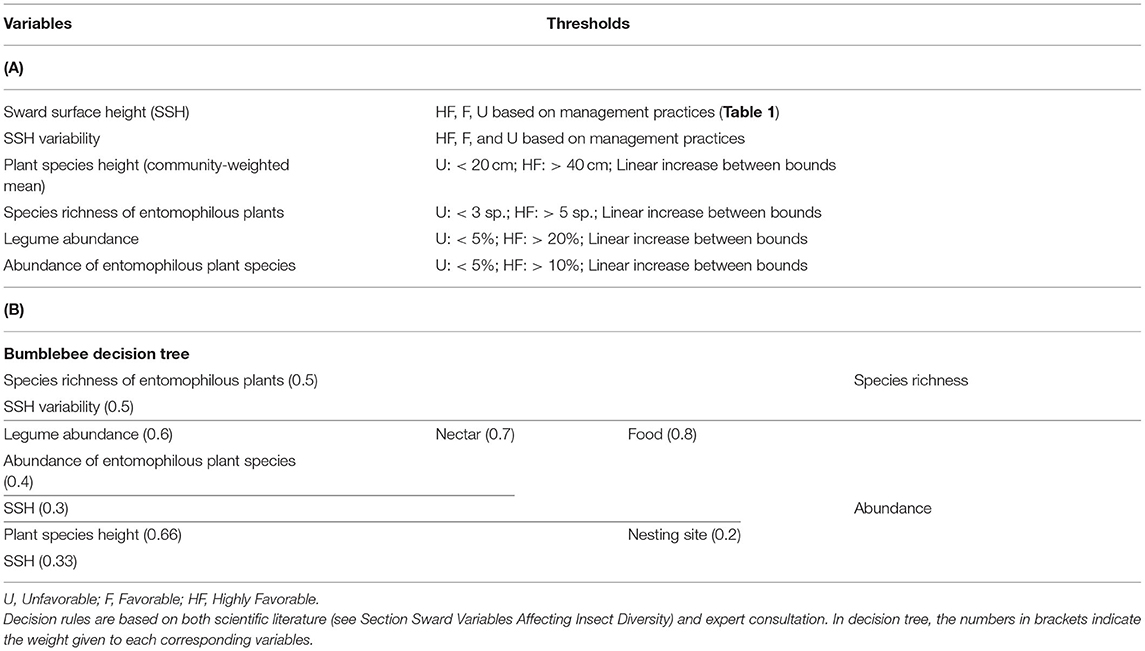
Table 4. (A) Predictive variables, threshold levels and (B) final decision tree of bumblebee abundance and species richness.
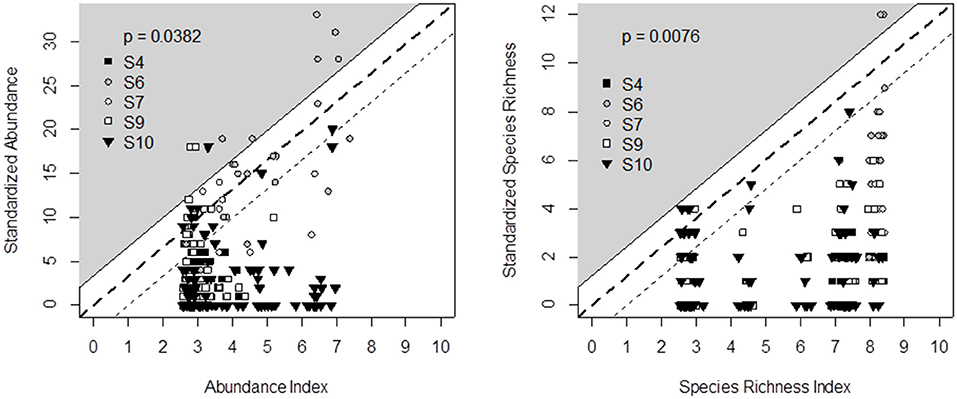
Figure 4. Comparison of decision tree output (X-axis) and field data recorded in five experimental surveys (Y-axis) across Switzerland (S4), France (S6, S7, S10), and Wales (S9) for bumblebee abundance (left) and species richness (right). Principles for defining the triangle-shaped validation area and associated p-values are given in Figure 2.
We propose the decision tree from Table 5 to predict the effects of management and botanical composition on grasshopper abundance and species richness. Figure 5 compares the decision tree outputs (on the X-axis) and standardization of the data recorded from the four experimental datasets across Germany, France and Italy (Y-axis). The outputs of the grasshopper decision tree fit the observed data of grasshopper abundance (P < 0.05) and species richness (P = 0.05), since data could be plotted within the triangle-shaped probability area. All the points outside the triangle came from the same diverse grassland community on shallow soil from the Italian survey. The range of indicator values was also more narrow in the case of grasshopper abundance than in all other cases.
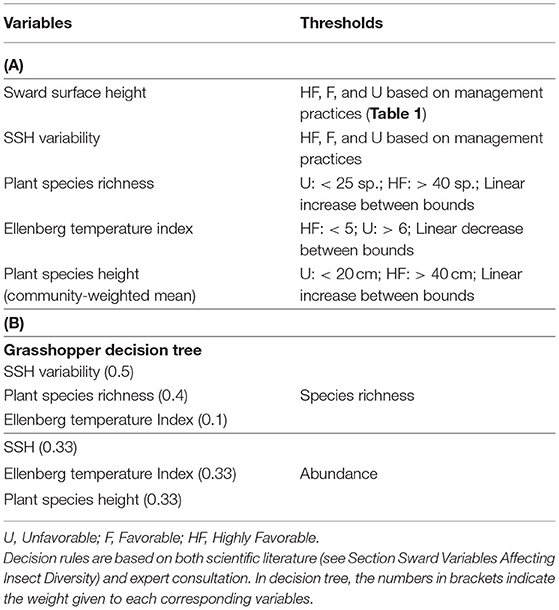
Table 5. (A) Predictive variables, threshold levels, and (B) final decision tree of grasshopper abundance and species richness.
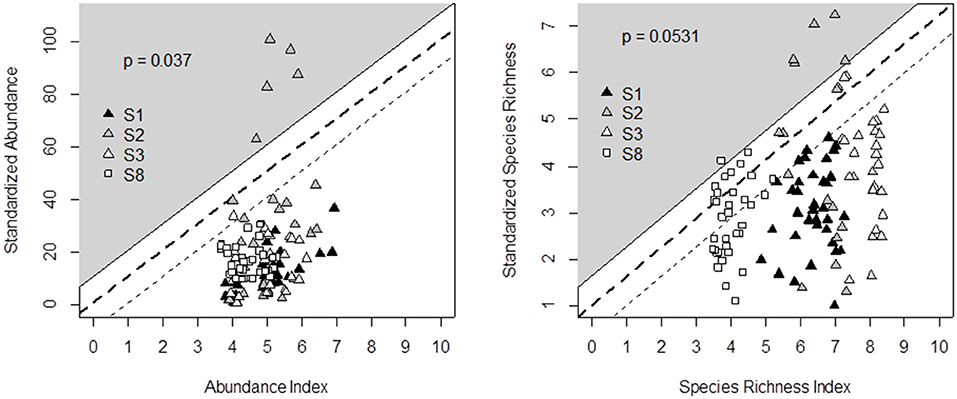
Figure 5. Comparison of decision tree output (X-axis) and field data recorded in four experimental surveys (Y-axis) across Germany (S1, S8), Italy (S2), and France (S3) for grasshopper abundance (left) and species richness (right). Principles for defining the triangle-shaped validation area and associated p-values are given in Figure 2.
Discussion
The prediction of grassland suitability for butterflies (Figures 2, 3), bumblebees (Figure 4), and grasshoppers (Figure 5) could be validated with a diverse dataset in spite of the very parsimonious assumptions used in decision trees. Thus, the proposed indicators allow assessing the habitat value of grasslands for these taxa with reasonable precision and do not require advanced knowledge of conservation biology and entomology. Our methodology is thus a cost-effective approach to assessing a range of biodiversity indicators in experiments or farm surveys as soon as botanical composition measurements have been made and grassland management is known. These indicators can also supply prospective information about the effects of planned changes in management on grassland suitability as habitat for a guild of insects since the three taxa are likely to respond differently to grazing management (see Section Sward Variables Affecting Insect Diversity). This is highly relevant for insect conservation, but these indicators can also be used as proxies for an array of ecosystem services, such as pollination (e.g., bumblebees and, to a lesser extent, butterflies have a key role in pollination), and the aesthetic and recreational value of grassland-based landscapes (e.g., butterfly abundance was used as an indicator of landscape aesthetic by Neyret et al., 2021). Grasshopper assemblages have also been considered as good indicators to measure grassland rehabilitation or conservation success (Alignan et al., 2018; Nakajima and Miyashita, 2021).
However, an indicator is not a model. Indicators contribute to informing decisions but do not intend to precisely predict reality. The fact that there was no 1:1 linear relationship between the indicator value and the observed data was, therefore, not a problem. The output validation was better for species richness than for abundance (Figures 2, 4, 5). This probably results from the greater stability of the effect of management and environmental variables on species richness, while insect abundance can fluctuate according to weather conditions and food resource availability (WallisDeVries et al., 2007; Roy et al., 2015). For instance, butterfly surveys are notoriously sensitive to weather. Even under “standardized” transect counts, recorders will observe disproportionately more individuals when it is sunny and warm (Turner et al., 1987). Also all outliers for grasshopper abundance came from a highly diverse grassland community located on shallow soil in the Italian survey. This grassland hosted many grasshoppers because most species require open and relatively dry and warm grasslands (Marini et al., 2008), conditions which were confirmed by observations made in other Mediterranean grasslands (Kati et al., 2012). The response of grasshopper assemblages to environmental change was recently shown to differ among vegetation communities (Fumy et al., 2020), and it thus becomes obvious that building our indicators from only a limited number of grassland management classes can decrease the precision of their habitat value assessment.
We, however, expect the indicators to be able to classify various grassland management types according to their effects on insect diversity. The sensitivity analysis we carried out using an independent dataset revealed the contrasting suitability of grassland habitats for butterflies and consistent differences among management practices (Figure 3). It confirmed that grassland management can help to preserve/restore biodiversity in the insect communities, e.g., by successfully predicting the benefits of decreasing cutting frequency in high-yield meadows (Marini et al., 2009) and of decreasing stocking rates in continuously grazed pastures (Bergman et al., 2008; Dumont et al., 2009; Jerrentrup et al., 2014). Conversely, the indicator did not reveal any effect of cutting frequency in low-yield grasslands (i.e., among management types 1, 2, and 3 in Figure 3), which contradicts the findings of Korösi et al. (2014). The indicator also did not reveal the benefits of keeping some sub-plots ungrazed at flowering peak compared to the benefits of using continuous grazing at the same lenient stocking rate (i.e., among management types 6, 7, and 10). In this case, note that (1) the temporary exclusion of some sub-plots at flowering peak may have been more “strictly managed” in the experiments by Farruggia et al. (2012) and Ravetto Enri et al. (2017) than in the plots used for external validation, and (2) no significant differences could be detected between the two management treatments in sheep-grazed pastures (Scohier et al., 2013).
There are various reasons that can lead to discrepancies between predicted and observed values. First, data were collected from various research projects, with measurements made during different years, in different locations and under a range of pedoclimatic conditions. As a result, there was a loss in precision compared to the outputs from mechanistic models that included a wide range of environmental and pedoclimatic variables. However, it is important to note that one limitation of classical modeling approaches is that they are usually too specific to be applicable to a wide variety of species and grassland types (Johst et al., 2015). Here, part of the sampling bias was compensated by the fact that we used data sets in which recordings were made using the same methodology (Pollard and Yates, 1993). Second, using data from different experimental sites also implies that we used surveys with different guilds of insects, and probably different proportions of butterflies and grasshoppers from tall and short grasslands; this is likely to add variability in the recorded data that was used for output validation. Third, we chose to focus on factors at the field scale only, as farmers manage grassland rather than landscape features, but landscape features are also known to influence insect populations (Bergman et al., 2008; Van Halder et al., 2017; Berg et al., 2019; Seibold et al., 2019). Here, the effects of the contrasting landscape features between the experimental sites used for output validation could not be considered; additionally, the variability that they added to the recorded data was also not considered. Thus, the development of indicators that can be used by non-specialists undoubtedly led to oversimplification and debatable choices (i.e., variable weights and thresholds in decision trees) that affected their predictive power.
For these different reasons, our indicators do not pretend to precisely predict insect abundance and species richness; however, they can supply relevant information about a potential habitat value of grasslands. In spite of the important scientific literature, including reviews (Gaujour et al., 2012; Milberg et al., 2016), meta-analyses (Herrero-Jáuregui and Oesterheld, 2018) and multi-site surveys (Lüscher et al., 2014; Hallmann et al., 2017; Berg et al., 2019; Seibold et al., 2019), there are indeed so many combinations between grassland types, management, soils and climate that a full knowledge of the effects of all these combinations on insect guilds cannot be achieved. Therefore, it remains helpful to offer tools to stakeholders so that they can make adequate decisions for biodiversity preservation in grassland habitats. A fundamental difference between our approach and the approach of the LUI index (Blüthgen et al., 2012) is that our set of indicators is not designed to test the relationships between management and grassland biodiversity, but rather builds upon the existing state of the art of these relationships. Our approach requires botanical measurements and these can be available from research programmes or long-term plot surveys. The calculation of the LUI index requires knowledge of fertilization, mowing and grazing intensity level in each plot as well as their regional mean, which is not always available to end-users. Although the habitat suitability of any grassland is not enough information alone to have direct applicability to higher conservation value taxa or species, our set of indicators can provide a cost-effective evaluation of temperate grassland suitability for three insect taxa, and their application does not require any entomological skill.
Data Availability Statement
The original contributions presented in the study are publicly available. This data can be found here: https://doi.org/10.15454/A7KNLK.
Author Contributions
BD: conceptualization, project administration, data collection, and writing—original draft. NR: conceptualization, data analysis, and revision original draft. PJ: conceptualization, data collection, and revision original draft. JJ, GL, and ST: data collection and revision original draft. JV: data analysis and revision original draft. SP and OH-E: conceptualization, project administration, and revision original draft. All authors contributed to the article and approved the submitted version.
Funding
This research was funded by the European Community's 7th Framework Programme under the grant agreement FP7-244983 Multisward.
Conflict of Interest
The authors declare that the research was conducted in the absence of any commercial or financial relationships that could be construed as a potential conflict of interest.
Publisher's Note
All claims expressed in this article are solely those of the authors and do not necessarily represent those of their affiliated organizations, or those of the publisher, the editors and the reviewers. Any product that may be evaluated in this article, or claim that may be made by its manufacturer, is not guaranteed or endorsed by the publisher.
Acknowledgments
The authors thank T. Walter (Agroscope), S. J. Hegland (Sogn og Fjordane University), and P. Bachelard (SHNAO) for their expertise. We are also grateful to A. Farruggia, R. Heinzelmann, J. Isselstein, L. Lanore, V. Manneville, and M. Scimone who provided data for indicator validation.
References
Alignan, J. F., Debras, J. F., and Dutoit, T. (2018). Orthoptera prove good indicators of grassland rehabilitation success in the first French Natural Asset Reserve. J. Nat. Conserv. 44, 1–11. doi: 10.1016/j.jnc.2018.04.002
Alison, J., Botham, M., Maskell, L. C., Garbutt, A., Seaton, F. M., Skates, J., et al. (2021). Woodland, cropland and hedgerows promote pollinator abundance in intensive grassland landscapes, with saturating benefits of flower cover. J. Appl. Ecol. 59, 342–354. doi: 10.1111/1365-2664.14058
Bendel, C. R., Hovick, T. J., Limb, R. F., and Harmon, J. P. (2018). Variation in grazing management practices supports diverse butterfly communities across grassland working landscapes. J. Insect Conserv. 22, 99–111. doi: 10.1007/s10841-017-0041-9
Berg, A., Cronvall, E., Eriksson, A., Glimskar, A., Hiron, M., Knape, J., et al. (2019). Assessing agri-environmental schemes for semi-natural grasslands during a 5-year period: can we see positive effects for vascular plants and pollinators? Biodiv. Conserv. 28, 3989–4005. doi: 10.1007/s10531-019-01861-1
Bergman, K. O., Ask, L., Askling, J., Ignell, H., Wahlman, H., and Milberg, P. (2008). Importance of boreal grasslands in Sweden for butterfly diversity and effects of local and landscape habitat factors. Biodiv. Conserv. 17, 139–153. doi: 10.1007/s10531-007-9235-x
Blüthgen, N., Dormann, C. F., Prati, D., Klaus, V. H., Kleinebecker, T., Hölzel, N., et al. (2012). A quantitative index of land-use intensity in grasslands: Integrating mowing, grazing and fertilization. Basic Appl. Ecol. 13, 207–220. doi: 10.1016/j.baae.2012.04.001
Bockstaller, C., and Girardin, P. (2003). How to validate environmental indicators. Agric. Syst. 76, 639–653. doi: 10.1016/S0308-521X(02)00053-7
Brambilla, M., Gubert, F., and Pedrini, P. (2021). The effects of farming intensification on an iconic grassland bird species, or why mountain refuges no longer work for farmland biodiversity. Agric. Ecosyst. Environ. 319, 107518. doi: 10.1016/j.agee.2021.107518
Butchart, S. H. M., Walpole, M., Collen, B., van Strien, A., Scharlemann, J. P. W., Almond, R. E. A., et al. (2010). Global biodiversity: indicators of recent declines. Science 328, 1164–1168. doi: 10.1126/science.1187512
Cade, B. S., and Noon, B. R. (2003). A gentle introduction to quantile regression for ecologists. Front. Ecol. Environ. 1, 412–420. doi: 10.1890/1540-9295(2003)001[0412:AGITQR]2.0.CO;2
Carvell, C (2002). Habitat use and conservation of bumblebees (Bombus spp.) under different grassland management regimes. Biol. Conserv. 103, 33–49. doi: 10.1016/S0006-3207(01)00114-8
Cherril, A. J., and Brown, V. K. (1992). Ontogenic changes in the micro-habitat preferences of Decticus verrucivorus (Orthoptera: Tettigonidae) at the edge of its range. Ecography 15, 37–44. doi: 10.1111/j.1600-0587.1992.tb00006.x
Dainese, M., Leps, J., and de Bello, F. (2015). Different effects of elevation, habitat fragmentation and grazing management on the functional, phylogenic and taxonomic structure of mountain grasslands. Perspect. Plant Ecol. Evol. Syst. 17, 44–53. doi: 10.1016/j.ppees.2014.09.002
Dennis, R. L. H (2004). Just how important are structural elements as habitat components? Indications from a declining lycaenid butterfly with priority conservation status. J. Insect Conserv. 8, 37–45. doi: 10.1023/B:JICO.0000027496.82631.4b
Dumont, B., Farruggia, A., Garel, J. P., Bachelard, P., Boitier, E., and Frain, M. (2009). How does grazing intensity influence the diversity of plants and insects in a species-rich upland grassland on basalt soils? Grass For. Sci. 64, 92–105. doi: 10.1111/j.1365-2494.2008.00674.x
Dumont, B., Rossignol, N., Huguenin-Elie, O., Jeanneret, P., Jerrentrup, J. S., Lüscher, G., et al. (2022). GrazeGrassBiodiv: Set of Indicators to Evaluate How Grazing by Livestock and Grassland Management Can Help Preserving Biodiversity in the Insect Communities of Grassland Ecosystems. Paris: Portail Data INRAE. doi: 10.15454/A7KNLK
Dumont, B., Ryschawy, J., Duru, M., Benoit, M., Chatellier, V., Delaby, L., et al. (2019). Review: associations among goods, impacts and ecosystem services provided by livestock farming. Animal 13, 1773–1784. doi: 10.1017/S1751731118002586
EEA (1998). Guidelines for Data Collection and Processing, in: EU State of the Environment Report. Annex 3 (Copenhagen).
Essens, T., van Langevelde, F., Vos, R. A., Van Swaay, C. A. M., and WallisDeVries, M. F. (2017). Ecological determinants of butterfly vulnerability across the European continent. J. Insect Conserv. 21, 439–450. doi: 10.1007/s10841-017-9972-4
Farruggia, A., Dumont, B., Scohier, A., Leroy, T., Pradel, P., and Garel, J. P. (2012). An alternative rotational stocking management designed to favour butterflies in permanent grasslands. Grass For. Sci. 67, 136–149. doi: 10.1111/j.1365-2494.2011.00829.x
Fleurance, G., Farruggia, A., Lanore, L., and Dumont, B. (2016). How does stocking rate influence horse behavior, performances and pasture biodiversity in mesophile grasslands? Agric. Ecosyst. Environ. 231, 255–263. doi: 10.1016/j.agee.2016.06.044
Fumy, F., Loffler, F., Samways, M. J., and Fartmann, T. (2020). Response of Orthoptera assemblages to environmental change in a low mountain range differs among grassland types. J. Environ. Manage. 256, 109919. doi: 10.1016/j.jenvman.2019.109919
Fussell, M., and Corbet, S. A. (1992). Flower usage by bumblebees: a basis for forage plant management. J. Appl. Ecol. 29, 451–465. doi: 10.2307/2404513
Gardiner, T (2006). The impact of grassland management on Orthoptera populations in the UK. Ph.D., University of Essex, Colchester, United Kingdom.
Gaujour, E., Amiaud, B., Mignolet, C., and Plantureux, S. (2012). Factors and processes affecting plant biodiversity in permanent grasslands. a review. Agron. Sustain. Dev. 32, 133–160. doi: 10.1007/s13593-011-0015-3
Girardin, P., Bockstaller, C., and van der Werf, H. M. G. (1999). Indicators: tools to evaluate the environmental impacts of farming systems. J. Sustain. Agric. 13, 5–21. doi: 10.1300/J064v13n04_03
Gossner, M. M., Lewinsohn, T. M., Kahl, T., Grassein, F., Boch, S., Prati, D., et al. (2016). Land-use intensification causes multitrophic homogeneization of grassland communities. Nature 540, 266–269. doi: 10.1038/nature20575
Goulson, D., Hanley, M. E., Darvill, B., Ellis, J. S., and Knight, M. E. (2005). Causes of rarity in bumblebees. Biol. Conserv. 122, 1–8. doi: 10.1016/j.biocon.2004.06.017
Guillaume, S., and Charnomordic, B. (2011). Learning interpretable fuzzy inference systems with FisPro. Inform. Sci. 181, 4409–4427. doi: 10.1016/j.ins.2011.03.025
Guillaume, S., and Charnomordic, B. (2012). Fuzzy inference systems: an integrated modeling environment for collaboration between expert knowledge and data using FisPro. Expert Syst. Appl. 39, 8744–8755. doi: 10.1016/j.eswa.2012.01.206
Hallmann, C. A., Sorg, M., Jongejans, E., Siepel, H., Hofland, N., Schwan, H., et al. (2017). More than 75 percent decline over 27 years in total flying insect biomass in protected areas. PLoS ONE 12, e0185809. doi: 10.1371/journal.pone.0185809
Henry, E. H., Haddad, N. M., Wilson, J., Hughes, P., and Gardner, B. (2015). Point-count methods to monitor butterfly populations when traditional methods fail: a case study with Miami blue butterfly. J. Insect Conserv. 19, 519–529. doi: 10.1007/s10841-015-9773-6
Herrero-Jáuregui, C., and Oesterheld, M. (2018). Effects of grazing intensity on plant richness and diversity: a meta-analysis. Oikos 127, 757–766. doi: 10.1111/oik.04893
Humbert, J. Y., Ghazoul, J., Richner, N., and Walter, T. (2010). Hay harvesting causes high orthopteran mortality. Agric. Ecosyst. Environ. 139, 522–527. doi: 10.1016/j.agee.2010.09.012
IPBES (2019). Global assessment report on biodiversity and ecosystem services of the Intergovernmental Science-Policy Platform on Biodiversity and Ecosystem Services, eds E. S. Brondizio, J. Settele, S. Díaz, and H. T. Ngo (Bonn: IPBES secretariat), 1148.
Jeanneret, P., Schüpbach, B., and Luka, H. (2003a). Quantifying the impact of landscape and habitat features on biodiversity in cultivated landscapes. Agric. Ecosyst. Environ. 98, 311–320. doi: 10.1016/S0167-8809(03)00091-4
Jeanneret, P., Schüpbach, B., Pfiffner, L., and Walker, T. (2003b). Arthropod reaction to landscape and habitat features in agricultural landscapes. Landscape Ecol. 18, 253–263. doi: 10.1023/A:1024496712579
Jerrentrup, J. S., Seither, M., Petersen, U., and Isselstein, J. (2015). Little grazer species effect on the vegetation in a rotational grazing system. Agric. Ecosyst. Environ. 202, 243–250. doi: 10.1016/j.agee.2015.01.007
Jerrentrup, J. S., Wrage-Mönnig, N., Röver, K. U., and Isselstein, J. (2014). Grazing intensity affects insect diversity via sward structure and heterogeneity in a long-term experiment. J. Appl. Ecol. 51, 968–977. doi: 10.1111/1365-2664.12244
Johst, K., Drechsler, M., Mewes, M., Sturm, A., and Watzold, F. (2015). A novel modeling approach to evaluate the ecological effects of timing and location of grassland conservation measures. Biol. Conserv. 182, 44–52. doi: 10.1016/j.biocon.2014.11.033
Kati, V., Zografou, K., Tzirkalli, E., Chitos, T., and Willemse, L. (2012). Butterfly and grasshopper diversity patterns in humid Mediterranean grasslands: the role of disturbance and environmental factors. J. Insect Conserv. 16, 807–818. doi: 10.1007/s10841-012-9467-2
Korösi, Á., Szentirmai, I., Batáry, P., Kövér, S., Örvössy, N., and Peregovits, L. (2014). Effects of timing and frequency of mowing on the threatened scarce large blue butterfly – a fine-scale experiment. Agric. Ecosyst. Environ. 196, 24–33. doi: 10.1016/j.agee.2014.06.019
Kruess, A., and Tscharntke, T. (2002). Grazing intensity and the diversity of grasshoppers, butterflies, and trap-nesting bees and wasps. Conserv. Biol. 16, 1570–1580. doi: 10.1046/j.1523-1739.2002.01334.x
Larkin, M., and Stanley, D. A. (2021). Impacts of management at a local and landscape scale on pollinators in semi-natural grasslands. J. Appl. Ecol. 58, 2505–2514. doi: 10.1111/1365-2664.13990
Lüscher, G., Jeanneret, P., Schneider, M. K., Turnbull, L. A., Arndorfer, M., Balázs, K., et al. (2014). Responses of plants, earthworms, spiders, and bees to geographic location, agricultural management and surrounding landscape in European arable fields. Agric. Ecosyst. Environ. 186, 124–134. doi: 10.1016/j.agee.2014.01.020
Marini, L., Fontana, M., Scotton, M., and Klimek, S. (2008). Vascular plant and Orthoptera diversity in relation to grassland management and landscape composition in the European Alps. J. Appl. Ecol. 45, 361–370. doi: 10.1111/j.1365-2664.2007.01402.x
Marini, L., Fontana, P., Battisti, A., and Gaston, K. J. (2009). Agricultural management, vegetation traits and landscape drive orthopteran and butterfly diversity in a grassland-forest mosaic: a multi-scale approach. Insect Conserv. Divers. 2, 213–220. doi: 10.1111/j.1752-4598.2009.00053.x
Marja, R., Klein, A. M., Viik, E., and Batáry, P. (2021). Environmentally-friendly and organic management practices enable complementary diversification of plant-bumblebee food webs. Basic Appl. Ecol. 53, 164–174. doi: 10.1016/j.baae.2021.03.013
Michaud, A., Plantureux, S., Amiaud, B., Carrère, P., Cruz, P., Duru, M., et al. (2012). Identification of the environmental factors which drive the botanical and functional composition of permanent grasslands. J. Agric. Sci. 150, 219–236. doi: 10.1017/S0021859611000530
Milberg, P., Bergman, K. O., Cronvall, E., Eriksson, Å. I., Glimskär, A., Islamovic, A., et al. (2016). Flower abundance and vegetation height as predictors for nectar-feeding insect occurrence in Swedish semi-natural grasslands. Agric. Ecosyst. Environ. 230, 47–54. doi: 10.1016/j.agee.2016.05.029
Mitchell, P. L (1997). Misuse of regression for empirical validation of models. Agric. Syst. 54, 313–326. doi: 10.1016/S0308-521X(96)00077-7
Nakajima, K., and Miyashita, T. (2021). Close association between grasshopper and plan communities in suburban secondary grasslands and the indicator value of grasshoppers for conservation. Landsc. Ecol. Engineer. 17, 363–374. doi: 10.1007/s11355-021-00447-w
Neyret, M., Fischer, M., Allan, E., Hölzel, N., Klaus, V. H., Kleinebecker, T., et al. (2021). Assessing the impact of grassland management on landscape multifunctionality. Ecosyst. Serv. 52, 101366. doi: 10.1016/j.ecoser.2021.101366
Öckinger, E., Eriksson, A. K., and Smith, H.G. (2006). Effects of grassland abandonment, restoration and management on butterflies and vascular plants. Biol. Conserv. 133, 291–300. doi: 10.1016/j.biocon.2006.06.009
Oksanen, J., Blanchet, F. G., Kindt, R., Legendre, P., Minchin, P. R., O'Hara, R. B., et al. (2013). Vegan: Community Ecology Package. R package version 2.0–7.
Phelan, N., Suddaby, D., and Stanley, D. A. (2021). Investigating the ecology of the Great Yellow Bumblebee (Bombus distinguendus) within the wider bumblebee community in North-West Ireland. J. Insect Conserv. 25, 297–310. doi: 10.1007/s10841-021-00299-7
Plantureux, S., and Thorion, G. (2005). “Combined prediction of forage production and biodiversity of permanent pastures in Vosges Mountains (France),” in Quality Production and Quality of the Environment in the Mountain Pastures of an Enlarged Europe, Conference of the FAO-CIHEAM Sub-Network of Mountain Pastures, Udine, 221–229.
Pollard, E., and Yates, T. J. (1993). Monitoring Butterflies for Ecology and Conservation. London: Chapman & Hall.
Powney, G. D., Carvell, C., Edwards, M., Morris, R. K. A., Roy, H. E., Woodcock, B. A., et al. (2019). Widespread losses of pollinating insects in Britain. Nat. Comm. 10, 1018. doi: 10.1038/s41467-019-08974-9
Pöyry, J., Luoto, M., Paukkunen, J., Pykälä, J., Raatikainen, K., and Kuussaari, M. (2006). Different responses of plants and herbivore insects to a gradient of vegetation height: an indicator of the vertebrate grazing intensity and successional age. Oikos 115, 401–412. doi: 10.1111/j.2006.0030-1299.15126.x
Ravetto Enri, S., Probo, M., Farruggia, A., Lanore, L., Blanchetete, A., and Dumont, B. (2017). A biodiversity-friendly rotational grazing system enhancing flower-visiting insect assemblages while maintaining animal and grassland productivity. Agric. Ecosyst. Environ. 241, 1–10. doi: 10.1016/j.agee.2017.02.030
Roy, D. B., Ploquin, E. F., Randle, Z., Risely, K., Botham, M. S., Middlebrook, I., et al. (2015). Comparison of trends in butterfly populations between monitoring schemes. J. Insect Conserv. 19, 313–324. doi: 10.1007/s10841-014-9739-0
Scohier, A., Ouin, A., Farruggia, A., and Dumont, B. (2013). Is there a benefit of excluding sheep from pastures at flowering peak on flower-visiting insect diversity? J. Insect Conserv. 17, 287–294. doi: 10.1007/s10841-012-9509-9
SEBI (2010). Halting the Loss of Biodiversity by 2010: Proposal for a First Set of Indicators to Monitor Progress in Europe. Technical Report No 11/2007. Copenhagen: European Environment Agency.
Seibold, S., Gossner, M. M., Simons, N. K., Blüthgen, N., Müller, J., Ambarli, D., et al. (2019). Arthropod decline in grasslands and forests is associated with landscape-level drivers. Nature 574, 671–674. doi: 10.1038/s41586-019-1684-3
Siegel, N., and Castellan, N. J. (1988). Non Parametric Statistics for the Behavioral Sciences. New York, NY: MacGraw Hill Int.
Sjödin, N. E (2007). Pollinator behavioural response to grazing intensity. Biodiv. Conserv. 16, 2103–2121. doi: 10.1007/s10531-006-9103-0
Sjödin, N. E., Bengtsson, J., and Ekbom, B. (2008). The influence of grazing intensity and landscape composition on the diversity and abundance of flower-visiting insects. J. Appl. Ecol. 45, 763–772. doi: 10.1111/j.1365-2664.2007.01443.x
Skórka, P., Settele, J., and Woyciechowski, M. (2007). Effects of management cessation on grassland butterflies in southern Poland. Agric. Ecosyst. Environ. 121, 319–324. doi: 10.1016/j.agee.2006.11.001
Stefanescu, C., Herrando, S., and Páramo, F. (2004). Butterfly species richness in the north-west Mediterranean Basin: the role of natural and human-induced factors. J. Biogeogr. 31, 905–915. doi: 10.1111/j.1365-2699.2004.01088.x
Suárez, A., and Lutsko, J. F. (1999). Globally optimal fuzzy decision trees for classification and regression. IEEE T. Pattern Anal. 21, 1297–1311. doi: 10.1109/34.817409
Turner, J. R. G., Gatehouse, C. M., and Corey, C. A. (1987). Does solar energy control organic diversity? Butterflies, moths and the British climate. Oikos 48, 195–205. doi: 10.2307/3565855
Van Halder, I., Thierry, M., Villemey, A., Ouin, A., Archaux, F., Barbaro, L., et al. (2017). Trait-driven responses of grassland butterflies to habitat quality and matrix composition in mosaic agricultural landscapes. Insect Conserv. Divers. 10, 64–77. doi: 10.1111/icad.12200
Van Swaay, C., Warren, M., and Lois, G. (2006). Biotope use and trends of European butterflies. J. Insect Conserv. 10, 189–209. doi: 10.1007/s10841-006-6293-4
Van Wingerden, W. K. R. E., Musters, J. C. M., and Maaskaamp, F. I. M. (1991). The influence of temperature on the duration of egg development in west European grasshoppers (Orthoptera: Acrididae). Oecologia 87, 417–423. doi: 10.1007/BF00634600
Walcher, R., Hussain, R. I., Sachslehner, L., Bohner, A., Jernej, I., Zaller, J. G., et al. (2019). Long-term abandonment of mountain meadows affects bumblebees, tree bugs and grasshoppers: a case study in the Austrian Alps. Appl. Ecol. Environ. Res. 17, 5887–5908. doi: 10.15666/aeer/1703_58875908
WallisDeVries, M. F (2004). A quantitative conservation approach for the endangered butterfly Maculinea alcon. Conserv. Biol. 18, 489–499. doi: 10.1111/j.1523-1739.2004.00336.x
WallisDeVries, M. F., Parkinson, A. E., Dulphy, J. P., Sayer, M., and Diana, E. (2007). Effects of livestock breed and grazing intensity on biodiversity and production in grazing systems. 4. effects on animal diversity. Grass For. Sci. 62, 185–197. doi: 10.1111/j.1365-2494.2007.00568.x
Warren, M. S., Maes, D., van Swaay, C. A. M., Goffart, P., Van Dyck, H., Bourn, N. A. D., et al. (2021). The decline of butterflies in Europe: problems, significance, and possible solutions. Proc. Natl. Acad. Sci. U.S.A. 118, e2002551117. doi: 10.1073/pnas.2002551117
Williams, P. H., and Osborne, J. L. (2009). Bumblebee vulnerability and conservation world-wide. Adipologie 40, 367–387. doi: 10.1051/apido/2009025
Willott, S. J (1997). Thermoregulation in four species of British grasshoppers (Orthoptera: Acrididae). Funct. Ecol. 15, 423–434. doi: 10.1046/j.1365-2435.1997.00135.x
Keywords: biodiversity, bumblebee, butterfly, fuzzy logic, grasshopper, grazing management, multicriteria modeling
Citation: Dumont B, Rossignol N, Huguenin-Elie O, Jeanneret P, Jerrentrup JS, Lüscher G, Taugourdeau S, Villerd J and Plantureux S (2022) Simple Assessment of Temperate Grassland Suitability as Habitat for Three Insect Taxa. Front. Sustain. Food Syst. 6:881410. doi: 10.3389/fsufs.2022.881410
Received: 22 February 2022; Accepted: 25 March 2022;
Published: 27 April 2022.
Edited by:
Juan Jose Villalba, Utah State University, United StatesReviewed by:
Jaret Daniels, University of Florida, United StatesKonrad Fiedler, University of Vienna, Austria
Copyright © 2022 Dumont, Rossignol, Huguenin-Elie, Jeanneret, Jerrentrup, Lüscher, Taugourdeau, Villerd and Plantureux. This is an open-access article distributed under the terms of the Creative Commons Attribution License (CC BY). The use, distribution or reproduction in other forums is permitted, provided the original author(s) and the copyright owner(s) are credited and that the original publication in this journal is cited, in accordance with accepted academic practice. No use, distribution or reproduction is permitted which does not comply with these terms.
*Correspondence: Bertrand Dumont, bertrand.dumont@inrae.fr