
55 US Literacy Statistics: Literacy Rate, Average Reading Level
Find the latest U.S. literacy statistics, including the U.S. literacy rate, average reading level, and more.


10
min read
Top 10 U.S. Literacy Rate Statistics
- Nationwide, on average, 79% of U.S. adults are literate in 2022. 21% of adults in the US are illiterate in 2022.
- 54% of adults have a literacy below sixth-grade level.
- 21% of Americans 18 and older are illiterate in 2022.
- Low literacy rates end up costing Americans up to $2.2 trillion every year.
- 34% of the people 18 and older with low literacy proficiency weren't born in the United States.
- The state with the highest rate of child literacy is Massachusetts, with over 80% of kids there having good proficiency in reading.
- New Mexico has the lowest literacy rate for children, with over 30% of the state's children being illiterate.
- New Hampshire has the most people 18 and older that are literate, with over 90% of them knowing how to read and write.
- California has the lowest literacy rate in the country, with 23% of them having little to no proficiency in reading skills.
- Throughout the US, there were 66% of children in the fourth grade couldn't read well in 2013.

Average Reading Level In The U.S.
The average American reads at the 7th- to 8th-grade level, according to The Literacy Project.
Read More: Reading Statistics
Child Literacy Statistics

- Based on research conducted, the reading scores for the majority of kids between the fourth and eighth grades were higher in 2017 than the scores made in 1992, though not higher than the scores two years prior.
- The gap in performance between specific ethnic groups, like black and white students from white and Hispanics, was lowered between the years 1992 and 2017, but not too drastically from 2015 to 2017.
- The average eighth-grade girl scored 10 points more than the eighth-grade boys did in reading exams in 2017.
- Students in the fourth grade improved their reading by 5 points from 1992 to 2017, with eighth-grade kids improving theirs by 7 points from the same period.
- The best three states with the lowest child literacy rates are Massachusetts, Maryland, and New Hampshire.
- States with the highest rates of child literacy are Louisiana, Mississippi, and New Mexico.
- Throughout the United States, 68% of fourth-grade students in 2013 could read with proficiency, a 6% boost since 2003.
Child Literacy Rates by State (4th Grade)
Adult Literacy Statistics
- The literacy rate for Americans aged 18 and older is 88%.
- From 2012 to 2017, a survey conducted with 12,330 adult participants aged between 16 and 74 had a mean score of 264 out of 500 on a literacy test. There were participants from every state and county within the total that took the exam.
- Literacy rates in the US correlate with the number of immigrants residing in a specific state, whether or not they're legal or illegal. States with large numbers of legal and illegal immigrants have a 60% greater chance of illiteracy rates being above 20% for the adult population.
Adult Literacy Rate and PIACC Score Estimate by State
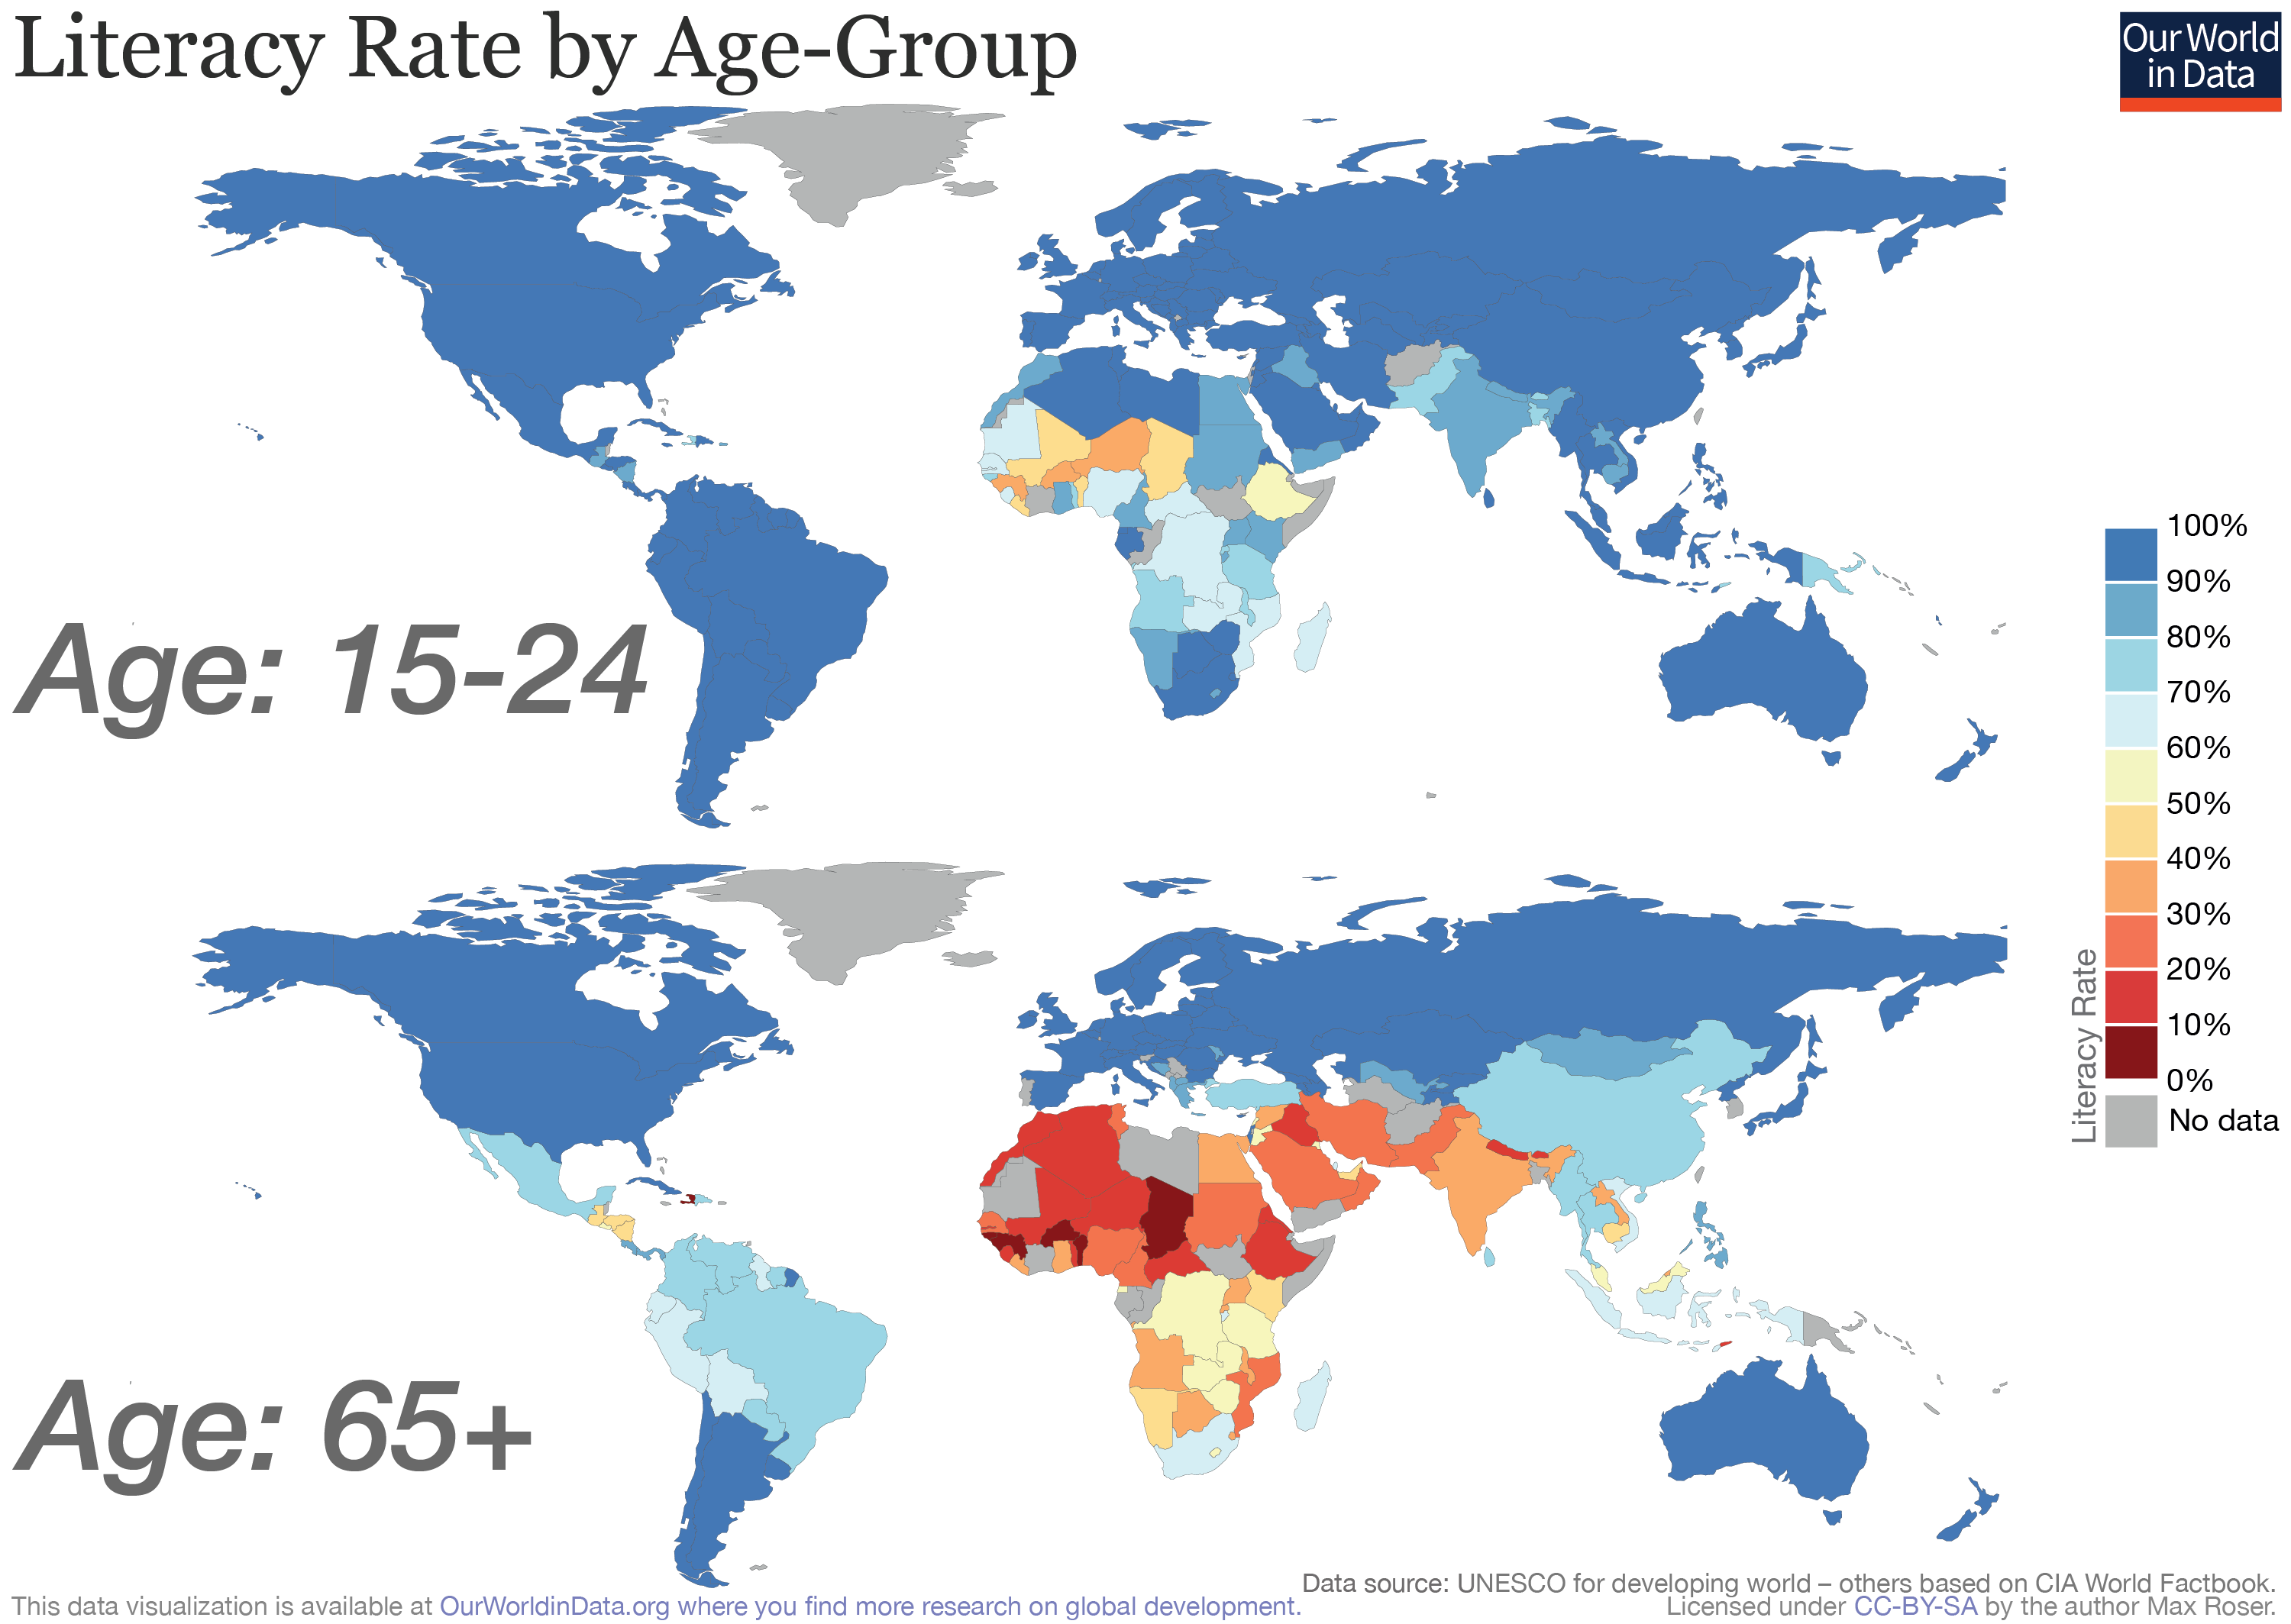
Literacy Rate By Country
If you're looking for a chart to show you the countries with the highest literacy rates, look below:
- A literacy rate that stays close to 100% is seen in quite a few other countries of the world, including Azerbaijan and Cuba.
- 86% of the world's population that's 15 years old and above is literate.
- Of all the nations of the world, over 95% of them have citizens with literary skills that are rudimentary, a near-contemporary achievement.
- Countries with a literacy rate below 30% include Niger, Burkina Faso, and South Sudan.
- North Korea has one of the highest rates of literacy in the world, near or at 100% of the total population with proficiency in reading.
- In 2018, Uzbekistan recorded a literacy rate of 99.99% of the population with reading skills.
- 99.97% of the Ukrainian population could read, according to estimates made in 2012.
- In San Marino, 99.92% of the population could read, based on a 2018 estimate.
- Latvia recorded a 99.89% literacy rate in 2018, placing it in the top 10 countries with the best reading proficiencies in the world.
- In 2016, Chad was the least literate country in the world, with just 22.31% of the population knowing how to read.
- In 2014, Guinea had a 32% literacy rate, one of the world's lowest.
- Mali showed a literacy rate of 35.47% in 2018.
- Afghanistan had a literacy rate of 43.02% in 2018, though significantly better than in years past.
- Central African Republic has a literacy rate of 37.40% placing it in the top ten lowest in the world.
Literacy Rate By State
List of literacy rates by state:
- New Hampshire – 88.50%
- Alaska – 87.30%
- Vermont – 87.20%
- Minnesota – 86.90%
- Montana – 86.90%
- Maine – 86.60%
- North Dakota – 86.60%
- Wyoming – 86.40%
- Utah – 85.50%
- Iowa – 85.10%
- South Dakota – 85.10%
- Wisconsin – 84.70%
- Hawaii – 84.10%
- Washington – 83.90%
- Idaho – 83.60%
- Nebraska – 83.60%
- Colorado – 83.40%
- Oregon – 83.20%
- Kansas – 83.10%
- Connecticut – 82.80%
- Massachusetts – 82.70%
- Michigan – 82.40%
- Ohio – 82.30%
- Pennsylvania – 81.90%
- Indiana – 81.30%
- Virginia – 81.20%
- Missouri – 81.10%
- Maryland – 80%
- Oklahoma – 79.90%
- Delaware – 79.70%
- Illinois – 79.60%
- Rhode Island – 79.60%
- New Jersey – 79.30%
- West Virginia – 79.10%
- North Carolina – 78.70%
- Tennessee – 78.30%
- Kentucky – 78.10%
- District of Columbia – 77.70%
- South Carolina – 77.60%
- Arkansas – 76.90%
- Arizona – 76.60%
- Georgia – 76.40%
- Florida – 76.30%
- Alabama – 76.10%
- New York – 75.60%
- Nevada – 74.70%
- Louisiana – 72.90%
- Mississippi – 72%
- Texas – 71.80%
- California – 71.60%
- New Mexico – 70.90%
Literacy Statistics By State
- New Hampshire has 5.8 of adults that lack basic proficiency in reading, placing the state ahead of the rest with a 94.2% literacy rate.
- 36.6% of adults living in New Hampshire possess a graduate-level degree or higher, which is the 7th highest rate in the nation.
- 60.8% of New Hampshire residents are registered at a local library.
- Minnesota has a literacy rate of 94%, the nation's second highest.
- 6% of adults in Minnesota lack basic skills for reading and writing, though 69.9% of all state residents are registered users at a library.
- North Dakota has a literacy rate of 93.7% making it the nation's 3rd highest.
- California has the lowest literacy rate in America, with 23.1% of adults having inadequate reading proficiency.
- The state of New York has the second lowest literacy rate, with 22.1% of the population having poor reading abilities. Still, New York has 35.7% of adults with a Bachelor's degree, the country's 9th highest.
- 19.7% of Florida's adult population have low reading skills, the third lowest rate of literacy rate in the nation.
- According to researchers, 4 out of 5 Americans 18 and over possess medium to high proficiency in English reading and writing.
- 1 out of 5 American adults, or 21%, possess low literacy skills, comprising about 43 million people.
Literacy Rate By Gender

- Since 2020, 90% of men and 83% of women in the world are literate.
- In 2019, 90.07% of the world's male population was literate, while 83.02% of women were.
- In 2017, men that could read and write accounted for 89.% of the population, with women making up 82.64% with reading abilities.
Literacy Rate By Age
Globally, 86.3% is the literacy rate for people 15 years of age and older.
Literacy Rate By Race
- About 77% of the African American population has moderate to high reading and writing proficiency in the United States.
- 66% of the Hispanic population has medium to high literacy in America, with 65% of whites having moderate to high literacy.
Sources
- https://nces.ed.gov/surveys/piaac/skillsmap/
- https://worldpopulationreview.com/state-rankings/us-literacy-rates-by-state
- https://ourworldindata.org/literacy
- https://247wallst.com/special-report/2014/02/07/states-where-children-are-struggling-the-most-to-read/
- https://en.wikipedia.org/wiki/Literacy_in_the_United_States
- https://www.carebotaba.com/post/literacy-rates-asd