Are you worried about passing the AP® Statistics Exam? You’re in the right place. We wrote this comprehensive AP® Statistics study guide so you can master the concepts and walk into the test with confidence.
In this review guide, we’ll go over key questions you may have about the exam, how to study for AP® Statistics, as well as what AP® Statistics review and practice resources to use as you begin preparing for your exam.

What We Review
What’s the Format of the 2024 AP® Statistics Exam?
The AP® Statistics exam includes 40 multiple-choice questions and 6 free-response questions, including one Investigative Task; the Investigative Task is simply a challenging free-response question that applies the material to a new context.
| Section | # of Questions | Time Limit | % of Overall Score |
| Section I: Multiple Choice | 40 MCQs | 90 minutes | 50% |
| Section II Part A: Free Response | 5 FRQs | 65 minutes | 37.5% |
| Section II Part B: Investigative Task | 1 Investigative Task | 25 minutes | 12.5% |
Return to the Table of Contents
How Long is the AP® Statistics Exam?
The AP® Statistics exam is 3 hours long. Students will have 90 minutes to complete the multiple-choice section (40 questions) and 90 minutes to complete the free-response section (6 questions).

What Topics are Covered on the AP® Statistics Exam?
AP® Statistics Topics Overview
Here is an overview of the topics that will be covered on the AP® Statistics Exam, along with resources that can be used to review each unit.
| Unit | Topics | Resources |
| Unit 1: Exploring One-Variable Data |
| Exploring Categorical and Numerical Data |
| Unit 2: Exploring Two-Variable Data |
| Examining Relationships: scatterplots, correlation, LSRL
|
| Unit 3: Collecting Data |
| Taking Samples and Designing Experiments
|
| Unit 4: Probability, Random Variables, and Probability Distributions |
| Probability notes
Discrete, Binomial & Geometric Random Variables |
| Unit 5: Sampling Distributions |
| Sampling Distributions – Dan Shuster one-page summary
|
| Unit 6: Inference for Categorical Data: Proportions |
| These resources combine topics from Unit 6 and Unit 7:
|
| Unit 7: Inference for Quantitative Data: Means |
| Albert Practice Questions: Unit 7 |
| Unit 8: Inference for Categorical Data: Chi-Square |
| Chi-Square Testing
|
| Unit 9: Inference for Quantitative Data: Slopes |
| Inference for linear regression
|
Source: AP® Statistics: The Course at a Glance
Now we will show you how the topics are distributed amongst each exam section.
Section I: Multiple Choice
The multiple-choice section is worth half of the exam score and addresses the nine units of AP® Statistics with the following weights:
| Units | Exam Weighting for MC Questions |
| Unit 1: Exploring One-Variable Data | 15-23% |
| Unit 2: Exploring Two-Variable Data | 5-7% |
| Unit 3: Collecting Data | 12-15% |
| Unit 4: Probability, Random Variables, and Probability Distributions | 10-20% |
| Unit 5: Sampling Distributions | 7-12% |
| Unit 6: Inference for Categorical Data: Proportions | 12-15% |
| Unit 7: Inference for Quantitative Data: Means | 10-18% |
| Unit 8: Inference for Categorical Data: Chi-Square | 2-5% |
| Unit 9: Inference for Quantitative Data: Slopes | 2-5% |
That means you can focus the bulk of your study on the following:
- Units 1 and 2: Exploring data with graphs and summary statistics (20-30%)
- Units 4 and 5: Probability, random variables, and distributions (20-30%)
- Units 6 and 7: Inference for proportions and means (22-33%)
Just studying these topics could cover up to 90% of the multiple-choice section! To put that into context, in 2012, any student who scored between 70 and 100 earned a 5 on the AP® Statistics Exam. That means that by studying the right topics, you could earn a 5 on the AP® Statistics Exam by skipping three units entirely (although we don’t recommend skipping any units, for obvious reasons)!
Section II: Free Response
Like the multiple choice section, the free response section is worth half the exam score and often combines several skills into a single question.
The five standard free-response questions in Part A will include:
- One question with a primary focus on Collecting Data and Selecting Statistical Methods
- One question with a primary focus on Exploring Data and Data Analysis
- One question with a primary focus on Probability and Sampling Distributions with Simulations
- One question with a primary focus on Inference
- One question that focuses on two or more skill categories
The investigative task (Part B) will assess multiple topics and skills, focusing on the application of skills and content in new contexts or in non-routine ways.
Return to the Table of Contents
What Do the AP® Statistics Exam questions Look Like?
The College Board has released two full AP® Statistics Exams: 2012 AP® Statistics Exam and 1997 AP® Statistics Exam. Because they often reuse multiple choice questions, they limit the number of full official tests they make public (you can supplement this with full-length practice exams from Albert). For free response questions, the College Board has released twenty years of official AP® questions to be used for practice and review. Hooray!

Multiple-Choice Examples
Here are some of the most common questions you will see on the exam, with tips and tricks to make sure you get them right on test day.
#1: Deciphering a graph (usually a histogram, boxplot, or scatterplot)
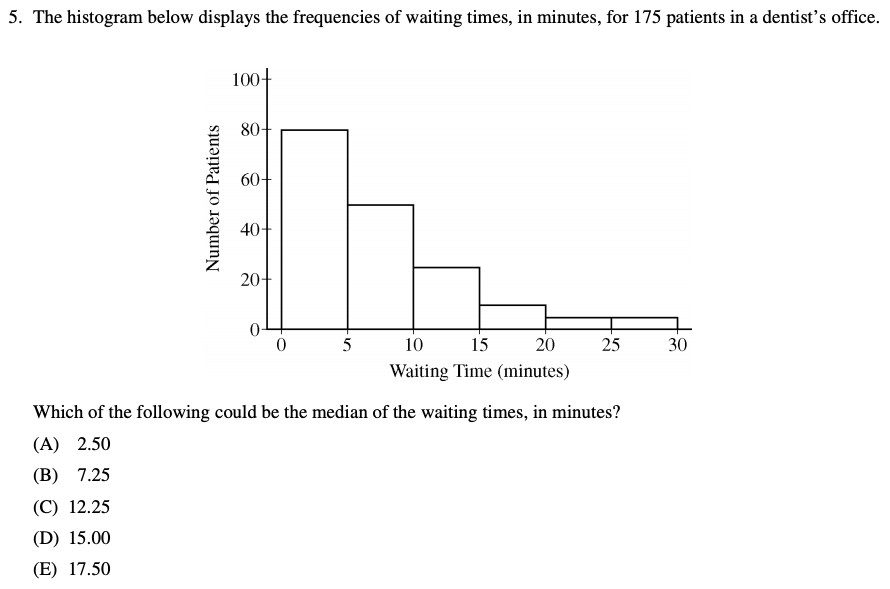
CollegeBoard 2012 AP® Statistics Exam #5
Understanding visual and numerical descriptions of data, including histograms and measures of center like median, are key parts of the AP® Statistics curriculum; they are such vital topics that they are covered in Unit 1! In this question, the creators of the test intentionally provide a skewed data set (one that is not symmetric) to assess your understanding of mean vs. median. Look at the “tail” on the right side of this histogram. That means the median (middle data point) has to be much lower than the mean (average calculated value).
What makes this even more tricky is a lack of real data points, so it is impossible to answer this question by plugging values into a calculator. You need to infer the location of the median using the sample size of 175 and finding the bar where the 88th (middle number) patient sits. While many are tempted to pick the “center” of the graph around 15, the median value is actually between 5 and 10 minutes. The answer is B, the only value in that range. You are sure to find questions like this on the test; be on the lookout for graphs that are skewed and do not look symmetric or normal.
#2: Which formula is correct?
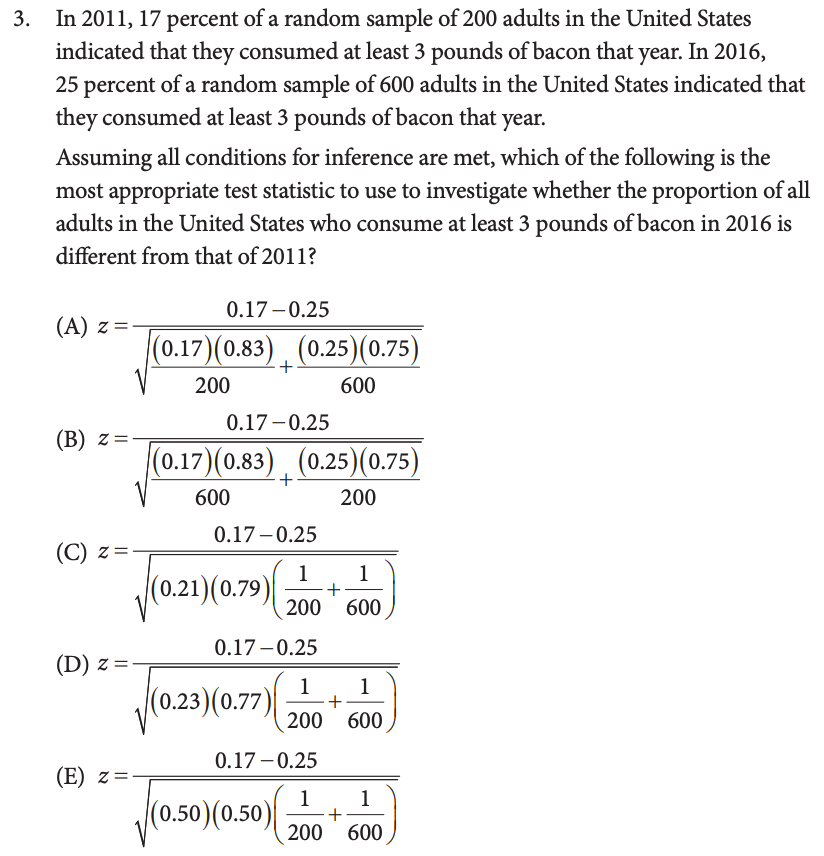
CollegeBoard 2019 AP® Statistics Course Description – MC Example #3
This question proves that a formula sheet is not necessarily your golden ticket to a 5. While you are provided a formula sheet for the test, the writers for the AP® Statistics Exam need to know that you can do more than plug-and-chug numbers. They want to know if you understand when and how to use each formula. This problem is a perfect example of how they might assess your knowledge of two-sample proportions and null hypotheses.
At first glance, you see that you have two groups to compare, where \hat{p}_1=0.17, n_1=200, \hat{p}_2=0.25, and n_2=600. With just those numbers and your trusty formula sheet, it might be tempting to pick A… but, wait!
You need to remember that this test has the null hypothesis: p_1=p_2! That means we perform calculations under the assumption that the two groups are equal, or that the null is true. So, you need to combine the two samples (with 34 and 150 successes out of a total 800 adults) to find a combined proportion of success \hat{p}_c=0.23. Then, and only then, you can plug your values into the appropriate formula. The answer is D.
#3: Interpreting a confidence interval
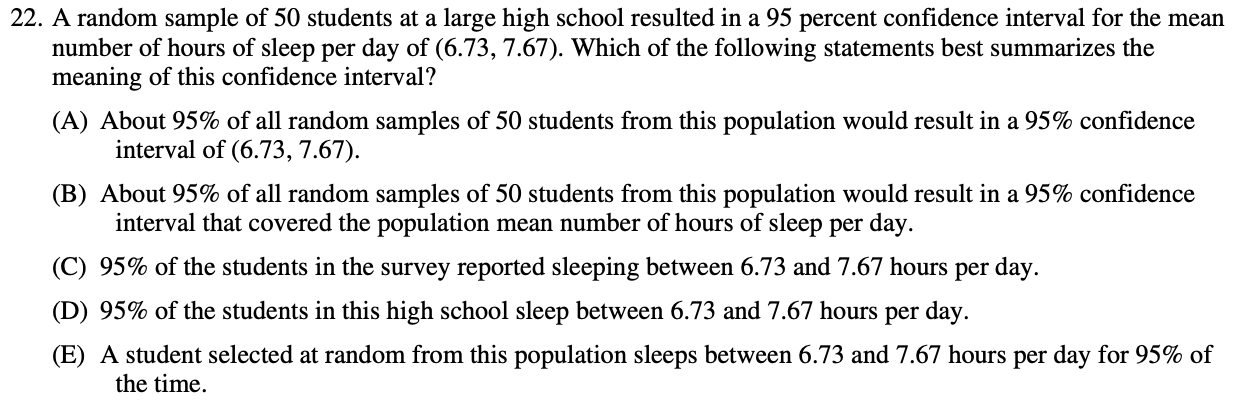
CollegeBoard 2012 AP® Statistics Exam #22
Any calculator or computer can churn out a confidence interval. It takes a real statistician to be able to interpret that information into an intelligible format. This is a classic question that assesses your understanding of “confidence interval”, a term based on repeated sampling to capture the true parameter. The 95% here refers to the percentage of samples that are successful in covering the true mean, not the percent of students or hours. Therefore, the answer is B.
This type of question appears again and again on AP® Statistics, and you will be asked to interpret other statistical terms like P-values, slopes of regression models, correlation coefficient r, z-scores, and more! It isn’t enough to memorize key words and phrases. You need to really understand what they represent in the context of the situation. Incorporate some flash cards into your study routine to really solidify your understanding of statistical terms and make this vocabulary second nature.

Return to the Table of Contents
Free Response Examples
We’ll also show you a few free response questions and break down the grading rubrics (example rubric from 2018) so that you can strategically tackle this section of the exam.
The scoring guidelines have remained the same since 1999. Each part of the question is scored with an E (essentially correct), P (partially correct), or I (incorrect). The combination of letter grades for each part will determine your composite numerical grade for the question: 1 (minimal response), 2 (developing response), 3 (substantial response), or 4 (complete response).
#1: Comparing two populations
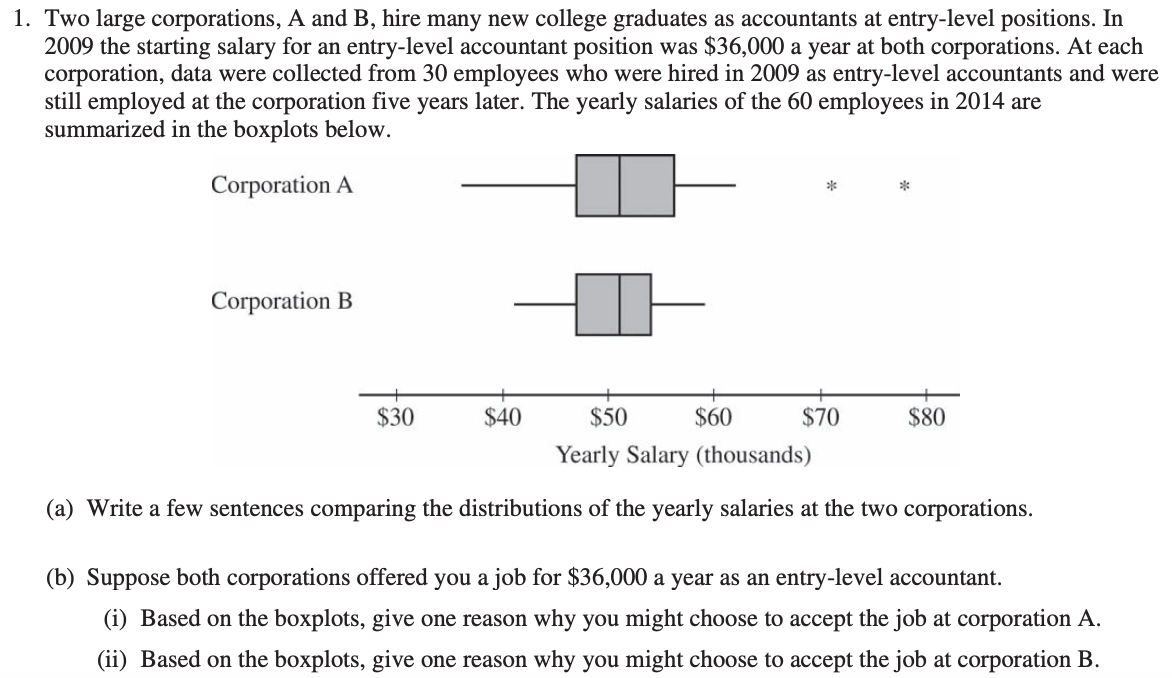
College Board 2015 AP® Statistics Exam #1
In this multi-part problem, you are asked to compare the salary distributions of two corporations based on their boxplots.
Quick tip: touch on all key features of the graphs using the acronym SOCS: shape, outliers, center, and spread. By talking about these features in context of the problem, you would be on track to earning an E (essentially correct) for part (a).
Here is a snapshot from the scoring guidelines for part (b):
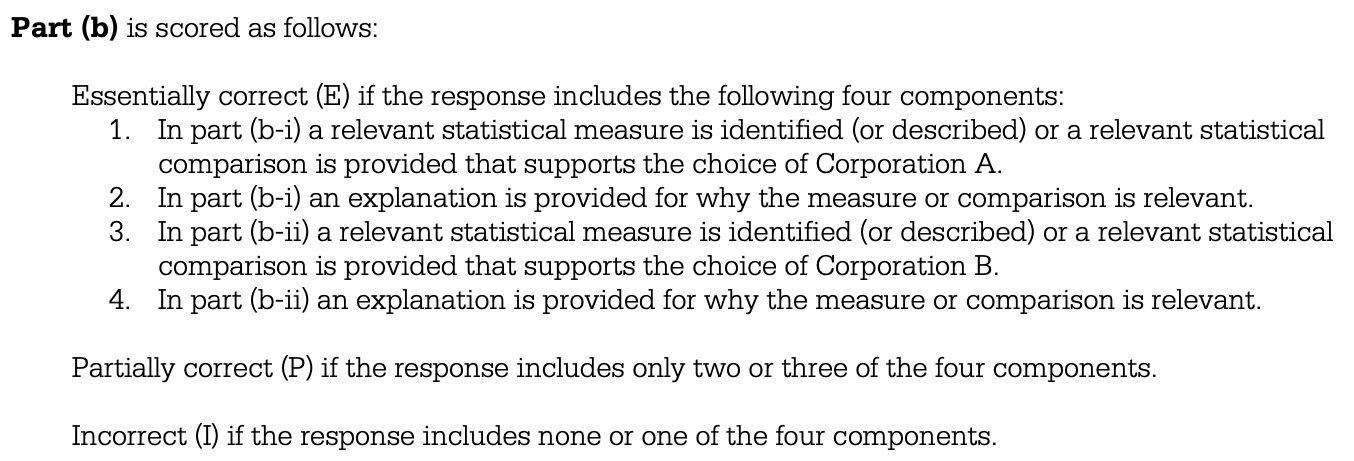
College Board 2015 Free Response Scoring guidelines
The important words here are “statistical measure”, meaning you must specifically reference values like the median in Corporation B or the outliers in Corporation A. You can always refer to SOCS for ideas on relevant statistical measures to use!

#2: Running a Full Inference Procedure
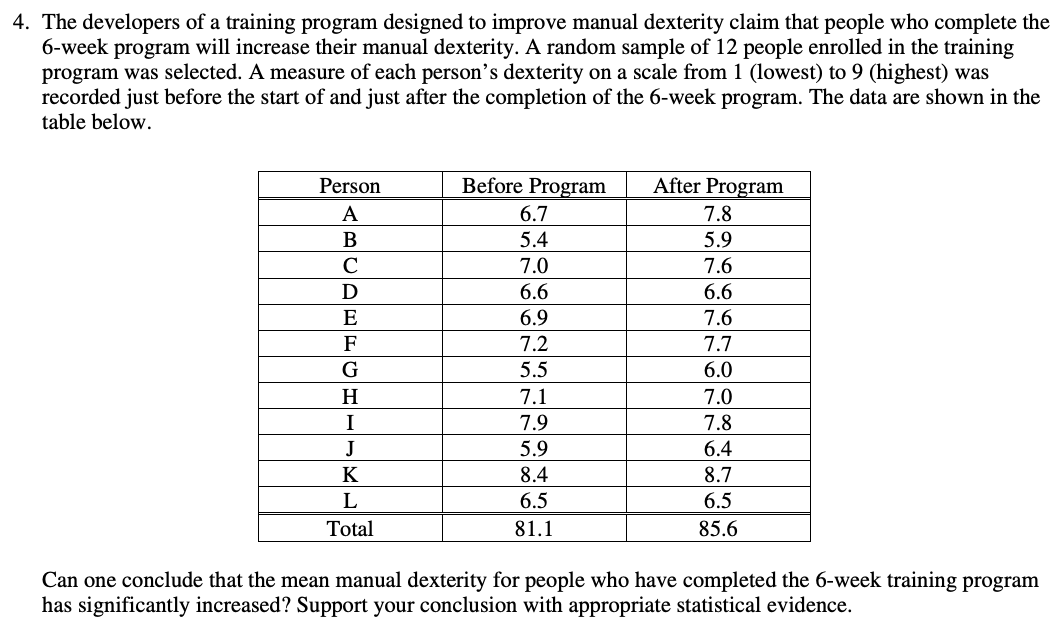
College Board 2006 AP® Statistics Exam Form B #4
Many students will get this problem wrong by accidentally running a two sample t-test instead of a matched pairs t-test. What they fail to recognize is that the two groups (before and after) are dependent on the person, thus matched up! If you need practice identifying statistical methods, try this interactive applet on Classifying Statistics Problems.
After identifying the test method, the rest involves plugging the values into your calculator to get the paired differences and the mean and standard deviation for that sample.
The 2006 Form B scoring guidelines detail the fours steps that are necessary for every hypothesis test you run:
- State the correct hypotheses
- Identify test name and check for conditions
- Calculate the test statistic and P-value
- Conclude in context
By correctly following that four-step process for hypothesis tests, you will check off all the boxes en route to earning your perfect score!
#3: Investigative Task – Multiple linear models
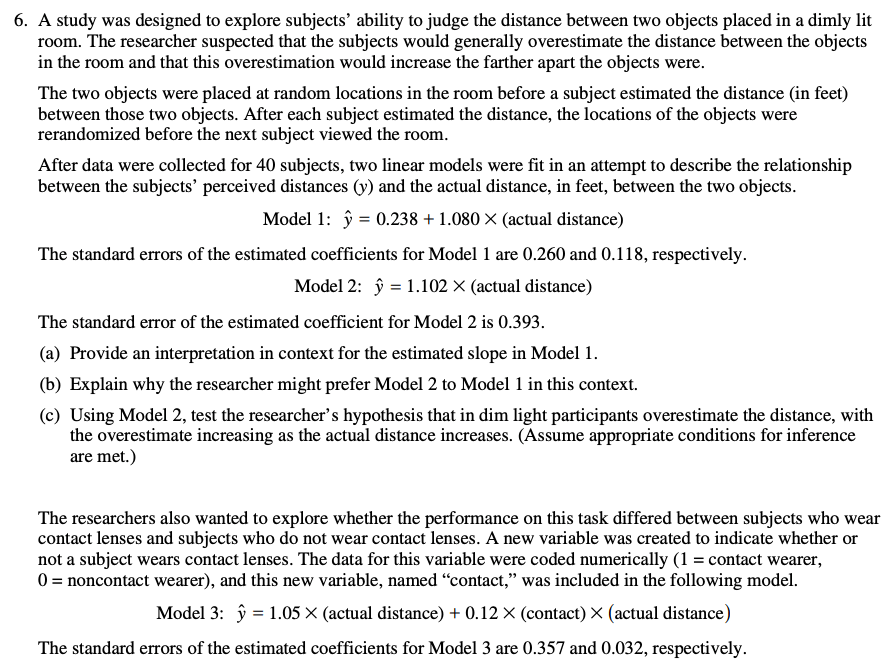
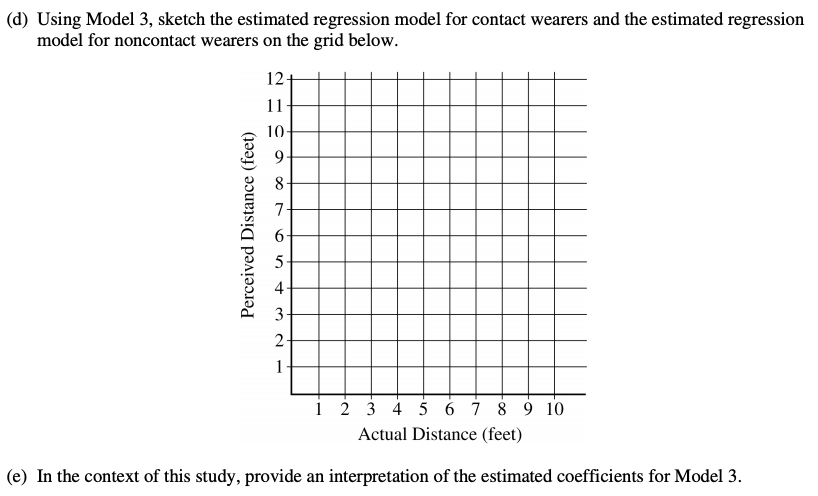
College Board 2007 AP® Statistics Exam #6
Just based on length alone, you can tell that the Investigative Task is significantly longer than other free response questions. Luckily, you are budgeted more time (25 minutes) to parse through the question and deliver a quality response.
Quick tip: Many students plan to tackle the Investigative Task first in order to guarantee it gets done in time and isn’t a source of stress at the end of the exam!
This problem demands a deep understanding of linear regression, dummy variables, and abstract thinking about the interaction of multiple variables. Looking at the scoring guidelines, you can see a focus on clear communication rather than long computations. So make sure to explain all your thinking and provide detailed explanations of your answers.

Return to the Table of Contents
What Can You Bring to the AP® Statistics Exam?
These guidelines will help you nail down what to bring to the AP® Statistics Exam and what NOT to bring! We recommend packing your bag the night before so you can relax the morning of the exam.
DO bring these:
- No. 2 pencils and erasers
- Pens with black or dark blue ink
- A graphing calculator with statistical capabilities (see full AP® Statistics Calculator Policy)
- A current government-issued or school-issued photo ID
- Your College Board SSD Accommodations Letter (if you are taking an exam with approved testing accommodations)
- A watch that does not have internet access and does not make noise
DO NOT bring these:
- Food or drink, including bottled water
- Any electronic equipment or communication devices, including:
- Phones, smartwatches, or wearable technology of any kind
- Laptops or tablet computers
- Bluetooth devices
- Portable listening or recording devices such as MP3 players and iPods
- Cameras or other photographic equipment
- Devices that can access the internet
- Separate timers of any type
- Any other electronic or communication devices
- Your own cheat sheet (a formula sheet will be provided)
Return to the Table of Contents
How to Study for AP® Statistics: 7 Steps
To ensure a thorough and effective review for the AP® Exam, it will take 20+ hours to complete all 7 steps listed below. Be sure to pace yourself when studying for your AP® Stats exam, and study for no longer than 2 hours at a time. You can cycle through steps 4 – 6 as many times as you feel is necessary to master the material and develop confidence with the exam.
1. Take a full diagnostic test (3 hours)
Time yourself to get a sense of pacing for each section, and take note of any topics or sections that give you trouble. You can use the officially released College Board exam from 2012, take a practice test from Albert online, or purchase a review book from Barron’s or The Princeton Review.
2. Grade your test and prioritize topics that you need to practice (1 – 2 hours)
You should take your time in this self-assessment piece to really make the most of your study sessions. Read carefully through the free response scoring guidelines while grading yourself, even reading the notes and alternative solutions.
Afterwards, go through the topics list and highlight each item based on your level of understanding: green if you are highly confident in that topic, yellow if you are close to mastery, and pink for topics that you need to review and practice.
3. Map out study sessions in your calendar (20 min)
Find out how many days you have before the AP® Statistics Exam day, and block out time each day for review. Even if you only review for 15 minutes a day, that is better than 8 hours of cramming the night before the exam. If you can, find a partner to join you for your study sessions!
“Success is the sum of small efforts – repeated day in and day out.” – Robert Collier
4. Re-learn tricky concepts with notes and videos (2 – 5 hours)
Look through summary pages in your textbook or review material from online resources, focusing on trickier topics you identified above. Mr. Holloman’s AP® Statistics, Dan Shuster Chapter Notes, and YouTube videos by Rob Tarrou are all great resources to help you clarify concepts you may have missed the first time around.
5. Do practice problems. Then do some more. (10 – 15 hours)
This is arguably the most important piece of the puzzle. You should practice sample questions from isolated topics and get detailed feedback on right + wrong answers.*
You can pick and choose questions from released AP® Statistics Exams or AP® Statistics Review Books and build up your mental “bank” of official questions.
*An important part of this process is checking your answers and reading through the solutions carefully. If you can articulate WHY you got an answer wrong and how your understanding of the topic has changed, you will be well on your way to acing the AP® Statistics Exam.

6. Take another full test under time pressure (3 hours)
Put your newfound knowledge to the test with another full test, paying careful attention to time management as you move through each section. You should budget about 2 minutes per multiple choice problem, 13 minutes for each regular free response, and 25 minutes for the Investigative Task. Afterwards, reflect on where you felt comfortable and rushed, and figure out exam sections that you may need to study up or save for last. For example:
- Do you run out of time when completing an Investigative Task? (We recommend doing this second in the free response section)
- Are you losing time typing numbers into your calculator for regression or graphical displays?
- Are you spending too long on multiple choice problems involving probability calculations?
Knowing your strengths and weaknesses can help you make a plan for test day so that you walk in feeling confident and fully prepared.
7. Rest up the day before the test! (5 hours)
Cycle through steps #4-6 as many times as you can during your study sessions, but leave the day before the exam for some relaxation and self-care. Go workout, meditate, hang out with friends, eat nutritious food, do some light review with flashcards, and most importantly… get a good night’s sleep!
*It can even be helpful to plan something fun after the exam to celebrate finishing AP® Stats. Grab ice cream with friends or treat yourself to a nap in the hammock!

Return to the Table of Contents
AP® Statistics Review: 15 Must-Know Study Tips
5 AP® Statistics Study Tips to Do at Home
1. Break up your study sessions into chunks using the Pomodoro Technique.
The classic model involves setting a timer and studying for 25 min sessions with a 5 min break in between each session. You can take a longer (30 min) break after 4 sessions to keep your mind fresh and productive. This will truly make the study sessions fly by!
2. Get to know your calculator and the common functions for statistics, such as pnorm, binompdf, calculating confidence intervals, and running regression models.
Here is a great summary page of Calculator Functions for the AP® Stats Exam. This will help you save enormous time on the multiple choice section and check your answers in the free response.
3. Practice classifying statistical inference procedures using your textbook or this applet on Classifying Statistics Problems.
Check out Stats Medic’s article Name that Significance, or this great flowchart of inference from StatsMonkey for a visual representation of when to implement each test or confidence interval.
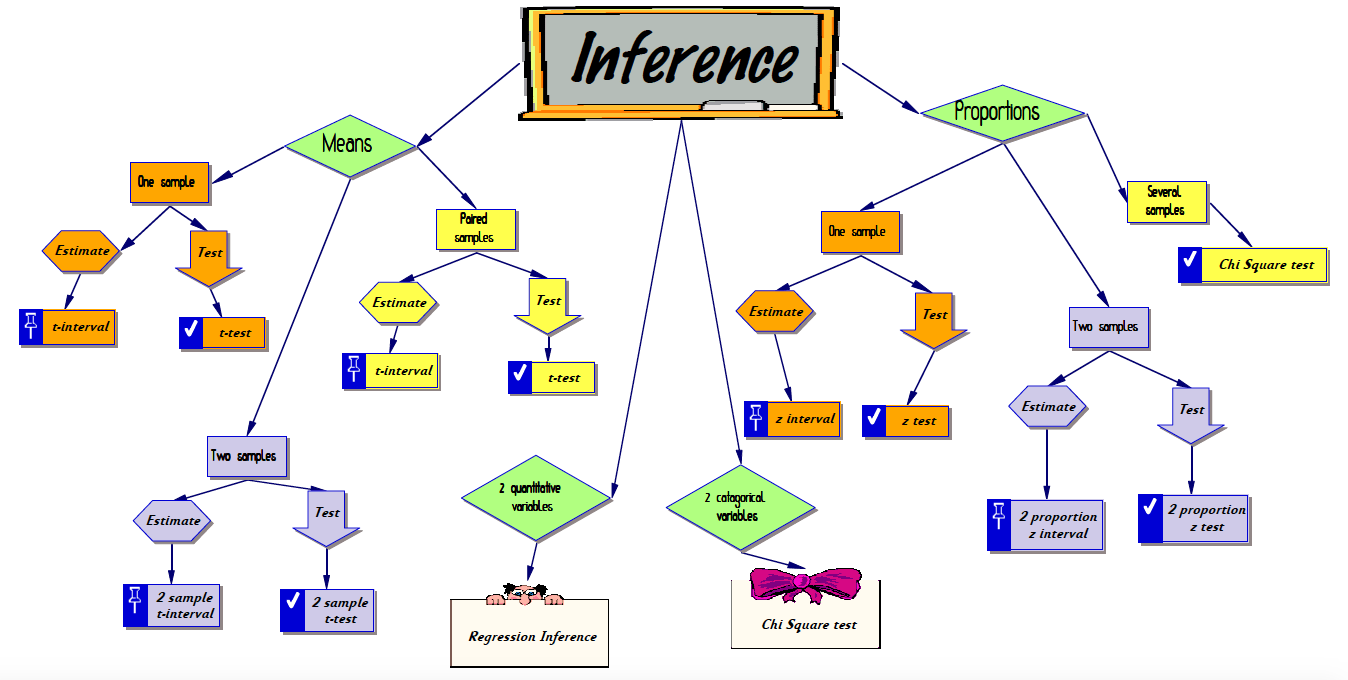
Source: StatsMonkey Inference Inspiration
4. Part of your studying can be annotating the AP® Statistics formula sheet so that you know which formulas to use for specific topics.
Instead of memorizing things that are already provided to you, you should reference each practice problem to a formula on the sheet (when applicable) and make a mental map of the cheat sheet. It is a similar process to annotating a book for close reading, where you write your own thoughts and opinions in the margins to help process and retain information.
5. Practice, practice, practice.
Reading your textbook and gaining knowledge is one thing; putting that knowledge to the test with challenging practice questions is another. As soon as possible, start doing multiple choice and free response questions from College Board, Albert, or AP® Statistics Review Books. We hope that you make mistakes and learn from them. Utilize your teachers and peers for help when you get stuck, then do as many practice problems as you can to build knowledge and confidence.
“Don’t practice until you get it right. Practice until you can’t get it wrong.”
5 AP® Statistics Multiple Choice Tips
1. Answer every question, even if you have to guess.
You don’t lose points for wrong answers, so before you give up on a question completely, use the process of elimination to rule out unlikely answers and make an educated guess. NEVER leave a question blank; the same goes for any free response questions, where you might earn partial credit for a formula that is jotted down correctly.
2. Focus the bulk of your studying on the topics that are more likely to appear on the test:
For example, these topics appear the most in the multiple choice section.
- Inference for proportions and means (22-33%)
- Exploring data with graphs and summary statistics (20-30%)
- Probability, random variables, and distributions (20-30%)
Other topics like experimental design, linear regression, and chi-square testing will show up on the exam, but at a much lower frequency than those listed above.
3. Draw sketches of the distributions whenever possible, turning verbal descriptions into visual displays that you can interpret.
This is especially useful when it comes to calculating probabilities (with Venn diagrams or normal distributions), finding summary statistics for skewed distributions, and envisioning trends in scatterplots.

4. Practice identifying binomial variables such as a coin flip, free throw, or any random event involving: 1) repeated trials, 2) two possible outcomes, 3) a fixed probability of success, and 4) independent trials.
This is a very specific probability topic that can save you valuable time when you recognize it and quickly calculate the answer using binompdf in your calculator.
5. Read the questions completely— no skimming.
Even with longer descriptions of experimental designs or hypothesis test interpretations, make sure to read each sentence thoroughly and understand the scenario before looking at the answers. Some of the “distractor” answers have subtle differences that are designed to appear plausible but that actually exploit common misconceptions.

5 AP® Statistics Free Response Tips
1. Know the language of statistics and use common phrases like “on average”, “predicted increase”, or “sufficient evidence to reject the null”.
Here is an excellent handout of the Top 10 Phrases to use in your Answers for AP® Statistics
2. Label everything, including graphs, formulas, random number tables, and sketches of normal distributions.
You don’t want to lose points for lack of communication, and clear labels will keep your thoughts organized while giving you a shot at partial credit. This goes along with tip #3…
3. Explain all of your answers thoroughly and in context!
You will receive no credit for “naked answers” on the test, even if the numbers are correct (this is a common mistake on probability questions). Provide detailed explanations on your answers in context to receive full credit. For example…
- No context: “With a P-value of 0.018, we have sufficient evidence to reject the null hypothesis at the 5% significance level.”
- In context: “With a P-value of 0.018, we have sufficient evidence to reject the null hypothesis at the 5% significance level and conclude that the manual dexterity for people who completed the 6-week training program has, on average, significantly increased.”
4. Read through all 6 questions before you put the pen to paper and see which ones you feel confident tackling first.
We recommended doing the “easiest” problem first, then the Investigative Task, then the other 4.
Remember than you have about 13 minutes for the standard free response questions, and 25 minutes for the Investigative Task. Keep track of your time and write down something for every part to ensure that you have as detailed an explanation as possible.
5. Use strange acronyms to help you remember common statistical procedures.
For example, we use SOCS (shape, outlier, center, spread) to describe univariate distributions or FODS (form, outliers, direction, strength) to describe scatter plots.
Some others you can use:
- EMC3 for constructing a confidence interval (Estimation, Measure, Check, Compute, Communicate results)
- PANIC (Parameter of interest, Assumptions, Name the confidence interval, Interval, Conclusion)
- HMC3 for running a hypothesis test (Hypotheses, Method, Check, Compute, Communicate results)
For an even more comprehensive list of tips: The Ultimate List of AP® Statistics Tips
Return to the Table of Contents
AP® Statistics Exam: 5 Test Day Tips to Remember
When test day finally comes, it is normal to feel a little jittery and anxious about the exam. Instead of last minute cramming, here are some tips and tricks for test day that will help you walk into the exam feeling confident!
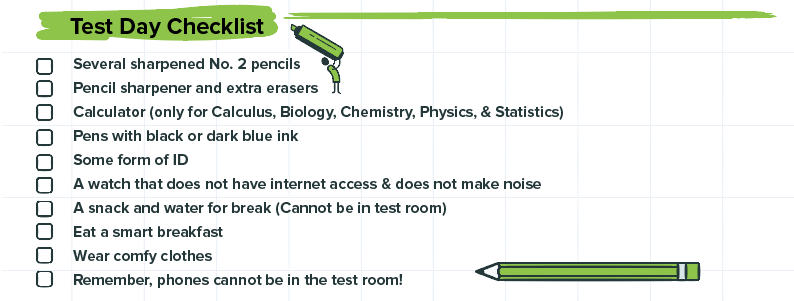
1. Make sure you have brought the physical items that you need for the exam.
Forgetting your ID card or calculator can be deal breakers, while misplacing extra erasers and watches are minor inconveniences. Here’s a quick checklist that you can use to make sure you have all the essentials before you leave home.
2. Watch your time and prioritize finishing the test completely.
If you get stuck on a problem, skip it and come back to it later. Give yourself time checks to get through each part of the exam, budgeting an extra 20 minutes at the end to check over your work, clarify explanations, and finish missing problems.
3. If you cannot do question (a) of a multi-part free response question, no worries! You can make up a value and use that for subsequent parts,
or explain what your process would be had you successfully answered part (a).
Remember, the exam graders assess your work holistically and are looking for areas to give you credit. If you can clearly communicate your thinking, you will be fine.
4. Beware of these common mistakes in statistics:
- Confusing blocking (used to assign treatments) and stratifying (used to collect a sample)
- Stating that a claim is either correct or incorrect, rather than citing evidence that supports the claim
- Adding standard deviations instead of adding variances when combining random variables
- Forgetting to use the words “predicted” or “on average” when interpreting slope of a regression model
- Confusing confidence levels (the proportion of successful capture) with confidence intervals (the lower and upper bounds of an estimate)
- Mixing up Type I and Type II Errors
- Forgetting to label axes and graphs
You don’t need to memorize all of these, but you should know which ones you tend to slip up on from previous practice tests. Keep them in mind at the start of the exam and, once the exam begins, jot them down on a piece of scrap paper for future reference.
5. Eat a good breakfast and relax!
Other than some light review with flashcards, you should avoid heavy studying and do what you can to put your mind at ease on the morning of test day. Mimic an athlete on the day of a big race or game. Do some light stretches, eat a healthy breakfast, pump yourself up with positive messaging, and trust that your preparation will pay off come game time.
Return to the Table of Contents
AP® Statistics Review Notes and Practice Test Resources
Here are our favorite online resources to help you prep for the AP® Statistics Exam:
StatTrek
This website was founded by Harvey Berman, a business leader who left the corporate world to develop an educational website that teaches people statistics… for free! It is a one stop shop for most everything you need to learn statistics, acting as an online textbook for those who might not have access to a physical textbook or in-classroom resources.
- Use this site if: you have yet to learn the AP® Stats material in a classroom setting and need the tools to learn independently on a budget. It includes online tutorials of the full AP® Statistics curriculum, practice questions, and online calculators with statistical functions.
- Don’t use this site if: you are looking for a larger bank of practice problems that mimic the format of the AP® Stats Exam.
Dan Shuster
This site is created by a high school math teacher from Simi Valley, CA and provides concise summary notes + practice problems for each unit. In addition to AP® Statistics, his site contains materials for Algebra, Geometry, AP® Computer Science, and other math courses.
- Use this site if: you want to scan through the main points for each unit and dive into practice material (both Multiple Choice and Free Response Questions) for those topics.
- Don’t use this site if: you need more thorough explanations and feedback for the practice problems. The summary notes are essentially cheat sheets and reminders about big ideas, and the solution keys don’t provide extra commentary.
Return to the Table of Contents
Summary: The Best AP® Statistics Review Guide
We’ve covered a lot about how you can prepare for the AP® Statistics Exam and be confident in your skills. To wrap it all up, here’s a concise version of our study plan outlined above.
- The AP® Statistics Exam has two parts and will take 3 hours total.
The exam covers topics from the following units:
- Unit 1: Exploring One-Variable Data
- Unit 2: Exploring Two-Variable Data
- Unit 3: Collecting Data
- Unit 4: Probability, Random Variables, and Probability Distributions
- Unit 5: Sampling Distributions
- Unit 6: Inference for Categorical Data: Proportions
- Unit 7: Inference for Quantitative Data: Means
- Unit 8: Inference for Categorical Data: Chi-Square
- Unit 9: Inference for Quantitative Data: Slopes
For more detail on each topic, see AP® Statistics: Course and Exam Description.
How to study for AP® Statistics: 7 Steps
- Take a full diagnostic test
- Identify topics that want to prioritize for practice
- Map out your study sessions in a calendar
- Learn and review concepts with notes or videos
- Do a LOT of practice problems and get feedback on right + wrong answers
- Take another full test under time pressure to practice pacing
- Relax the day before the exam
Best Tips for AP® Statistics:
- Know the language of statistics and use common phrases like “on average”, “predicted increase”, or “sufficient evidence to reject the null”. Use the handout: Top 10 Phrases to use in your Answers for AP® Statistics
- Practice identifying binomial variables: 1) repeated trials, 2) two possible outcomes, 3) a fixed probability of success, and 4) independent trials. Once you recognize it, you can quickly calculate probabilities using binompdf your calculator.
- Practice classifying statistical inference procedures using this applet on Classifying Statistics Problems, supplementing that with the article Name that Significance and the visual flowchart of inference
- When completing the Free Response section… do the easiest problem first, then the Investigative Task, then the other 4 questions. That way you don’t run out of time tackling the hardest (and most valuable) problem on the exam.
- Practice, practice, practice! We can’t say this often enough. As soon as possible, start doing high-quality and challenging practice questions from College Board, Albert, or AP® Statistics Review Books.
We hope you have found this review guide helpful. If you follow the advice in this article and walk into the exam with a positive attitude, we are 100% confident that you will be happy with your score. Good luck!


