- >>Weather by month // weather averages Nocera Inferiore
- >>Climate graph // Weather by Month Nocera Inferiore
- >>average temperature by month Nocera Inferiore
- >>Weather Nocera Inferiore
Nocera Inferiore is in the northern hemisphere. Its north to the equator line The onset of summer commences towards the conclusion of June and culminates by September. The months that constitute this season are referred to as June, July, August, September. The optimal period to plan a visit would be during the months of July, August.
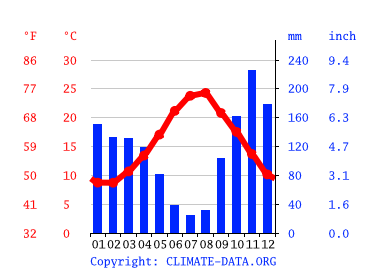
Climate graph // Weather by Month Nocera Inferiore

In July, the precipitation level plummets to a mere 24 mm | 0.9 inch. This month holds the title for being exceptionally arid. On average, the highest amount of rainfall occurs during November with a mean value of 226 mm | 8.9 inch.
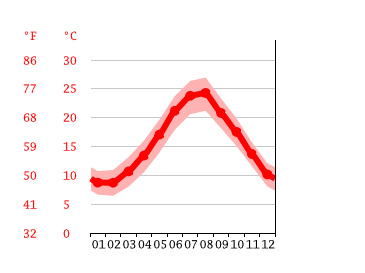
average temperature by month Nocera Inferiore

The month of highest temperature is August during which the average temperature reaches up to 24.3 °C | 75.7 °F. On average, the month of February is considered to be the coldest time of year with temperatures averaging at around 8.7 °C | 47.7 °F.
Weather by month // weather averages Nocera Inferiore
| Avg. Temperature °C (°F) | Min. Temperature °C (°F) | Max. Temperature °C (°F) | Precipitation / Rainfall mm (in) | Humidity (%) | Rainy days (d) | avg. Sun hours (hours) | |
|---|---|---|---|---|---|---|---|
| January |
8.7 (47.7) |
6.6 (44) |
10.7 (51.3) |
150 (5.9) |
75% | 10 | 5.0 |
| February |
8.7 (47.7) |
6.4 (43.6) |
10.9 (51.7) |
133 (5.2) |
73% | 9 | 6.0 |
| March |
10.7 (51.2) |
8 (46.5) |
13.2 (55.7) |
131 (5.2) |
75% | 8 | 7.0 |
| April |
13.4 (56.2) |
10.5 (50.9) |
16 (60.8) |
119 (4.7) |
76% | 9 | 9.0 |
| May |
17.1 (62.7) |
13.9 (57.1) |
19.6 (67.4) |
81 (3.2) |
76% | 7 | 10.0 |
| June |
21.2 (70.1) |
17.9 (64.2) |
23.7 (74.7) |
38 (1.5) |
74% | 4 | 12.0 |
| July |
23.8 (74.8) |
20.6 (69.1) |
26.4 (79.5) |
24 (0.9) |
71% | 3 | 12.0 |
| August |
24.3 (75.7) |
21.2 (70.2) |
27 (80.5) |
31 (1.2) |
70% | 4 | 11.0 |
| September |
20.8 (69.5) |
18.2 (64.7) |
23.3 (74) |
104 (4.1) |
70% | 8 | 9.0 |
| October |
17.5 (63.6) |
15.1 (59.1) |
19.9 (67.8) |
161 (6.3) |
75% | 8 | 8.0 |
| November |
13.7 (56.7) |
11.6 (52.8) |
15.8 (60.4) |
226 (8.9) |
75% | 10 | 6.0 |
| December |
10.2 (50.3) |
8.1 (46.5) |
12.1 (53.8) |
178 (7) |
74% | 10 | 6.0 |
| January | February | March | April | May | June | July | August | September | October | November | December | |
|---|---|---|---|---|---|---|---|---|---|---|---|---|
| Avg. Temperature °C (°F) |
8.7 °C (47.7) °F |
8.7 °C (47.7) °F |
10.7 °C (51.2) °F |
13.4 °C (56.2) °F |
17.1 °C (62.7) °F |
21.2 °C (70.1) °F |
23.8 °C (74.8) °F |
24.3 °C (75.7) °F |
20.8 °C (69.5) °F |
17.5 °C (63.6) °F |
13.7 °C (56.7) °F |
10.2 °C (50.3) °F |
| Min. Temperature °C (°F) |
6.6 °C (44) °F |
6.4 °C (43.6) °F |
8 °C (46.5) °F |
10.5 °C (50.9) °F |
13.9 °C (57.1) °F |
17.9 °C (64.2) °F |
20.6 °C (69.1) °F |
21.2 °C (70.2) °F |
18.2 °C (64.7) °F |
15.1 °C (59.1) °F |
11.6 °C (52.8) °F |
8.1 °C (46.5) °F |
| Max. Temperature °C (°F) |
10.7 °C (51.3) °F |
10.9 °C (51.7) °F |
13.2 °C (55.7) °F |
16 °C (60.8) °F |
19.6 °C (67.4) °F |
23.7 °C (74.7) °F |
26.4 °C (79.5) °F |
27 °C (80.5) °F |
23.3 °C (74) °F |
19.9 °C (67.8) °F |
15.8 °C (60.4) °F |
12.1 °C (53.8) °F |
| Precipitation / Rainfall mm (in) |
150 (5) |
133 (5) |
131 (5) |
119 (4) |
81 (3) |
38 (1) |
24 (0) |
31 (1) |
104 (4) |
161 (6) |
226 (8) |
178 (7) |
| Humidity(%) | 75% | 73% | 75% | 76% | 76% | 74% | 71% | 70% | 70% | 75% | 75% | 74% |
| Rainy days (d) | 9 | 9 | 8 | 9 | 7 | 5 | 3 | 4 | 7 | 8 | 10 | 11 |
| avg. Sun hours (hours) | 5.4 | 6.0 | 7.3 | 8.9 | 10.4 | 11.7 | 12.0 | 11.3 | 9.2 | 7.6 | 6.2 | 5.6 |
Data: 1991 - 2021 Min. Temperature °C (°F), Max. Temperature °C (°F), Precipitation / Rainfall mm (in), Humidity, Rainy days. Data: 1999 - 2019: avg. Sun hours
The precipitation variance between the months with the lowest and highest levels of rainfall is 202 mm | 8 inch. The fluctuation of temperatures across the seasons is referred to as 15.6 °C | 28.0 °F.
The month that sees the most relative humidity is May (70.26 %). The month with the lowest amount of relative humidity is August (70.26 %). The month with the highest amount of rainfall is December (14.07 days), whereas the one with the lowest precipitation level is July (4.37).
Nocera Inferiore weather and climate for every month
Hours of sunshine in Nocera Inferiore
- avg. hours of sun
- Total hours of sun


In the region of Nocera Inferiore, it has been observed that July is the month which experiences maximum daily sunshine hours, with an average duration of approximately 11.96. The total number of sunlit hours during this period amounts to a staggering sum of about 370.85.
The location of Nocera Inferiore experiences the least amount of daily sunshine hours during January, with an average duration of only 5.61. The total number of sunlight hours recorded in this month is equal to 173.8.
It has been estimated that the total annual sunshine duration in Nocera Inferiore is approximately 3098.26 hours. This translates to an average monthly value of roughly 101.69 hours for each month, on a consistent basis.
Airport close to Nocera Inferiore
The closest Airports of Nocera Inferiore are: Naples International Airport (NAP) 33.38km,Bari Karol Wojtyła Airport (BRI) 183.22km,Abruzzo Airport (PSR) 191.70km
You can reach Nocera Inferiore from this Cities by Plane: London (LTN), Paris (ORY), Edinburgh (EDI), Hamburg (HAM), Cologne (CGN), Liverpool (LPL), Kyiv (KBP), Lviv (LWO), Nantes (NTE), Basel (BSL), Frankfurt am Main (FRA), Tunis (TUN), Girona (GRO), Katowice (KTW), Geneva (GVA), Valencia (VLC), Maastricht (MST), Eindhoven (EIN), Luxembourg (LUX), Florence (FLR)
